Learning Methods for DNA Binding in Computational Biology
|
|
|
- Arlene Blake
- 5 years ago
- Views:
Transcription
1 Learning Methods for DNA Binding in Computational Biology Mark Kon Dustin Holloway Yue Fan Chaitanya Sai Charles DeLisi Boston University IJCNN Orlando August 16, 2007
2 Outline Background on Transcription Factors and Regulation Motivation Use of SVM Inferences Regulatory pathway prediction Human genome work


3 Wealth of Sequence and Biochemical Data The amount of sequence data available is rapidly increasing. Over 1,500 genome projects are ongoing. There is a need for techniques that can rapidly determine which sequences in a genome are functional.
4 Biology: Transcription and Regulatory Control Wasserman et al. Nature Reviews Genetics 2004,

5 Transcription: key to gene expression DNA is transcribed into RNA and eventually proteins Our concern: the first step - initiation of transcription

6 The transcription process RNA Polymerase runs along DNA to produce RNA copy Initiation of this process occurs when a TF binds to DNA at the start of transcription

7 The beginning: TF binds to DNA
8 Basics of Transcription 1. Promoter is a region of the DNA which tries to attract RNA polymerase so that transcription can be initiated. When cell transcribed it is expressed as a protein. 2. Differences between cells are determined by which proteins they produce, which are determined by which genes are expressed. 3. Promoter region of DNA contains regulatory sequences which attract proteins called transcription factors (TF). The presence of these proteins is required for transcription with RNA polymerase to begin. 4. Regulatory sequences consist of inexactly repeating patters (motifs) 5. Motifs stand out as highly similar patterns across species - their function is to attract very specific transcription factors.

9 Regulatory sequences on the DNA attract the TF Recurring attracting sequences are motifs or consensus sequences Regulatory sequences
10 Transcription Factor Binding Binding between DNA and transcription factors (TF s) is hard to predict chemically Goal: For a given TF in yeast or human, determine which genes promoters it binds to, and where.
11 Summary High throughput technologies, including ChIPchip data, are rapidly increasing experimental information about transcription factor binding to DNA Identification of TF binding sites in the genome remains difficult and incomplete Machine learning approaches have potential to supplant difficult experimental methods SVM methods studied here have sensitivity of 70% and positive predictive value of 90% on the average.
12 Summary Applications to inferences on biochemical pathway information are given


13 Binding Site Representation regulatory motif PSSM = Position Specific Scoring Matrix G. D. Stormo, DNA Binding Sites: Representation and Discovery., Bioinformatics ,2000 W. W. Wasserman and A. Sandelin, Applied Bioinformatics for the Identification of Regulatory Elements, Natue Reviews Genetics ,2004.
14 Support Vector Machines
15 Machine learning approach
16 Machine learning approach
17 Use of feature maps
18 Sample feature maps
19 Sample feature maps
20 Sample feature maps
21 Concatenation of feature spaces
22 Concatenation of feature spaces
23 Basic SVM setup: the discriminating function f
24 Basic SVM setup: the kernel
25 Basic SVM setup: the kernel
26 Basic SVM setup: diagram
27 Feature spaces MOT: Motif hits in S.cerevisiae CON: Motif hits conservation 18 organisms PHY: Phylogenetic profile EXP: Expression correlation GO: GO term profile KMER: K-strings 4,5,6-mers S1: Split 6-string 1 gap kkk_kkk
28 Feature spaces S2: Split 6-string 2 gaps kkk kkk S3: Split 6-string 3 gaps kkk kkk S4: Split 6-string 4 gaps kkk kkk S5: Split 6-string 5 gaps kkk kkk S6: Split 6-string 6 gaps kkk kkk S7: Split 6-string 7 gaps kkk kkk S8: Split 6-string 8 gaps kkk kkk
29 Feature spaces M01: 6-string with 1 mismatch (count 0.1) M05: 6-string with 1 mismatch (count 0.5) ENT: Condition specific TF-target correlation BIT: Nucleotide sparse binary encoding CRV: Promoter Curvature prediction HC: Homolog Conservation HYD: Hydroxyl Cleavage
30 Feature spaces KPo: Kmer median positions from start KPr: Kmer Probabilities (-log pval) MT: Promoter Melting Temperature-20bp window DG: Promoter Melting Delta G profile-20bp win BND: Promoter bend prediction
31 Feature spaces Many of these methods are not so reliable on their own, but can combine using statistical inference to yield a more powerful prediction scheme.


32 Promoter Sequences Motif Detection using Position Specific Scoring Matricess for 163 TFs Selection of Features: Rationale Overrepresentation (Degeneracy) Analysis Count motifs for each TF-target pair Conservation Analysis Using 18 Genomes Expression Correlation Analysis Experiments
33 Degeneracy: Repetitive TF Binding TF 1 Site 1 Site 2 Some transcription factors have a preference for repetitive motifs. Sites P(True 2 hits) = 2 P(True 1 hit) Having more than one detected binding site for a TF in the upstream region of a gene increases the likelihood that the TF truly binds the gene. This is Supplementary Table 5 From C. Harbison, E. Fraenkel, R. Young and e. al., Transcriptional Regulatory Code of a Eukaryotic Genome, Nature ,2004.


34 Conservation Link: Shadowing TF 1 S. cerevisiae C.elegans S. mikatae H. sapien M. musculus... = 18 genomes TF binding site Conservation of a TF binding site in several orthologous upstream regions increases the likelihood that a potential site is a True site Genomes S.cerevisiae S.pombe H.sapien N.crassa S.bayanus S.mikatae S.kluyveri A.thalania R.norvegicus C.elegans M.musculus S.kudriazevii S.castelli M.grisea D.melanogaster P.falciparum A.gambiae S.paradoxus
35 Expression Analysis Expression Correlation Analysis Experiments Two methods can be used to explore expression relationships: 1. Transcription factors that are highly correlated with potential targets are more likely to regulate those targets. 2. Pairs of genes with highly correlated expression are more likely to be regulated by the same TF.
36 SVM Algorithm 26 feature spaces lead to 26 kernels SVM forms hyperplane Kernel (generalized inner product)
37 Kernel Choices
38 Probabilistic Intepreptation (Platt) Rank the data by = posterior probability of positive classification given distance of x from hyperplane. Result: empirically based confidence levels given to SVM predictions.

39 Overall Algorithm Synthesizing a single classifier from various data sources
40 Undersample negative set features genes Trainin g Set leave-one-out cross validation loop Feature Reduction and Classifier Construction SVM-RFE to select top 1500 features. Train Platt s SVM on selected features. evaluate on test set Final Training Classifier Single Accuracy Estimate Testin g Set Testing Set Repeat validation with new resampling of negatives. Average the Accuracy estimates over 100 repeats. 100X Average Accuracy
41 Weighting schemes for kernel sums Weighted sums of kernels are taken: Scale with α i = Scaled F1 score Square of scaled F 1 score Squared tangent of F 1 score (note latter have effect of emphasizing higher and better F 1 values)
42 Kernels: accuracy scores
43 Summary of accuracy Best single kernel has sensitivity of.71 and PPV of.82 Squared-tan weighting gives sensitivity.73 and PPV of.89

44 Summary of accuracy

45 F1 Scores: Random vs. Genomic Data

46 Sensitivity vs. Example Size

47 SVM vs. PSSM Scan

48 Implications for Pathways: GCN4 and Amino Acid Biosynthesis

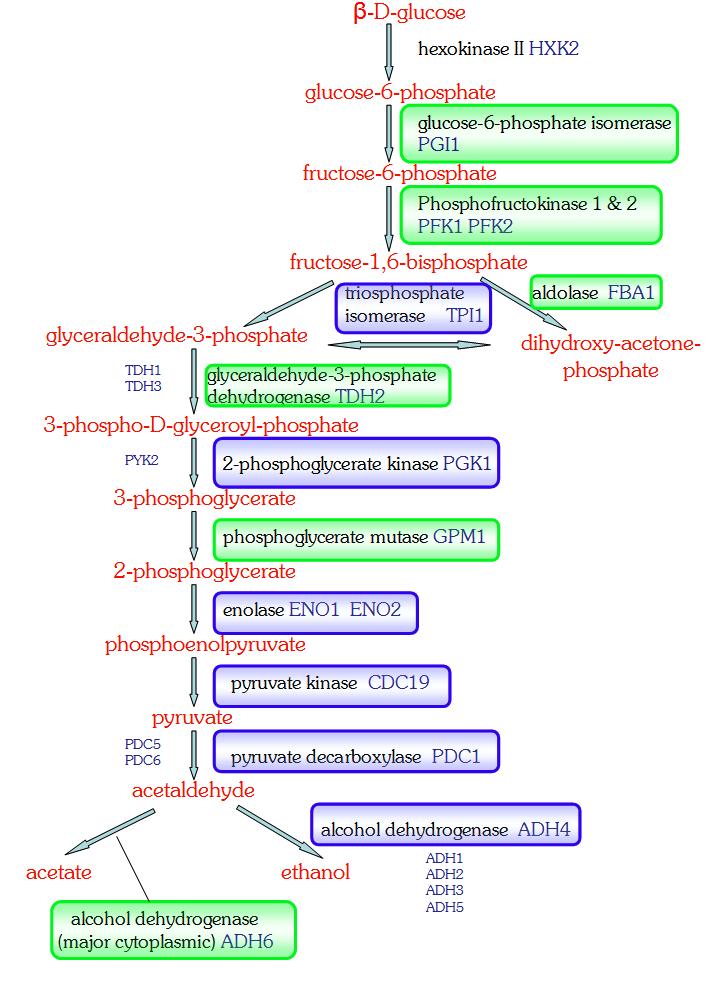
49 Implications for Pathways: RAP1 and Glycolytic/TCA Cycle

50 Degeneracy Significance P(k T) P(T k) Degeneracy 0 means not detected by Motifscanner
")
51 Conservation Results P(k T) P(T k)
52
53 Gene Gene Gene1 Exp3 Exp2 Exp1 Expression Phylogenetic Profile Gene Gene Gene1 Genome3 Genome2 Genome Motif Motif Motif1 Gene3 Gene2 Gene1 Conservation Motif Motif Motif1 Gene3 Gene2 Gene1 Degeneracy Dot products Kernel Matrices Combined Kernel Matrix SVM + / -

54
55 K-fold Random Resampling
56 Some human target predictions WT1 - a TF involved in Wilms' Tumor - makes up 8% of childhood cancers. SVM predictions for WT1 targets suggest new Wilms tumor models. Genes in significant loci include several oncogenes and tumor suppressors which are candidates for involvement in cancer progression.
57 Some human target predictions Example: chromosomal region 11p known to be involved in Wilms' Tumor. Newly predicted targets for WT1 are statistically enriched (.0005) for genes falling in this region. Three of these are possible tumor suppressors, i.e., RNH1, IGF2AS, and CD151. Other regions known to play a role in Wilms' Tumor also contain new target predictions (16q, 1p36.3, 16p13.3, 17q25, and 4p16.3). Anti-apoptotic (anti-programmed cell death) effects of WT1 are possibly related several new target genes, including BAX and PDE4B - may help mediate the effect.
 From literature (B) Rankings of candidate motif strings as determined by application of SVM to a string feature space str, and from another")
58 Some human target predictions Motif discovery used for new candidate WT1 binding motif: Fig. 3 - Wt1 target motifs: (A) From literature (B) Rankings of candidate motif strings as determined by application of SVM to a string feature space str, and from another oligo-analysis. (C) Top ranked motifs using the Weeder algorithm on SVM-based rankings.
59 Acknowledgments Dustin Holloway is responsible for much of the above analysis. Charles DeLisi initiated this project
60 Machine Learning Predictions: