Bcl-2 family member Bcl-G is not a pro-apoptotic BH3-only protein
|
|
|
- Katrina Ward
- 5 years ago
- Views:
Transcription
1 Bcl-2 family member Bcl-G is not a pro-apoptotic BH3-only protein Maybelline Giam 1,2, Toru Okamoto 1,2,3, Justine D. Mintern 1,2,4, Andreas Strasser 1,2 and Philippe Bouillet 1, 2 1 The Walter and Eliza Hall Institute of Medical Research, Melbourne, Australia 2 Department of Medical Biology, The University of Melbourne, Melbourne, Australia 3 current address: Department of Molecular Virology, Research Institute for Microbial Diseases, Osaka University, Osaka, Japan 4 current address: Department of Biochemistry and Molecular Biology, The University of Melbourne, Melbourne, Australia * Corresponding author: P. Bouillet, The Walter and Eliza Hall Institute of Medical Research, Molecular Genetics of Cancer Division, 1G Royal Parade, Parkville, Victoria 3052, Australia. Tel: ; Fax: ; bouillet@wehi.edu.au Running title: Analysis of Bcl-G and Bcl-G-deficient mice Keywords: apoptosis, Bcl-G, Bcl-2 family Supplementary information
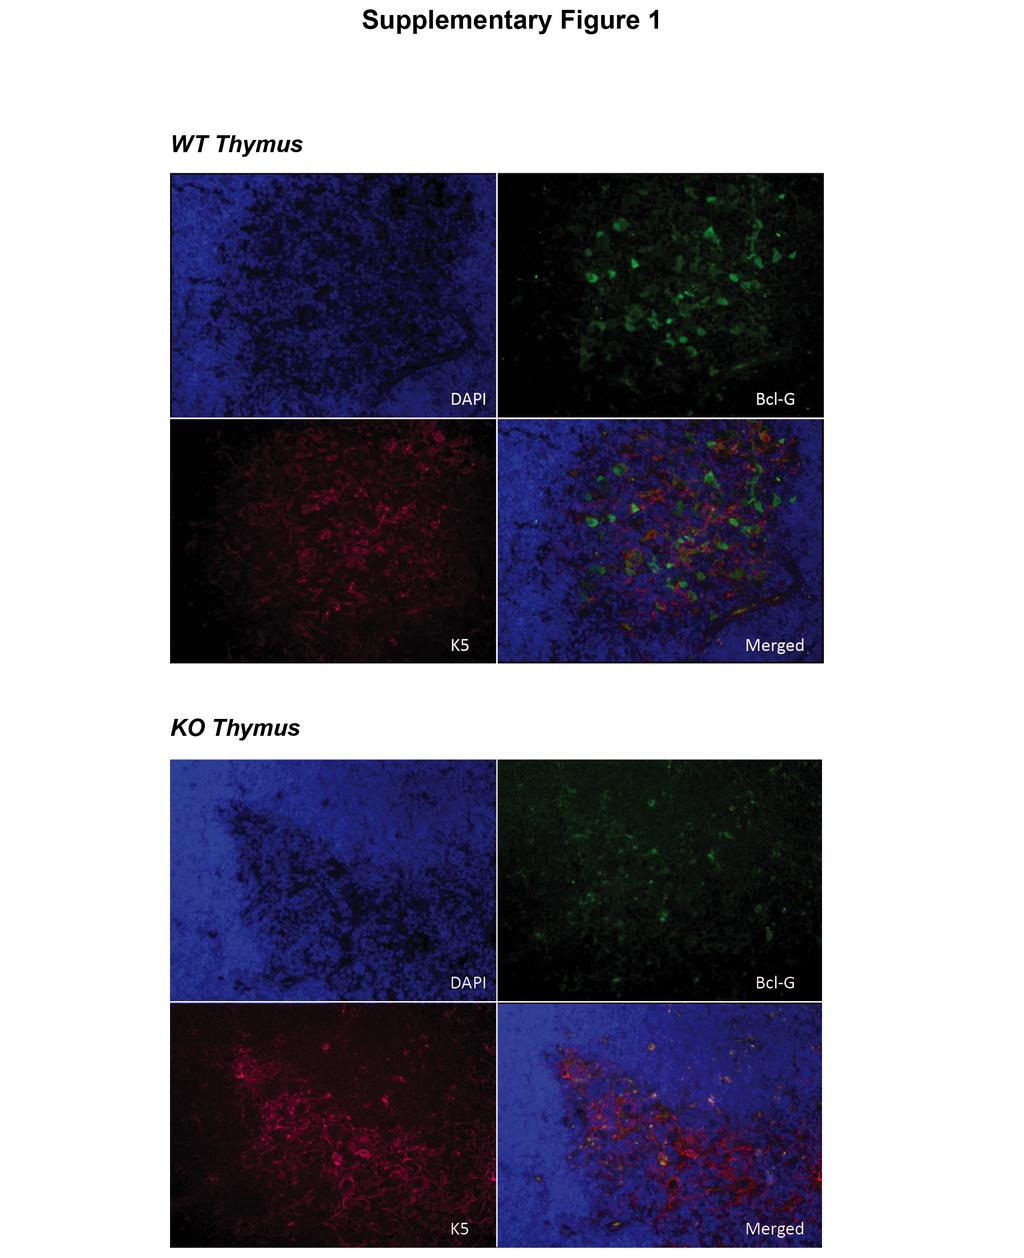
2 Supplementary Figure 1 Bcl-G is not expressed by Keratin-5 positive medullary thymic epithelial cells. Double immunofluorescence staining for Bcl-G and the medullary thymic epithelial cell (mtec) marker Keratin-5 (K5) showed that Bcl-G is not expressed in mtecs. Bcl-G and K5 staining were revealed, respectively, by Alexa488-conjugated goat anti-rat IgG secondary antibodies (green, for Bcl-G) and Alexa594-conjugated goat anti-rabbit IgG (red, for K5) secondary antibodies (Molecular Probes). Nuclei were stained with DAPI and cells were visualised using a fluorescence microscope. Representative photomicrographs taken at 100X magnification are shown. Supplementary Figure 2 Organ development is normal in Bcl-G-deficient mice Individual organ weights (expressed as percentage of total body weight) of 8- to 10- week-old female and male Bcl-G -/- and control WT mice are shown. n = for each group. Supplementary Figure 3 Bcl-G-deficient mice have normal proportions of splenic dendritic cells Splenic DC subset composition of Bcl-G -/- mice compared to WT controls. Lowdensity splenic DC preparations enriched by Nycodenz gradient centrifugation were further purified by immunodepletion of non-dc cell types. The remaining cells were then labelled with fluorochrome-conjugated antibodies against the indicated cell surface markers and analysed by FACS. Representative FACS plots showing the relative proportions of conventional DC (cdc, CD11c hi CD45RA - ), plasmacytoid DC
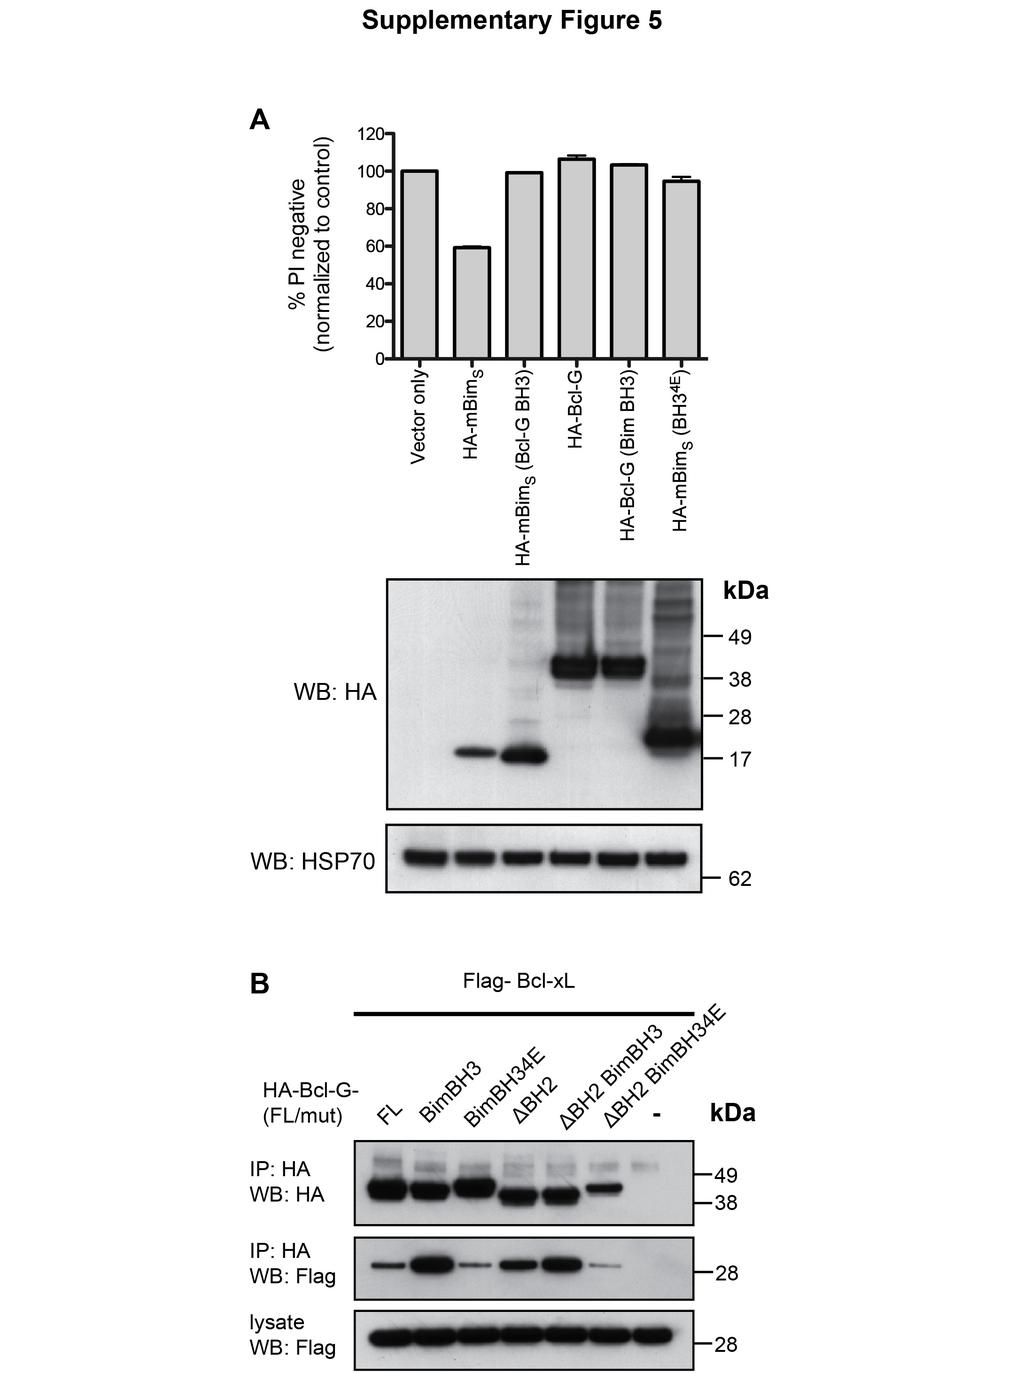
3 (pdc, CD11c int CD45RA + ), CD8 + cdc (gated cdc, CD8 + Sirpα - ) and CD8 - cdc (gated cdc, CD8 - Sirpα + ) are shown. Supplementary Figure 4 Loss of Bcl-G does not impair cross-presentation of exogenous antigen by CD8 + conventional DC. A) In vivo cross-presentation assay. WT or Bcl-G -/- mice were first primed with antigen by injection with OVA-coated spleen cells (OCS) or medium alone as control. After 24 h, CFSE-labelled OT-I TCR transgenic T cells were adoptively transferred into mice. Spleens were harvested 3 days later to determine the proliferation status (CFSE dilution) of OT-I T cells in response to stimulation by OVA antigen crosspresented by endogenous CD8 + cdcs. Representative histograms gated on live CD8 + TCRVα + OT-I T cells are shown. Data (means ± SEM) are representative of two experiments with three to five mice per group. B) Cytotoxic T lymphocyte (CTL) killing assay was performed to determine CD8 + T cell response to antigen crosspresentation in vivo. WT or Bcl-G -/- mice were primed in vivo with OCS. Unprimed mice were used as controls. After 6 days, a 1:1 mixture of CFSE lo non-antigen coated spleen cells:ova-coated CFSE hi target spleen cells were injected. Spleens of injected mice were harvested the next day to determine endogenous in vivo CTL response by quantifying percentage lysis of CFSE hi target cells compared to CFSE lo non-target cells using flow cytometry. Representative FACS profiles are shown. This experiment was performed once with four mice per genotype and treatment group. Supplementary Figure 5 Overexpressed Bcl-G does not kill 293T cells and does not bind Bcl-x L strongly
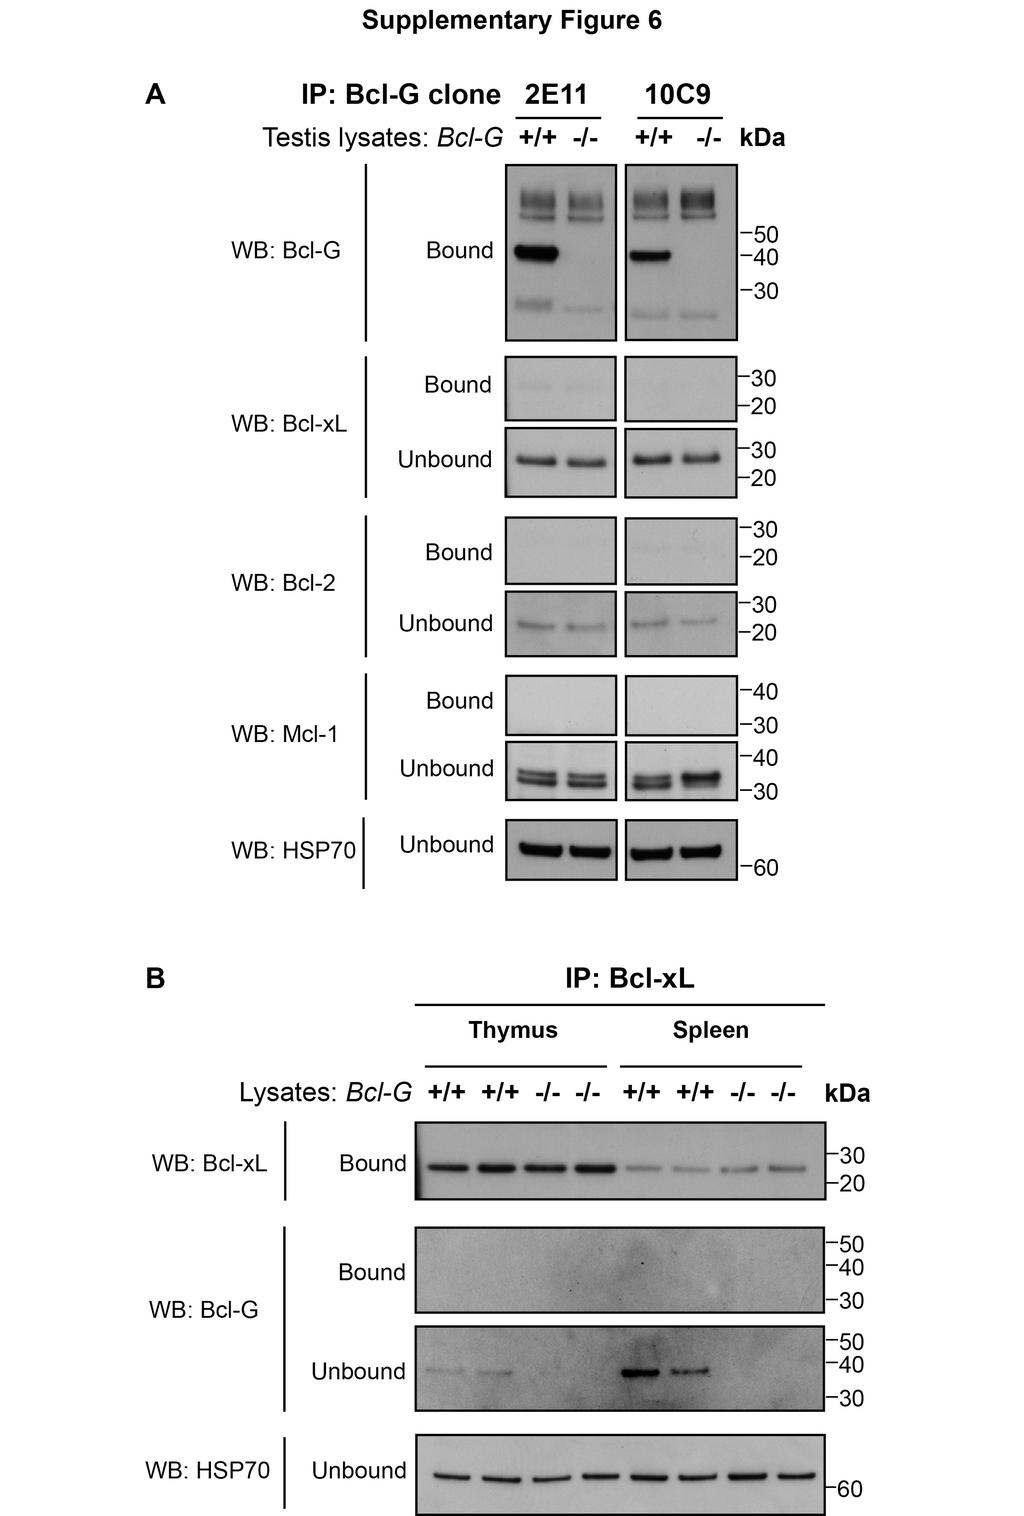
4 A) Survival of 293T cells transiently transfected with various mammalian expression constructs encoding HA-tagged Bcl-2 family members. Cells were harvested 48 h post-transfection and percentage viability was determined by propidium iodide staining and flow cytometry. Expression of the overexpressed proteins was confirmed by Western blotting with anti-ha antibodies. Re-probing the membrane for HSP70 served as a loading control. Data represent means ± SEM from three independent experiments. B) The BH3 domain of Bcl-G was replaced with that of Bim to determine the effect on binding to Bcl-x L. The Bcl-G mutant containing the Bim BH3 4E domain was used as a non-binding negative control (see text). HA-tagged WT Bcl-G and mutants were co-expressed together with Flag-Bcl-x L in 293T cells. Anti- HA immunoprecipitation was performed and the presence of Flag-Bcl-x L and HA- Bcl-G in the immunoprecipitates was analysed by Western blotting. Supplementary Figure 6 No detection of Bcl-G binding to the pro-survival proteins at the endogenous level A) Bcl-G was immunoprecipitated from WT and Bcl-G -/- testis protein lysates using mab clones 2E11 and 10C9 together with Protein G sepharose beads. Both the bound (immunoprecipitate) and unbound fractions (supernatant) were subjected to Western blotting to test for the presence of Bcl-G, Bcl-x L, Bcl-2 and Mcl-1. B) Endogenous Bcl-x L was immunoprecipitated from WT and Bcl-G -/- thymus and spleen protein lysates. The presence of Bcl-G and Bcl-x L in the bound and unbound fractions was determined by Western blotting. Probing for HSP70 served as a loading control.
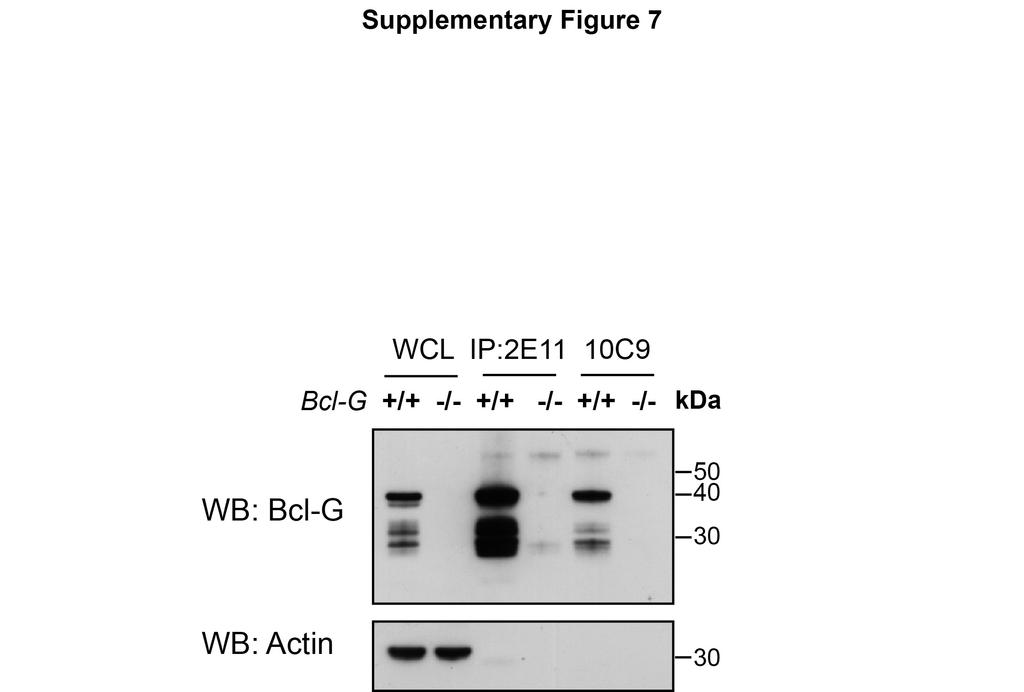
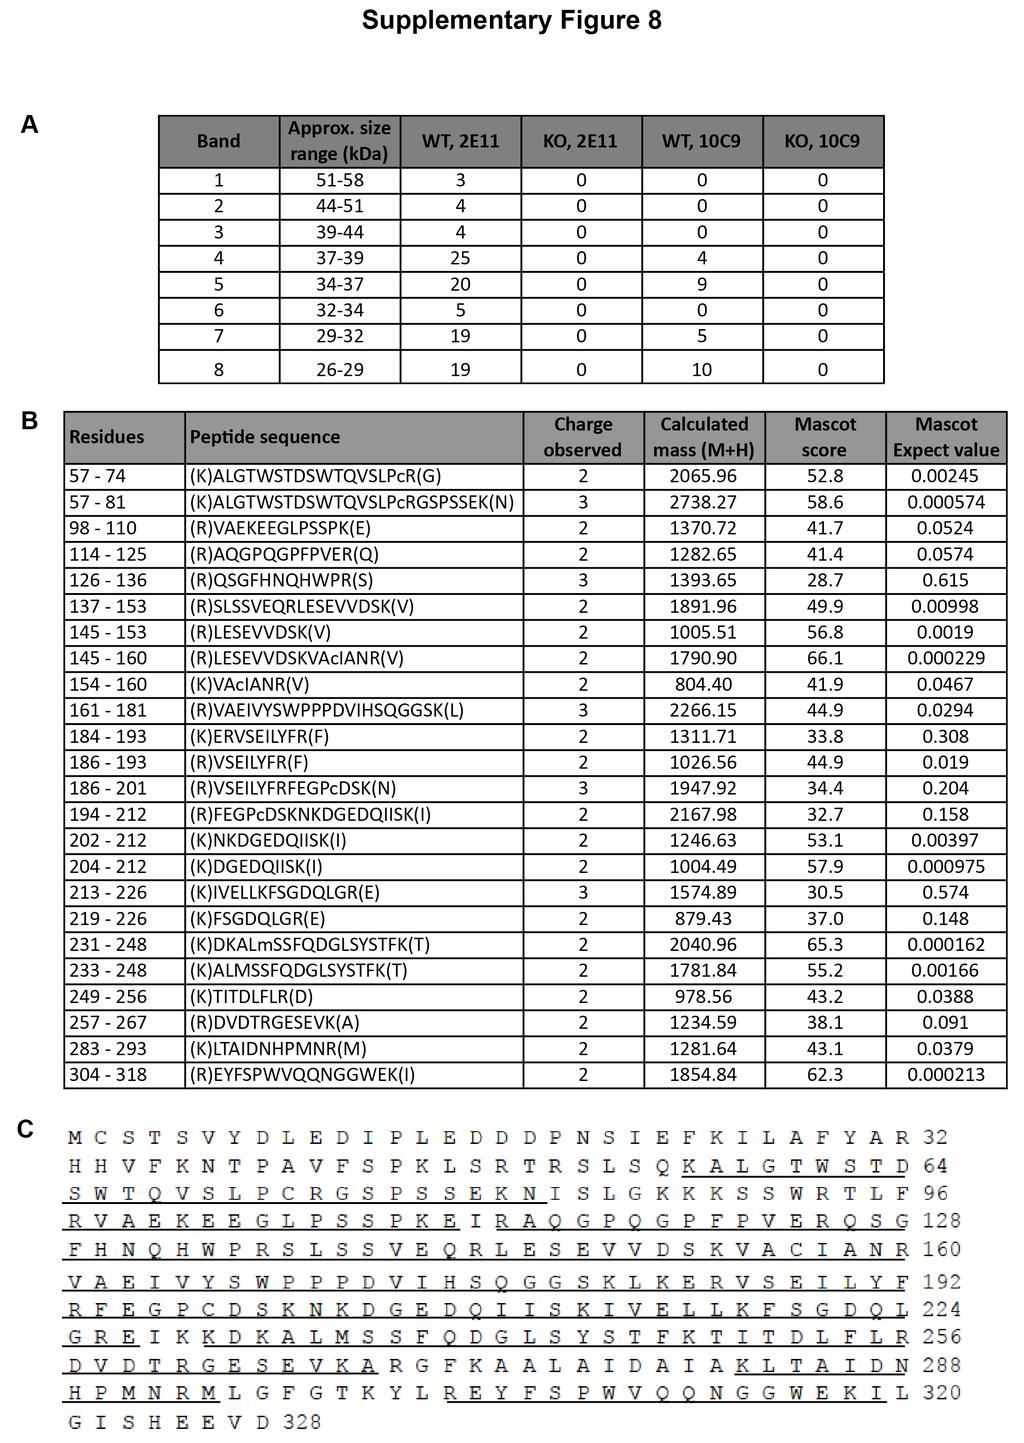
5 Supplementary Figure 7 Western blotting to confirm the absence of Bcl-G in the samples from the Bcl-Gdeficient mice that were used as negative controls in the IP-MS proteomic screen Whole intestinal epithelial cell lysates (WCL) and immunoprecipitates from each sample were resolved on SDS-PAGE gel transferred onto PVDF membranes. Western blotting was performed with anti-bcl-g mab clone 2E11 to determine the presence of Bcl-G protein in each of the lanes. Reprobing of the membrane with an antibody specific for actin served as a loading control. Supplementary Figure 8 Bcl-G peptides identified from our mass spectrometry analysis A) Summary of Bcl-G peptides found in our immunoprecipitation/mass spectrometry analysis. The corresponding region of the SDS-PAGE gel between approximately 26 and 58 kda was excised and divided into 8 equal segments to be analysed by mass spectrometry. The numbers of unique Bcl-G peptides in each band from each lane are shown. B) List of unique peptides within band 4 of lane 1 (WT, IP: mab 2E11). The first column indicates the position of the peptide amino acids within the complete protein sequence with the actual peptide sequence in the second column (m = oxidised methionine; c = alkylated cysteine). The third column shows the charge state of the precursor ion used to calculate the experimental mass of the peptide and the fourth indicates the actual mass of the matched peptide plus the mass of one proton. The MASCOT v search algorithm was used and the mascot score indicates that the score for an MS/MS match is based on the absolute probability that the observed match between the experimental data and the database sequence is a random event. C)
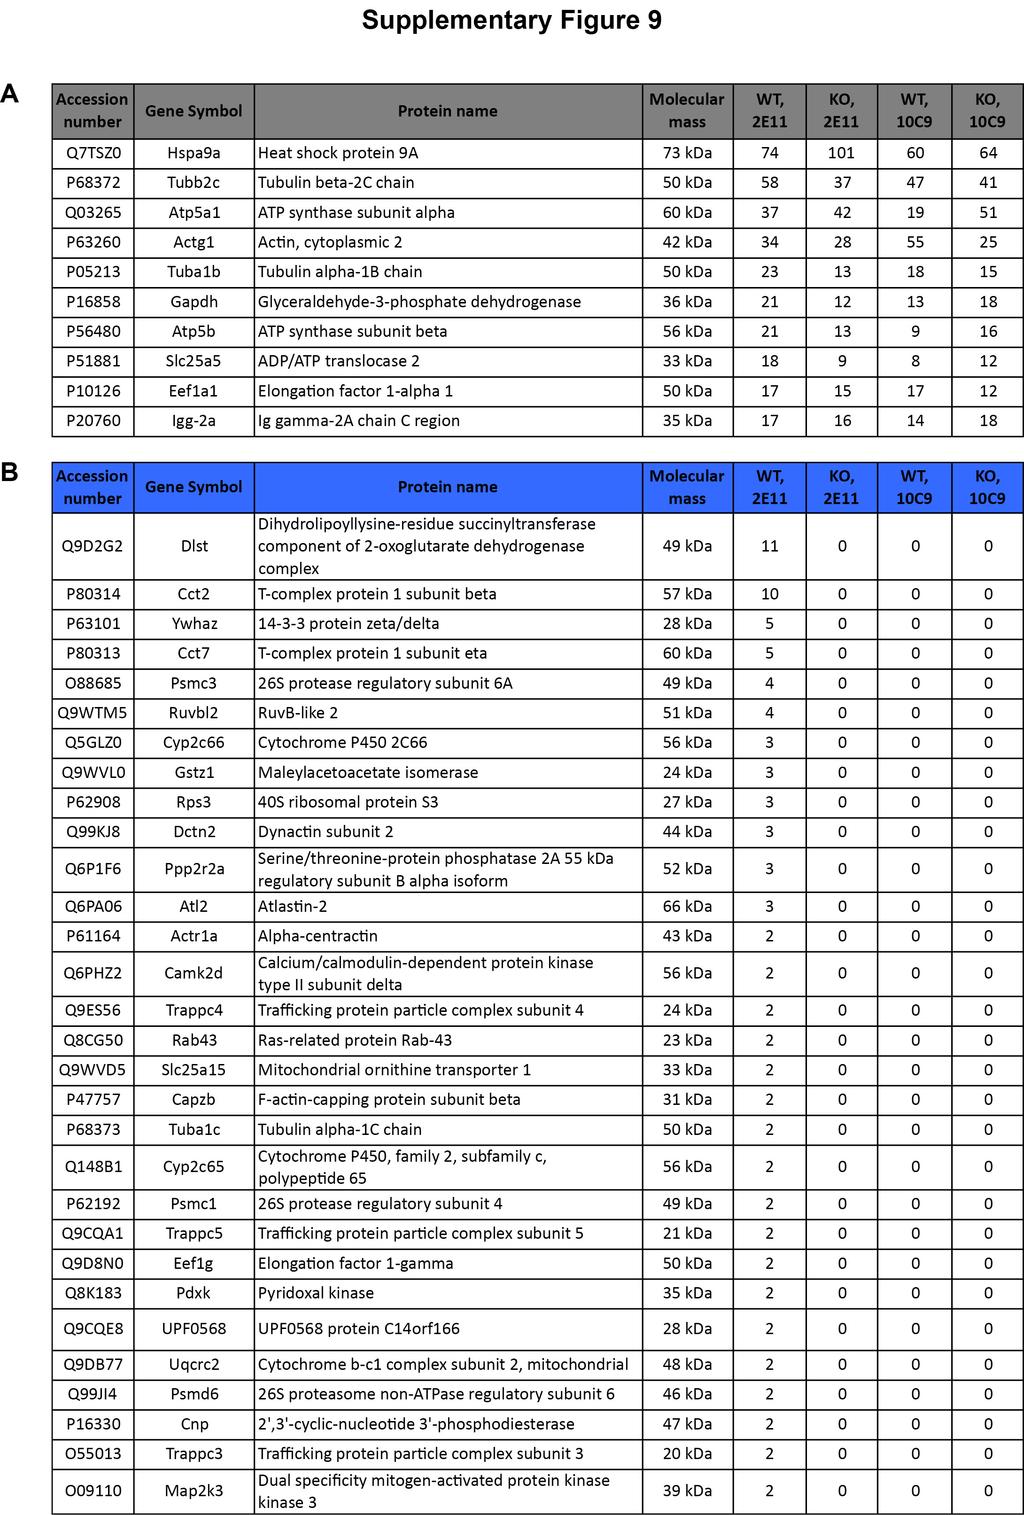
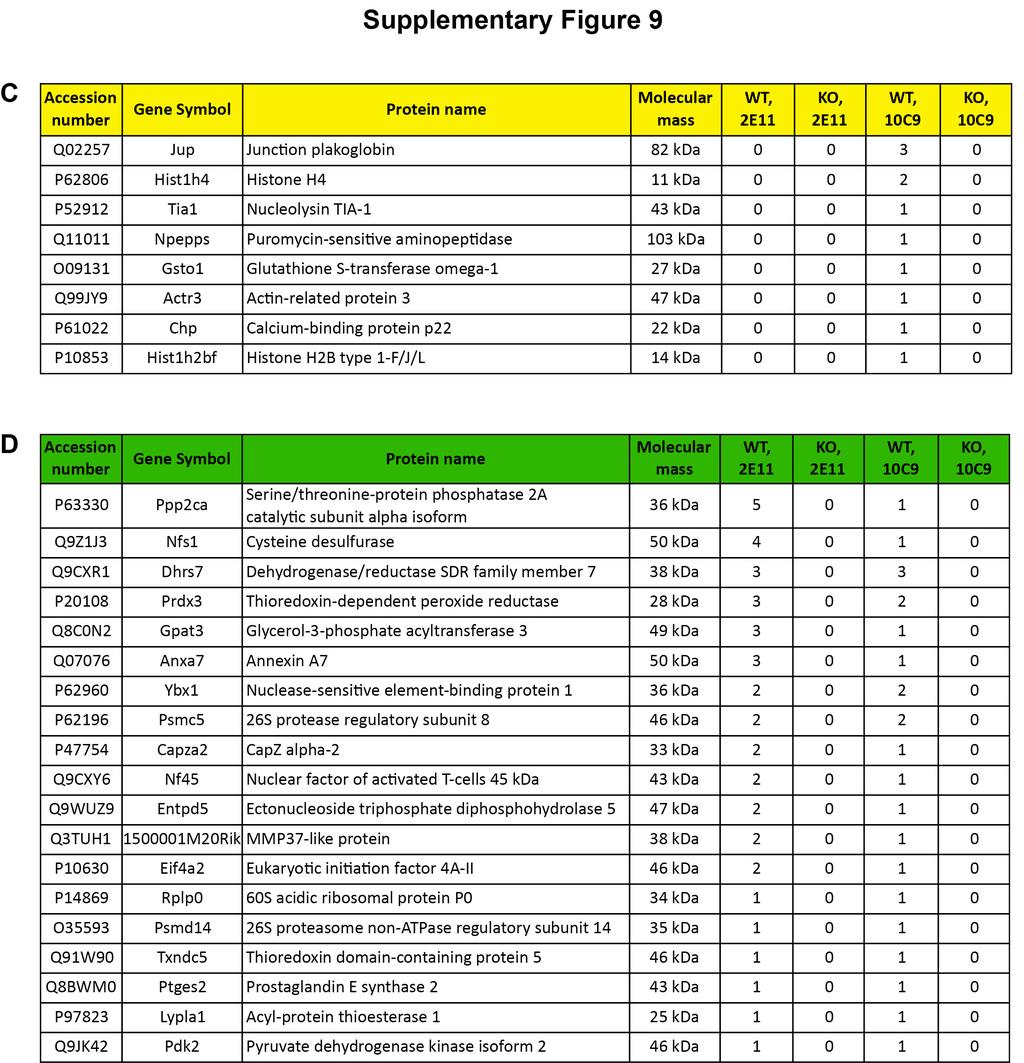
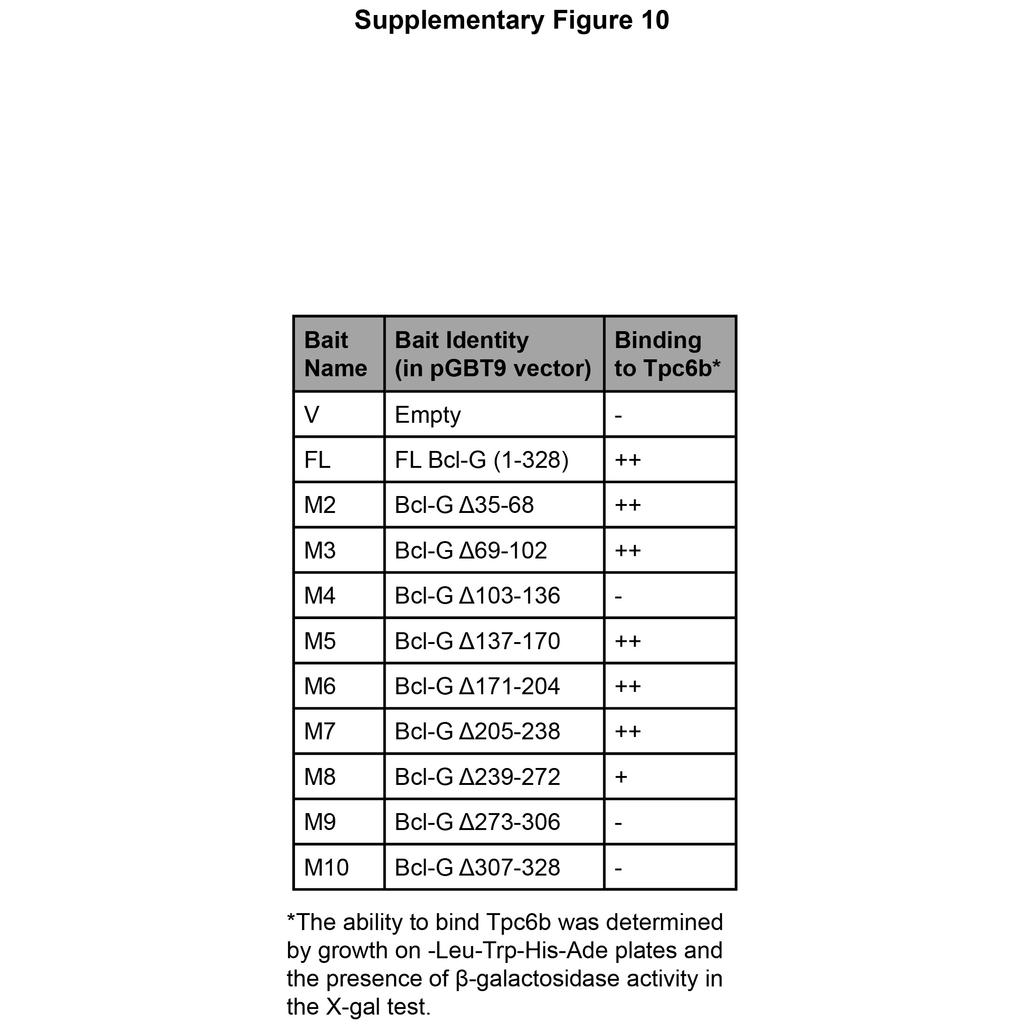
6 Amino acid sequence for mbcl-g (Q9CPT0) with peptides identified in band 4 of lane 1 (WT, IP: mab 2E11) underlined. Sequence coverage was 65.2% Supplementary Figure 9 List of candidate Bcl-G interacting proteins identified by immunoprecipitation and mass spectrometry Potential Bcl-G-interacting partners were identified as being absent in both of the negative control immunoprecipitation samples, since no Bcl-G was present in the input material (KO, IP: mab 2E11 and KO, IP: mab 10C9). The numbers of unique peptides in each of the eight bands in each lane were added together and the proteins ranked accordingly. A) List of the ten most abundant proteins present in the negative control lanes. B) Top 30 proteins immunoprecipitated together with Bcl-G by mab clone 2E11. C) List of Bcl-G-interacting proteins immunoprecipitated by mab clone 10C9. D) List of proteins found in Bcl-G complexes immunoprecipitated by both mab clones 2E11 and 10C9. Supplementary Figure 10 Determination of the regions within Bcl-G that bind to Trappc6b using the yeast twohybrid assay pgbt9-dbd empty vector or pgbt9-dbd-mbcl-g (full-length and truncation mutants M2-M10) were co-transformed with pgadt7-ad-trappc6b into the yeast strain AH109. Positive interactions were tested both by streaking transformants onto a -Leu-Trp-His-Ade plate and also by performing a β-galactosidase assay on yeast cells growing on -Leu-Trp plates. The amino acid positions of the truncations within the Bcl-G mutants are shown. ++ indicates strong binding while + indicates weaker
7 binding as scored by slower growth on minimal plate and less intense blue staining in the β-galactosidase assay.
8
9
10
11
12
13
14
15
16
17
18