DEVELOPMENT OF DNA MARKER SELECTION TOOLS IN AUSTRALIA S MAJOR PLANTATION EUCALYPTS
|
|
|
- Cori Byrd
- 5 years ago
- Views:
Transcription

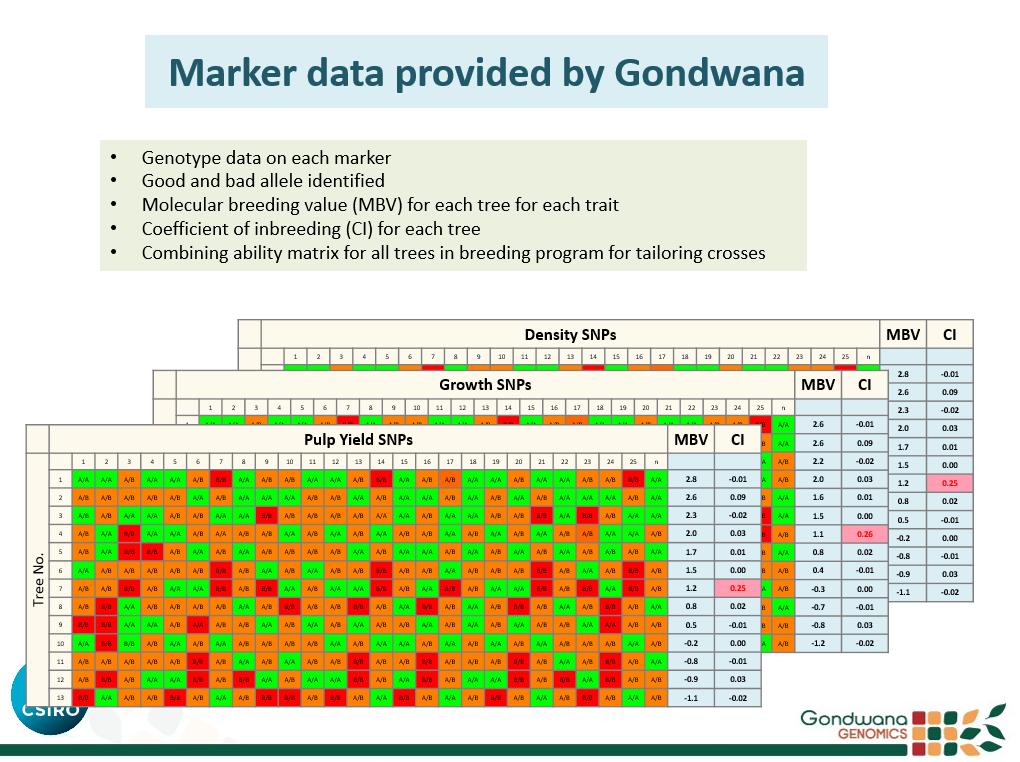
1 DEVELOPMENT OF DNA MARKER SELECTION TOOLS IN AUSTRALIA S MAJOR PLANTATION EUCALYPTS Dr Simon Southerton Gondwana Genomics Pty Ltd FWPA Webinar, 9 th Sept 2015
2 Gondwana Genomics Delivers marker-assisted selection services to the eucalypt plantation industry Exclusive license to marker technology developed in over last 10 years Gondwana employs all former CSIRO forestry marker scientists Collaborates with CSIRO in marker research Continually developing new markers for new traits
3 Outline Introduction to marker-assisted selection (MAS) Goals of Blue Gum Genomics project ( ) Major project results Marker validation Application of MAS in breeding programs
4 Major benefits of marker-assisted selection (MAS) DRAMATICALLY SHORTEN BREEDING CYCLE BY SELECTION IN SEEDLINGS ACCURATE SELECTION OF BEST PARENTS FOR CROSSES ACCURATE SELECTION OF ELITE OFFSPRING INCREASE SELECTION INTENSITY BY SCREENING 1000 S OF TREES SELECT ON MULTIPLE TRAITS AT THE SAME TIME
 to Aust.")


5 Markers are used widely in crops MAS routinely used in crop and animal breeding Example MAS helps deliver 1% gain per year (~$50M) to Aust. wheat industry Marker-selected traits Stress tolerance salt tolerance aluminium tolerance Disease resistance rust resistance nematode resistance virus resistance Flour traits flour quality flour colour gluten strength starchiness However, it has been difficult to identify useful markers in trees
6 Marker-assisted selection & tree breeding crops forest trees yield yield Marker-assisted selection 000 s generations 1-5 generations During domestication crops have lost much of their variation Trees are highly diverse (undomesticated) Large gains still to come from conventional tree breeding Markers can accelerate yield gains in trees while maintaining genetic diversity


7 Breeding is targeted at genes Trees are currently selected based on measured traits (e.g. pulp yield) We can now select trees with better genes that control these traits DNA Genes contain coded information to build and maintain the tree Genes are short stretches of DNA in the chromosomes
8 Markers identify good and bad genes Each tree has two copies of each gene (or allele), one from each parent Sometimes one of these genes is better than the other For example, one allele may give higher growth High growth allele... CGTAAGCACTAGCATTC... Low growth allele... CGTAAGCATTAGCATTC... C/T = marker Markers can identify better genes for selection during breeding
9 Markers can accelerate breeding TRADITIONAL BREEDING year breeding cycle Breeding Measure growth & wood properties Propagate Propagate MARKER-ASSISTED BREEDING 3-4 year breeding cycle Breeding Propagate T Markers allow shorter breeding cycles No need to measure growth and wood properties Breeding is quicker and focused on best trees
10 Capturing gains from MAS 100% 90% 80% Gains 70% 60% 50% Gain 5X 2. Design better crosses 3. Potentially higher accuracy 4. Higher selection intensity 40% 30% Gain 3X 1. Early selection 20% 10% select select Year 2029
11 GOALS BLUE GUM GENOMICS
12 Blue Gum Genomics Project - Goals Discovery of pulp yield markers in 100 genes in E. nitens. Hottest 100, March 2007 Discovery and application of molecular markers in E. nitens and E. globulus to accelerate and intensify selection for high value wood and growth traits in plantation trees. BGG September 2010
13 Commercial traits are complex traits Genetics + environment control trait variation Traits like KPY, density and growth are complex, and influenced by variation in many dozens of genes Example: KPY Probably several thousand genes involved in wood development We think variation in roughly 100 genes controls most variation in pulp yield

14 Marker discovery in humans Association studies began in humans after human genome sequenced Now being used widely for discovering SNPs causing diseases (e.g. heart disease, dementia, cancer etc ) ~3 million SNPs AA AG GG Genome-wide association studies are discovering SNPs controlling many diseases


15 Pioneering research in domestic blue gums CSIRO pioneered the use of association studies to discover markers Eucalypts ideally suited to association genetics (high diversity, low linkage disequilibrium) AA AG GG Published 1 st association study in trees - Thumma et al Genetics 1 st functional validation of perfect marker - Thumma et al Genetics
16 Perfect markers The marker occurs in a gene that influences the trait and it is usually the direct cause of variation in the trait. Cellulose Gene Associated SNP PrSNP PrSSR SNP1 SNP2 SNP3 SNP4 SNP5 SNP6 SNP7 SNP8 SNP9 SNP10 SNP always linked SNP unlinked
17 BGG - Key deliverables New populations for future association studies to replace aging provenance trials. Predicted pulp yield, cellulose content and other traits measured for four populations of E. nitens and four populations of E. globulus growing in contrasting environments. Solid wood traits (checking, MFA, density etc) measured in two large populations of E. nitens growing in contrasting environments. Marker-assisted selection service for selecting E. nitens and E. globulus trees with substantial improvements in pulp yield, growth and solid wood properties.
18 KEY RESULTS BLUE GUM GENOMICS
19 New association populations HVP Total of 289 E. globulus native seedlots, comprising both Otways (144) and Gippsland (145) provenances planted in adjoining trials in June 2013 on two Gippsland sites. A trial of E. nitens seedlots established spring Forestry Tasmania E. nitens (220 seedlots - 6,600 seedlings) and E. globulus (240 seedlots - 7,200 seedlings) planted in north-eastern Tasmania in 2014


20 Candidate genes HT transcriptome sequencing of xylem from high and low pulp yield trees Differentially expressed genes enriched for cytoskeleton & cell wall genes SNPs selected from among 2000 prioritised genes 3 low pulp bulks 3 high pulp bulks GENE CATEGORY TOTAL GENES UP REGULATED ENRICHMENT cytoskeleton organization microtubule-based process cell wall biogenesis carbohydrate metabolic process cell wall organization or biogenesis cellular cell wall organization or biogenesis actin filament-based process plant-type cell wall biogenesis actin cytoskeleton organization plant-cell wall organization or biogenesis Thavamanikumar, Southerton & Thumma (2014) PLoS ONE


21 Experimental populations sampled ~500 trees sampled in each trial Busselton Cambium - DNA Mt Barker E. globulus trials E. nitens trials West Ridgley Morwell Latrobe Tarraleah Geeveston Wood NIR analysis NIR


22 Growth and wood trait data E. nitens E. globulus

23 Solid wood data E. nitens Silviscan analysis of approximately 500 trees in both trials Additional 420 trees from 420 families with silviscan data used from Meunna TAS trial (from previous FWPA supported research Hottest 100)


24 Marker discovery using association genetics AA AG GG Candidate SNP markers selected from within candidate genes SNPs genotyped in four populations of about 500 trees for each species Analysis of variance used to identify markers significantly associated with trait Meta-analysis used to identify markers that are stable across the four trials
25 Summary of BGG marker results Markers Pulp Yield Growth Stiffness (MFA) E. globulus E. nitens
26 Summary of BGG marker results KPY markers for KPY identified in both E. globulus and E. nitens Stable across 4 trials containing approximately 1600 trees E. globulus SNPs stable between Otways and Flinders Island races Few SNPs (<5%) shared between the two species Growth (DBH) About 200 markers for growth identified in both E. globulus and E. nitens Stable across 4 trials containing approximately 1600 trees Roughly 20% of SNPs associated with KPY are associated with growth in E. nitens Majority of these SNPs are positively correlated for both traits Few SNPs (<5%) shared between the two species Solid wood traits 97 markers associated with MFA in E. nitens Many SNPs in genes that have a role in cytoskeleton development (actin, tubulin)
27 TESTING THE MARKERS
28 Testing marker predictions Based on DNA alone we predict the trait in trees that have already been phenotyped Predictive ability The correlation (r) between our marker predictions (MBVs) and phenotypic measurements in a modest number of trees Phenotype Marker prediction correlation (r) Accuracy Accuracy of phenotypic selection Accuracy of marker-based selection heritability (h 2 ) or h Predictive ability (r) heritability (h 2 ) or h
29 Marker predictions in E. globulus Predicting pulp yield in 71 E. globulus clones (5-6 ramets) trials test Marker predicted pulp yield Correlation (r) = 0.7 (P< 3.02E-11) Laboratory Pulp Yield Pulp yield (r = 0.7) predictive ability (r) Accuracy = heritability (h 2 = 0.5) = 0.7/0.7 = 100% Accuracy Growth (r = 0.43) = 0.43/0.48 = 90% (P< 0.002)

30 Pulp yield predictions in E. nitens Testing pulp yield markers in 64 E. nitens seed orchard trees 27 SNPs Molecular accuracy Correlation Accuracy = 0.48/ h 2 = 0.48/0.7 = 69% Phenotype accuracy Percent of markers used in prediction Marker predictive ability is limited by accuracy of phenotype Max. Accuracy = h 2 = 0.5 = 70%
31 Growth predictions in E. nitens Testing growth markers in 64 E. nitens seed orchard trees Molecular accuracy Correlation Accuracy = 0.27/ h 2 = 0.27/0.5 = 54% Phenotype accuracy Number of markers used in prediction Marker predictive ability is limited by accuracy of phenotype Max. Accuracy = h 2 = 0.25 = 50%
32 APPLICATION OF MARKER-ASSISTED SELECTION
33 Blue gum breeding cycle CURRENT Breeding Trait measurement and analysis Seed orchards MAS MAS Marker-assisted selection Breeding T Seed orchards Select better parents Select better progeny Select better seed orchard trees

34 Applying MAS in seed orchards MAS screen MAS screen Deployment gain 10% Progeny gain 15% Better deployment seed CSO trees TOTAL GAIN 25% New clonal seed orchard
35 Applying MAS to controlled crosses MAS screen parent 1 MAS screen parent 2 Parental gain 15% MAS screen seedlings Elite progeny Progeny gain 15% TOTAL GAIN 30%
36 Designing better crosses You can target complementary crosses to pyramid more good alleles. Parent 1 Parent 2 Targeted crosses Elite progeny

37 Marker genotypes clearly reveal better trees Tree 1 BEST Actual pulp yield marker data on 64 trees Tree 64 WORST 2 low PY alleles 1 low, 1 high PY alleles 2 high PY alleles
38
39 Benefits of marker-assisted selection SHORTEN BREEDING CYCLE BY SELECTION IN SEEDLINGS ACCURATE SELECTION OF BEST PARENTS FOR CROSSES ACCURATE SELECTION OF ELITE OFFSPRING HIGHER SELECTION INTENSITY BY SCREENING 1000 S OF TREES SELECT ON MULTIPLE TRAITS AT THE SAME TIME POTENTIALLY 4 TO 6 TIMES THE CURRENT RATE OF GENETIC GAIN OTHER BENEFITS ELIMINATE LABELLING ERRORS IN BREEDING PROGRAMS ELIMINATE INBREEDING MAINTAIN HIGH GENETIC DIVERSITY FOR FUTURE BREEDING COST SAVINGS ON TRAIT MEASUREMENTS
40 Summary New E. nitens (EN) and E. globulus (EGG) association populations established Predicted pulp yield, cellulose content and other traits in EGG and EN Solid wood traits in EN Large numbers of markers controlling growth and pulp yield identified in EN and EGG Large numbers of markers controlling wood stiffness (MFA) identified in EN Markers demonstrated to predict accurately in different populations growing in different environments Marker-assisted selection service developed with the formation of Gondwana Genomics spin off


41 Acknowledgements CSIRO Tricia Stewart Cate Smith Bala Thumma Rob Evans Saravanan Thavamanikumar Jeremy Brawner David Spencer Australian Tree Seed Centre Chris Lafferty Ben Bradshaw Dean Williams Stephen Elms Ross Gillies Kelsey Joyce Ian Ravenwood Andrew Lyons Contact Mobile:

42