SUPPLEMENTARY INFORMATION
|
|
|
- Laura Cameron
- 5 years ago
- Views:
Transcription
. (c) RT-PCR determination of,, or control GAPDH in MDA-MB-231 cells transfected with myc-tagged (WT) or kinase dead (KD).")
1 DOI: /ncb2743 Figure S1 stabilizes cellular protein level, post-transcriptionally. (a, b) and DDR1 were RNAi-depleted from HEK.293.-CBG cells. Western blots with indicated antibodies (a). RT-PCRs for the indicated mrnas (b). (c) RT-PCR determination of,, or control GAPDH in MDA-MB-231 cells transfected with myc-tagged (WT) or kinase dead (KD). (d) MDA-MB-231 cells added to uncoated (-), or collagen I coated plates (2mg/ml) (2D), or fully embedded in a 3D collagen I matrix (2mg/ml). Cells extracted, lysed and Western blots performed with the indicated antibodies. (e, f) MDA-MB-231 expressing CMV-CBG or CMV- -CBG added to plates coated with collagen I (2D) or imbedded in collagen I matrices (3D) of increasing amounts. (e) Bioluminescence determined and plotted as photon flux relative to control cells (not exposed to collagen I). Means and s.d. are shown for three independent experiments; three wells of cells were analyzed in each experiment. P-values were calculated using unpaired, two-sided Student s t-tests. * P<0.05; ** P<0.01. (f) Western blot of cells extracted from 3D matrices. (g) MDA-MB-231 cells containing -CBG were added to uncoated (-) or collagen I coated plates (2 mg/ml) (+) in the absence or presence of TGFb (2ng/ml) for 8 hours. Bioluminescence radiance determined and results plotted as photon flux relative to control cells (no collagen or TGFb). Means and s.d. are shown for three independent experiments; three wells of cells were analyzed in each experiment. Source data for this figure can be found in Supplemental table
 Aggregates of MDA-MB-231 cells depleted of,, or control (SCR) were embedded in 3D collagen I matrices (2 mg/ml) and allowed to migrate for 48 hours.")
2 Figure S2 influences breast cancer cell migration and invasion in vitro and metastases in vivo. (a) Aggregates of MDA-MB-231 cells depleted of,, or control (SCR) were embedded in 3D collagen I matrices (2 mg/ml) and allowed to migrate for 48 hours. Radial distance traveled (dotted lines) relative to control cells was determined. Scale bar 250 mm. Means and s.d. are shown for five independent experiments; ten cell aggregates were analyzed in each experiment. P-values were calculated using unpaired, two-sided Student s t-tests. ** P<0.01. (b) MDA-MB-231 cell proliferation curve; control cells (black line), -depleted cells (red line), -depleted cells (green line). Means and s.d. are shown for five independent experiments; three wells of cells were analyzed in each experiment. (c) Matrigel invasion assays. MDA-MB-231-Luc/GFP cells (blue columns) and 4T1-Luc/GFP cells (red columns) were depleted of,, or control (SCR). Results plotted as number of cells invading through to lower surface of membrane relative to control (SCR) cells. Means and s.d. are shown for three independent experiments; three chambers of cells were analyzed in each experiment. P-values were calculated using unpaired, two-sided Student s t-tests. ** P<0.01. (d) Fluorescent images of lung sections from mice 5 weeks after xenografted into breast tissue with the indicated 4T1-Luc/GFP cells. Scale bar 200 mm. (e) H&E staining of lung from xenografted mice 5 wks after tumor implantation. Control (shscr), - (sh), or depleted (sh). Scale bar 200 mm. Source data for this figure can be found in Supplemental table
3 Figure S3 Collagen fiber alignment at tumor-ecm boundary. (a, b) Second harmonic analyses of various primary tumors (control shscr, blue columns; depleted of sh, red columns; depleted of sh, black columns). N=3 for each tumor type. (a) The distribution of collagen fiber curvlettes at various angles relative to the tumor boundary. (b) The frequency of collagen fibers (% of total) at particular angles from the tumor boundary. TACS-2 and TACS-3 signature distributions are indicated. Means and S.E.M. are shown for one experiment; data was derived from three tumours (mice) per condition (n=3). (c) 4T1 cells were shrnaidepleted of (sh), (sh), or control (SCR) and Q-PCR determination for mrna levels for collagen I was determined. Results are plotted relative to control cells (shscr). Means and s.d. are shown for three independent experiments; 3 wells of cells were analyzed in each experiment. P-values were calculated using unpaired, two-sided Student s t-tests. * P<0.05; ** P<0.01. Source data for this figure can be found in Supplemental table
 Trichrome staining of indicated primary tumor slices.")
4 Figure S4 Collagen content of 4T1 tumors. (a) Trichrome staining of indicated primary tumor slices. Scale bars equal 200 mm. 4
 Q-PCR analysis to determine the relative level of mrna in MDA-MB-231 cells added to collagen I coated plates for 8 hours in the presence or absence of the MEKK1 inhibition (PD98059). Means and s.")
5 Figure S5 stabilizes protein through ERK2 interaction with and phosphorylation of. (a) Q-PCR analysis to determine the relative level of mrna in MDA-MB-231 cells added to collagen I coated plates for 8 hours in the presence or absence of the MEKK1 inhibition (PD98059). Means and s.d. are shown for three independent experiments; 3 wells of cells were analyzed in each experiment. (b) MDA-MB-231 cells were infected with lentiviruses expressing different ERK1 or ERK2 shrnai or control GFP, RFP, or SCR shrnai. Western blots were performed on cell extracts with the indicated antibodies. (c) Mapping the domain of that mediates its interaction with ERK2. Top stick figure of mutants used. HEK.293 cells were co-transfected with (Flag-tagged) and ERK2 (HA-tagged). was immunoprecipitated (anti-flag) and Western blot with the indicated antibodies performed on bound products. Right panel is and input control Western blot. (d) As in (c) except using indicated D domain mutants (red) of in co-immunoprecipitation experiments. Source data for this figure can be found in Supplemental table
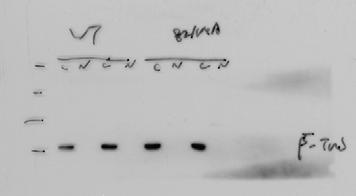
. The right panel is input controls. (b) MDA-MB-231 cells containing WT -CBG or 82/104A.")
6 Figure S6 stabilizes protein through ERK2 interaction with and phosphorylation of. (a) HEK293 cells were transfected with indicated plasmids. was immunoprecipitated and bound products Western blotted for the presence of ERK2 and (left). The right panel is input controls. (b) MDA-MB-231 cells containing WT -CBG or 82/104A.-CBG were depleted of or or control (SCR) with shrnai and added to uncoated (-) or collagen I coated plates (+) for 8 hours. Bioluminescence determined and plotted as photon flux relative to control cells on uncoated plates. Means and s.d. are shown for three independent experiments; 3 wells of cells were analyzed in each experiment. P-values were calculated using unpaired, two-sided Student s t-tests. * P<0.05; ** P<0.01, nd - no significant difference. Source data for this figure can be found in Supplemental table

7 Figure S7 shrnai depletion and rescue in MDA-MB-231 cells. (a) MDA-MB-231 cells were depleted of or or control (SCR) with shrnai (left three panels). In right three panels depleted cells were rescued with RNAi-resistant WT, 2A 82/104A mutant, or RK-MM ERK D domain binding site mutant. Cells were embedded in 3D collagen I gels (2 mg/ml) and allowed to migrate for 48 hours. Black broken lines indicate the front edge of migrating cells. Scale bars equal 250 mm. (b) Western blot of MSA-MB-231 cells in which endogenous was shrnai-depleted and rescued with exogenous RNAi-resistant WT, the 2A (82/104A) ERK phosphorylation mutant, or the ERK D domainbinding mutant RK-MM. Mobility of is shifted because of added Flag epitopes. Cell extracts were Western blotted with and antibodies. Note that the level of rescue mutants is equivalent to that of endogenous. 7
 MDA-MB-231 cells were infected with lentiviruses expressing control shscr or FAK shrnai, then added to uncoated (-) or collagen I (2 mg/ml) coated plates (+) for 8 hours.")
8 Figure S8 FAK is not required for collagen I induced stabilization of protein. (a) MDA-MB-231 cells were infected with lentiviruses expressing control shscr or FAK shrnai, then added to uncoated (-) or collagen I (2 mg/ml) coated plates (+) for 8 hours. Cell lysates were Western blotted with the indicated antibodies. (b) MDA-MB-231 cells pretreated with Src inhibitor PP2 (5 mm) for one hour or not (CTL) were added to plates coated with collagen I (+) or uncoated (-), in the presence of PP2. Cell extracts were Western blotted with the indicated antibodies. (c) MDA-MB-231 cells shrnai-depleted of MT1-MMP or control (SCR). Cell extracts were Western blotted with the indicated antibodies. (d) Cells from (c) were aggregated and embedded in 3D collagen I gels (2 mg/ ml) and allowed to migrate for 48 hours. Black broken lines indicate the front edge of migrating cells. Scale bar equals 250 mm. Means and s.d. are shown for three independent experiments; ten cell aggregates were analyzed in each experiment. P-values were calculated using unpaired, two-sided Student s t-tests. ** P<0.01. (e) Immunohistochemical analysis for protein expression level in 80 human invasive ductal carcinoma, 80 human invasive lobular carcinoma, or 15 cancer-associated normal breast samples. Source data for this figure can be found in Supplemental table


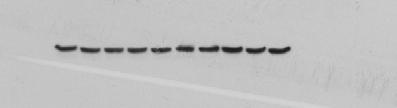
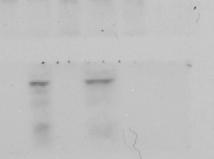
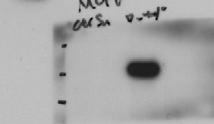
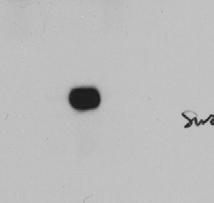
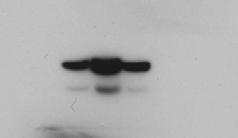
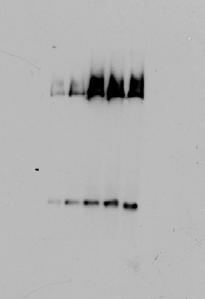
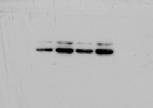
9 Figure 1a Figure 1d kda kda CBG Snail Twist ZEB-1 Figure 1f Myc (DDR) Figure 1e Myc () Figure S9 Full scans 9


 Figure")


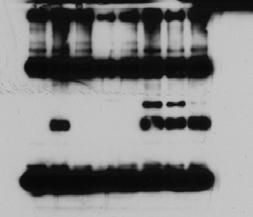
10 Figure 2a Figure 2b ptyr () ptyr Myc () Flag () Figure 2c Figure 2d Smad2 Figure S9 Full scans continued 10

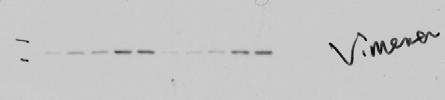
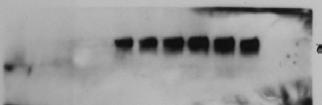
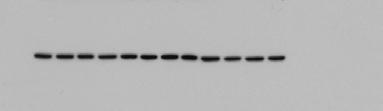
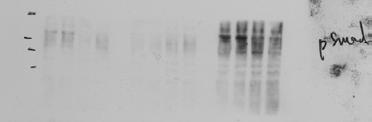
11 Figure 2e Figure 2f Myc () E-cadherin DDR1 Flag () E-cadherin Vimentin psmad2 Smad2 Figure S9 Full scans continued 11


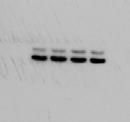
12 Figure 5a Figure 5b p-erk1/2 Erk2 ErK1/2 p-p38 p38 pakt Figure 5c kda GST GST Figure S9 Full scans continued 12


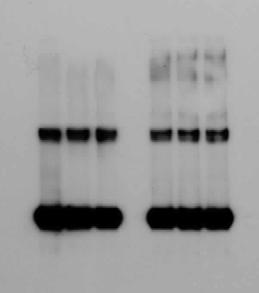
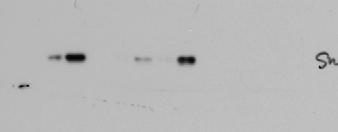
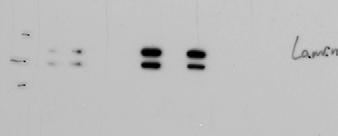
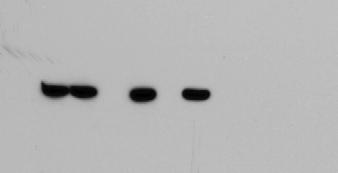
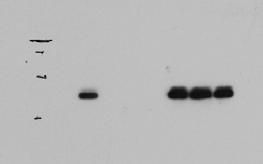
13 Figure 6b Figure 6d Tubulin HA (Ubiquitin) Lamin A/C Flag () Myc () Figure 6c Lamin A/C Flag () Tubulin Figure S9 Full scans continued 13


14 Figure 7a Figure 7e GSK3β perk1/2 pgsk3β Erk1/2 pgsk3β Figure 7b Figure 7c GSK3β pgsk3β perk1/2 GSK3β Erk1/2 MT1-MMP pgsk3β GSK3β Figure S9 Full scans continued 14


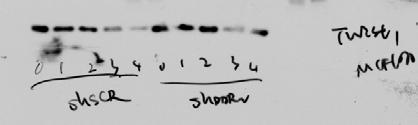
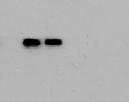
15 Figure S1a Figure S1b DDR1 DDR1 GAPDH Figure S1c GAPDH Figure S1d E-cad Vimentin kda Figure S1f kda CBG Figure S9 Full scans continued 15

")

")
")


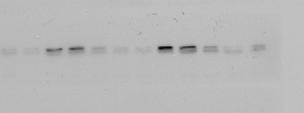
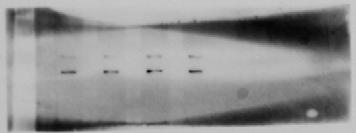
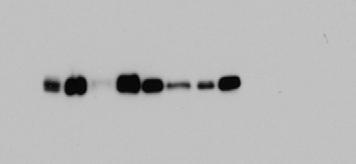
16 Figure S5b Figure S5c Erk1/2 Erk2 (HA) Erk2 (HA) (Flag) Figure S6a Figure S7b HA(Erk2) Flag() rr--flag HA (Erk2) Flag () Figure S9 Full scans continued 16


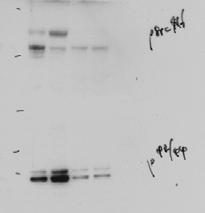
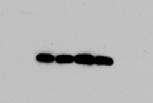
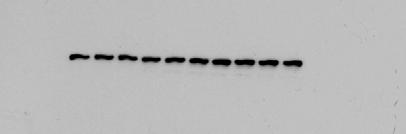
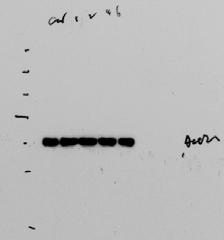
17 Figure S8a FAK Figure S8b psrc Figure S8c MT1-MMP pfak perk1/2 Erk1/2 perk1/2 Src Erk1/2 Figure S9 Full scans continued 17