Supplementary Figure 1. Two activation pathways and four conformations of β 2 integrins. KIM127 (red) can specifically detect
|
|
|
- Osborne Robbins
- 5 years ago
- Views:
Transcription
1 Supplementary Figure 1 Two activation pathways and four conformations of β 2 integrins. KIM127 (red) can specifically detect integrin extension (E + ) and mab24 (green) can specifically detect headpiece-opening (H + ). (a) Canonical switchblade pathway: E - H - (1, KIM127 - mab24 - ) E + H - (2, KIM127 + mab24 - ), E + H + (3, KIM127 + mab24 + ); (b) Proposed new pathway: E - H - (1, KIM127 - mab24 - ) E - H + (4, mab24 + KIM127 - ) E + H + (3, KIM127 + mab24 + ). 2
2 Supplementary Figure 2 Neutrophils roll on P-selectin and arrest when ICAM-1 and IL-8 are co-immobilized. Isolated primary human neutrophils (5x10 6 cells/ml) were perfused through the microfluidic device over a substrate coated with recombinant human P-selectin-Fc with or without recombinant human ICAM-1-Fc and IL-8 under shear stress of 6 dyn/cm 2. IS immobilized substrate; mab soluble monoclonal antibodies. (a) Adhesion blocking anti-cd11a (TS1/22), anti-cd11b (ICRF44), and anti-cd18 (IB4) mabs (10 μg/ml each) were added to the cell suspension, incubated for 20 minutes at RT and then perfused with the cells as described previously 49. (b-e) Neutrophils were incubated (3 min, RT, same as that used in homogeneous binding qdf imaging) with isotype control mabs (10 μg/ml), mab24/isotype (5μg/ml each), KIM127/isotype (5μg/ml each) and mab24/kim127 (5μg/ml each) prior to perfusion. n = 9 observations in b, n = 15 cells per group in c-e. The mean values (bars) and SEMs (error bars) are presented. ****p< in the unpaired student t-test. 3
3 Supplementary Figure 3 Binding kinetics of KIM127-DL550 (a, red) and mab24-dl488 (b, green) in qdf microscopy imaging. Unlabeled neutrophils ( cells/ml) were perfused through the complete substrate (P-selectin/ICAM-1/IL-8) for 5 minutes to allow them arrest. Then the cells were fixed by PFA. After washing with PBS for 5 minutes, the KIM127-DL550 and mab24-dl488 (5μg/ml each) antibodies were perfused to record the binding kinetics. MFI of both KIM127-DL550 and mab24-dl488 on the cell footprints (n=16 cells) in the recorded time-lapse images were obtained. The binding of the antibodies is very fast as expected (reaching >90% of maximum binding within 1 second). 4

4 5
5 Supplementary Figure 4 Image processing: generation of neutrophil footprint outline and binary cluster images. (a) Raw fluorescence image of cell membrane labeled with CellMask DeepRed. (b) Distance between the membrane and the substrate (Δ) calculated from the fluorescence intensity of cell membrane dye as described previously 33 to get the Δ map. (c) Pixel histogram. The dashed line indentifies the footprint as being closer than 95 nm from the substrate. (d) Outline of the neutrophil footprint. (e) Raw image of KIM127-DL550 and mab24-dl488. (f) Using Smart Segmentation in ImagePro (see methods), we generated binary cluster images, which identify both bright (arrows in e) and dim (arrow-heads in e) clusters in raw images. (g) The final binary cluster images only show the integrin clusters on cell footprints (grey outline). Scale bars in A, B and D-G are 5 μm. (h-j) MFI of KIM127-DL550 (red) and mab24-dl488 (green) in E + H + (h), E + H - (i) and E - H + (j) clusters. In each frame, clusters were classified and their DL550 and DL488 fluorescence intensities were averaged, resulting in three data points (h, j, k) per frame. The mean values (bars) and SEMs (error bars) are presented. MFI = (intensity - background) / (maximum - background). (k-l) 2D plot KIM127 MFI (y-axis) vs mab24 MFI (x-axis) of the 2506 clusters analyzed. Uncolored (k) and colored (l) plot showed that E + H - (red), E - H + (green) and E + H + (yellow) clusters clearly separated. (m-n) Histogram showing the ratio of mab24 MFI vs KIM127 MFI of the 2506 clusters analyzed. Uncolored (m) and colored (n) histograms showed individual peaks for the E + H - (red), E - H + (green) and E + H + (yellow) clusters. 6
6 7
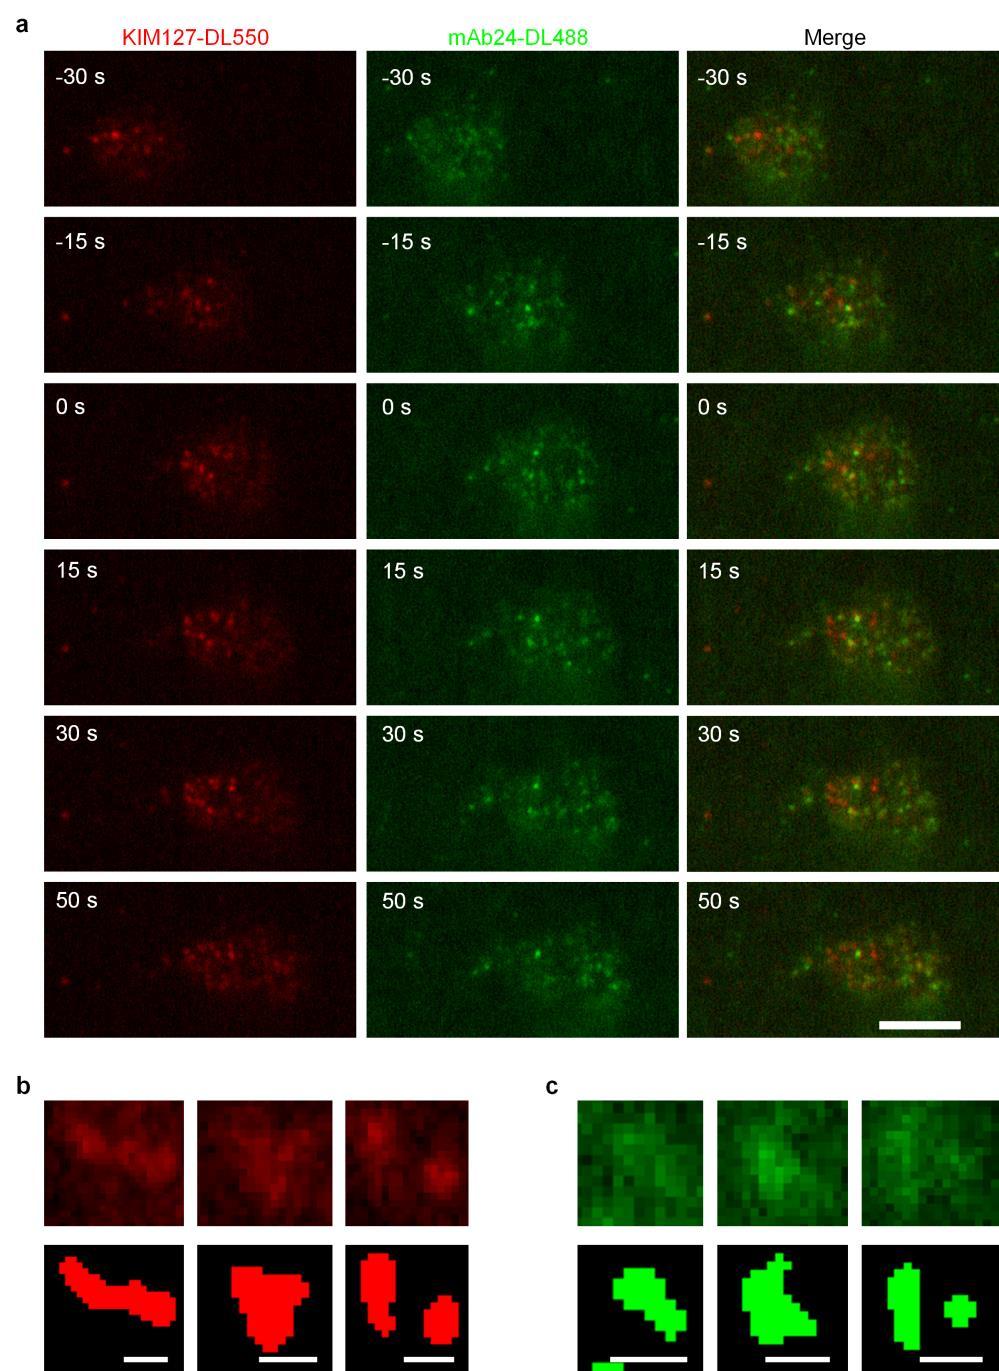
7 Supplementary Figure 5 Raw fluorescence images showing the β 2 integrin extension (KIM127) and headpiece-opening (mab24) on human neutrophil footprint during rolling on P-selectin/ICAM-1/IL-8 substrate. (a) Raw fluorescence images used to generate Figure 1d-f. Scale bar 5 μm. (b-c) Comparison of raw fluorescence images and processed binary images for typical KIM127 (b) or mab24 (c) clusters. Cluster morphologies are preserved in binary clusters. Scale bar 0.5 μm. 8
8 Supplementary Figure 6 Integrin clusters during neutrophil rolling and arrest on P-selectin, ICAM-1 and IL-8. Number (a), total area (b) and average size (c) of E + H + (yellow), E + H - (red), and E - H + (green) clusters over 15 seconds (n=8 cells). The mean values (bars) and SEMs (error bars) are presented. Each cell is represented by one dot. Arrest at time = 0 s. 9
 The extended conformation of β 2 integrins was identified by DL488 conjugated KIM127 (green), and the open headpiece conformation of β 2 integrins was identified by DL550 conjugated mab24 (red).")
9 Supplementary Figure 7 Switching mab-conjugations. (a) The extended conformation of β 2 integrins was identified by DL488 conjugated KIM127 (green), and the open headpiece conformation of β 2 integrins was identified by DL550 conjugated mab24 (red). Binary images; Clusters can be identified as E + H + (yellow), E + H - (green) or E - H + (red). The clustering of the β 2 integrins and the increase in cluster number for all three antibody combinations were observed, similar to Fig. 1d; scale bar 5 μm. (b) The two pathways of β 2 integrin activation were still observed after switching mab-conjugations: E + H - (green) or E - H + (red) clusters both transitioned to E + H + (yellow) clusters in 4 seconds as shown in Fig. 2a; scale bars 0.5 μm. 10
10 11
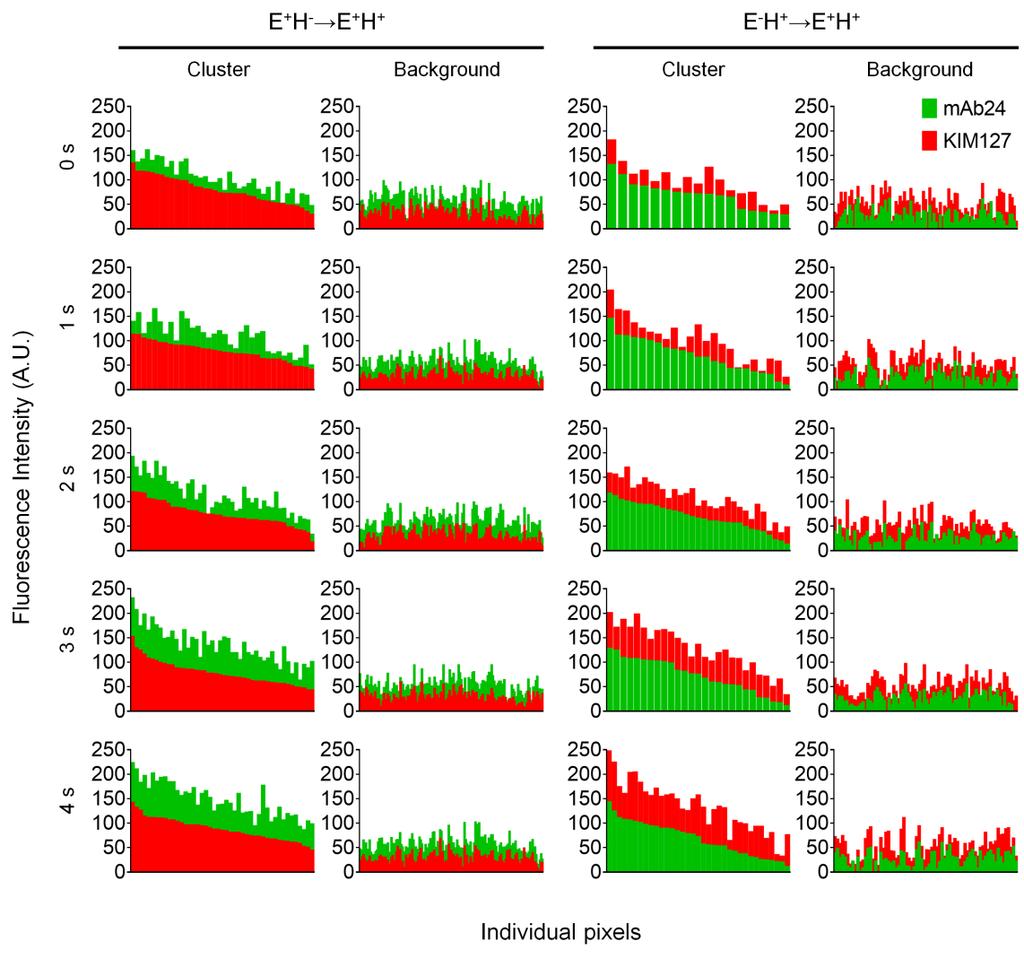
11 Supplementary Figure 8 Pixel statistics showing the transitions from one E + H - (left two columns) cluster and one E - H + (right two columns) to E + H + clusters within four seconds. Fluorescence intensities of both KIM127-DL550 and mab24-dl488 in each individual pixels of clusters or non-cluster background were obtained. The background intensities in both transitions did not vary significantly over time. In the transition from E + H - to E + H + cluster, KIM127-DL550 intensity remained similar,, whereas mab24-dl488 intensity increased. In the transition from E - H + to E + H + cluster, mab24-dl488 intensity remained similar, whereas KIM127-DL550 intensity increased. Each bar is one pixel. 12
, side-views (right row).")
12 Supplementary Figure 9 Hills (blue) and valleys (magenta) identified on time-lapse 3D topography of neutrophil footprints during rolling (-30 to 0 second) and arrest (0 to 60 seconds). The hills and valleys were identified using Smart Segmentation in ImagePro as described in the experimental procedures section. Top-views (Left row), side-views (right row). Horizontal scale bars 5 μm, vertical scale bar 50 nm. 13
, E + H - (red), or E - H + (green) integrins accessibility for binding in")
13 Supplementary Figure 10 Schematic showing the localization of the E + H + (yellow), E + H - (red), or E - H + (green) integrins accessibility for binding in trans. 14
14 Supplementary Figure 11 ICAM-1, 2, and 3 expression on human neutrophils assessed by flow cytometry. Parallel samples of human neutrophils (10 6 cells/ml) were incubated with isotype control (10 μg/ml), ICAM-1 mab (HA58, 10 μg/ml), ICAM-2 mab (CBR-IC2/2, 10 μg/ml) and ICAM-3 mab (CBR-IC3/3, 10 μg/ml), respectively, at room temperature for 30 minutes. After staining with FITC-conjugated secondary antibody, the expression of ICAM-1, ICAM-2 and ICAM-3 was assessed. ICAM-1 (red) and ICAM-3 (blue) expressed, ICAM-2 (green) near isotype control (gray). 15
15 16
16 Supplementary Figure 12 Blocking the cis interactions of E - H + integrin with neutrophil ICAMs promotes neutrophil aggregation. Neutrophil suspension from one donor was split in half and labeled with CFSE and CMRA, respectively. Top two rows: when the cis interactions of E - H + integrin with ICAMs were not blocked (no Abs and Isotype controls), aggregation between the CFSE and CMRA labeled neutrophils is rare (~2-3% without IL-8, ~4-5% with IL-8). Row three: when the cis interactions of E - H + integrin with ICAMs were blocked in one population (CMRA, HA58 and R6.5 for ICAM-1, CBR-IC2/2 for ICAM-2, CBR-IC3/1 for ICAM-3, 10μg/ml each), the aggregation between CFSE and CMRA labeled neutrophils increased (>3fold), to ~9.5% without IL-8 stimulation, and ~15% with IL-8, indicating that more trans bounds are formed when the cis interaction is eliminated. Bottom Row: Further blockade of β 2 integrins on the other (CFSE) population releases more ICAMs for binding in trans, which further increases the CFSE-CMRA neutrophil aggregation to ~19% without IL-8 and ~25% with IL-8. 17