Supplementary Figure 1. Localization of MST1 in RPE cells. Proliferating or ciliated HA- MST1 expressing RPE cells (see Fig. 5b for establishment of
|
|
|
- Ralph Porter
- 5 years ago
- Views:
Transcription
 were immunostained for HA, acetylated α-tubulin, γ-tubulin and counterstained with DAPI.")
1 Supplementary Figure 1. Localization of MST1 in RPE cells. Proliferating or ciliated HA- MST1 expressing RPE cells (see Fig. 5b for establishment of the cell line) were immunostained for HA, acetylated α-tubulin, γ-tubulin and counterstained with DAPI. Scale bar, 10 μm. 1
 Proliferating or ciliated mimcd3 cells transduced with GFP-SAV1 were immunostained for GFP, acetylated α-tubulin, γ-tubulin and counterstained with DAPI. Arrows indicate co-localized signals.")
2 Supplementary Figure 2. Localization and activation of Mst1/2-Sav1 in ciliated mimcd3 cells. (a) Proliferating or ciliated mimcd3 cells transduced with GFP-SAV1 were immunostained for GFP, acetylated α-tubulin, γ-tubulin and counterstained with DAPI. Arrows indicate co-localized signals. (b) Proliferating or ciliated mimcd3 cells transduced with control or Mst1/2 shrna were immunostained for T183-phosphorylated (active) Mst1 [p-mst1 (T183)], acetylated α-tubulin and counterstained with DAPI. Below are enlarged images of indicated cells. (c) Protein extracts of proliferating or ciliated mimcd3 cells were fractionated by SDS-PAGE and immunoblotted with the indicated antibodies. Scale bar, 10 μm. We performed all experiments three times independently and obtained similar results. 2
 Representative images of ciliated mimcd3 cells transduced with the indicated shrnas. Scale bar, 10 μm.")
3 Supplementary Figure 3. Depletion of Mst1/2 and Sav1 impairs ciliogenesis in the mimcd3 cells. (a) Mst1/2 or Sav1 were stably knocked down in the mimcd3 cells by lentiviral infection. Gene knockdown was confirmed by western blotting. (b) Representative images of ciliated mimcd3 cells transduced with the indicated shrnas. Scale bar, 10 μm. (c, d) Frequencies of ciliated cells and lengths of cilia were quantified in the indicated samples. Error bars indicate SEMs of three independent experiments (*p < 0.05, **p < 0.01, ***p < 0.001; Student s t-test). At least 200 cells from 4-5 random fields per slide were counted. 3
4 Supplementary Figure 4. Co-depletion of MST1/2 and SAV1 in RPE cells. (a) Knockdown of indicated genes in RPE cells was confirmed by western blotting. (b) Frequencies of ciliated cells were quantified in the indicated samples from (a). Error bars indicate SEMs of three independent experiments (*p < 0.05; Student s t-test). At least 200 cells from 4-5 random fields per slide were counted. 4
 mimcd3 cells stably expressing shrna against Mst1/2 were reconstituted with empty vector, Flag- MST1 WT, or Flag-MST1 D326/349N (DN).")
5 Supplementary Figure 5. Full-length MST1 functions during ciliogenesis. (a) mimcd3 cells stably expressing shrna against Mst1/2 were reconstituted with empty vector, Flag- MST1 WT, or Flag-MST1 D326/349N (DN). Cell extracts were immunoblotted with the indicated antibodies. (b) Frequencies of ciliated cells were quantified in the indicated samples from (a). Error bars indicate SEMs of three independent experiments (*p < 0.05; Student s t- test). At least 200 cells from 4-5 random fields per slide were counted. 5
 RPE cells were transfected with the indicated sirnas. After 24 hours, cells were plated at low (3.4 10 3 cells/cm 2 ) or high (10 5 cells/cm 2 ) density and maintained for 1 day.")
6 Supplementary Figure 6. Normal contact inhibition in MST1/2- and SAV1-depleted cells. (a) Proliferating or serum-starved MST1/2- or SAV1-depleted RPE cells were stained for Ki67. (b) RPE cells were transfected with the indicated sirnas. After 24 hours, cells were plated at low ( cells/cm 2 ) or high (10 5 cells/cm 2 ) density and maintained for 1 day. mimcd3 cells expressing the indicated shrnas were similarly seeded at low or high density and maintained for 1 day. Cells were pulsed with 10 μm BrdU for 1 hour followed by immunostaining for BrdU and quantification. (c) Cells from (b) were analysed for the indicated proteins by western blotting. We performed experiments in (c) three times independently and obtained similar results. Error bars indicate SEMs of two independent experiments. For Ki67 and BrdU quantifications, at least 200 cells from 4-5 random fields per slide were counted. 6
 and sav1 open reading frame (ORF).")
7 Supplementary Figure 7. Specificity of sav1 morpholinos. (a) Schematic of sav1 genomic structure showing translation-blocking (TB) morpholino target sites. Position of antisense morpholino designed to block sav1 translation on the sequence of the 5 -untranslated region (UTR) and sav1 open reading frame (ORF). (b) Left: Injection of 65 pg of sav1-egfp mrna at the 1-cell stage results in embryos expressing sav1-egfp at the 75% epiboly (EP) stage. Right: Co-injection of sav1-egfp mrna with 6 ng of sav1 morpholino (sav1-atg- MO) abolishes EGFP fluorescence. Scale bar, 0.2 mm. 7

8 Supplementary Figure 8. Pronephric duct cilia are defective in sav1 morphants. Cilia in the pronephric ducts were visualized with anti-acetylated α-tubulin antibody at 26 hpf. Immunofluorescence showing the pronephric duct cilia in control embryo (n=10) (a) and sav1 morphants (n=16) (b). Scale bar, 10 μm. 8

9 Supplementary Figure 9. Increased MST1 expression delays G1/S entry in response to serum re-stimulation. Control RPE or HA-MST1-expressing RPE cells were serum-starved for 48 hours followed by re-addition of 10% FBS. Cells were harvested or fixed at the indicated time points. (a) Cell-cycle progression was analysed by western blotting for the indicated markers. (b) Alternatively, S-phase entry was measured by determining the frequencies of EdU-positive cells. At least 500 cells from 5-6 random fields per slide were counted. We performed all experiments two times independently and obtained similar results. Error bars indicate SEMs. 9

10 Supplementary Figure 10. MST1 binds to and phosphorylates AURKA in vitro. (a) 293T cells were transfected with the indicated combinations of Flag-AURKA and Myc-MST1. Two days after transfection, cell lysates were immunoprecipitated with antibodies against Myc or Flag. (b) His-AURKA and GST-MST1 recombinant proteins were subjected to in vitro binding assays using nickel beads. We performed all experiments three times independently and obtained similar results. (c) Recombinant GST-AURKA N-terminal fragment (AA 1-130) and GST-AURKA C-terminal fragment (AA ) were purified from E.coli. 1μg GST- AURKA proteins were incubated with 10ng recombinant GST-MST1 and γ- 32 P-labelled ATP for 30 minutes. Reaction products were analysed by autoradiography and western blotting. (d) Indicated AURKA mutants on AURKA N-terminal template were generated and purified as GST recombinant proteins. MST1 kinase assay was performed and analysed in the same way as in (c). S.E., short exposure. L.E., long exposure. 10
 Frequencies of ciliated cells were quantified in the indicated samples from (a). Two biological replicates were performed.")
11 Supplementary Figure 11. TAO1/3 is required for ciliogenesis in RPE cells. (a) Knockdown of TAO1 in RPE cells was confirmed by western blotting. For TAO3, depletion of TAO3 transcript was determined by RT-PCR. (b) Frequencies of ciliated cells were quantified in the indicated samples from (a). Two biological replicates were performed. Error bars indicate SEMs. At least 200 cells from 4-5 random fields per slide were counted. 11

12 Supplementary Figure 12. Effect of NPHP1/4 depletion on SAV1-NPHP complex formation in 293T cells. (a) Validation of NPHP1/4 sirna. 293T cells were first transfected with control or NPHP1/4 sirna. One day after sirna transfection, cells were transfected with an HA-NPHP1 or Flag-NPHP4 construct and incubated for 2 days. Knockdown of HA-NPHP1 or Flag-NPHP4 was confirmed by western blotting. (b) 293T cells were transfected with control or NPHP1 sirna. One day after sirna transfection, cells were transfected with indicated combinations of DNA and Flag-NPHP4 was immunoprecipitated. (c) 293T cells were transfected with control or NPHP4 sirna. One day after sirna transfection, cells were transfected with indicated combinations of DNA and Flag-NPHP1 was immunoprecipitated. We performed all experiments three times independently and obtained similar results. 12
13 Supplementary Figure 13. MST1/2-SAV1 and NPHP1 function in the same pathway. (a) RPE cells transduced with GFP-Rab8a were transfected with the indicated combinations of sirnas. Co-localization of Rab8a and acetylated α-tubulin was quantified. (b) Similar to (a) using RPE cells transduced with GFP-RPGR. Error bars indicate SEMs of three independent experiments (*p < 0.05, **p < 0.01; Student s t-test). At least 200 cells from 4-5 random fields per slide were counted. 13

14 Supplementary Figure 14. Centrosome migration after serum starvation in MST1/2- and SAV1-depleted cells. (a) RPE cells were transfected with control or sirnas against MST1/2 or SAV1. One day after transfection, cells were serum-starved for 12hr or 24hr. We equalized the time point when cells were processed for staining. Live cells were first labeled with Alexa 594-WGA and then fixed with methanol. Immunostaining for γ-tubulin and DAPI were performed following regular protocol. Using confocal microscope, we obtained 0.2μm interval sectioned images from the cell bottom to disappearance of WGA signal (apical membrane). From x-z plane images, we calculated the relative position of centrosome from bottom of DAPI in each cells. At least 50 cells were quantified from 4-5 random fields. As a result, all experimental groups showed clear upward migration of centrosomes as ciliogenesis proceeded. We performed two independent experiments and obtained similar results. The presented data are from one representative experiment. (b) Representative images of indicated cells at each time points. Scale bar, 10 μm. 14

15 Supplementary Figure 15. Normal localization of CP110 in MST1/2- and SAV1-depleted cells. RPE cells were transfected with control or sirnas against MST1/2 or SAV1. 36 hours after transfection, cells were serum-starved for 8hr or 16hr. Cells were immunostained for CP110, γ-tubulin and counterstained with DAPI. At least 50 cells per slide were quantified from 4-5 images from random fields. (a) Representative images of indicated cells at each time points. Scale bar, 10 μm. (b) Quantification of cells with CP110 localized at both centrioles. 15
16 16

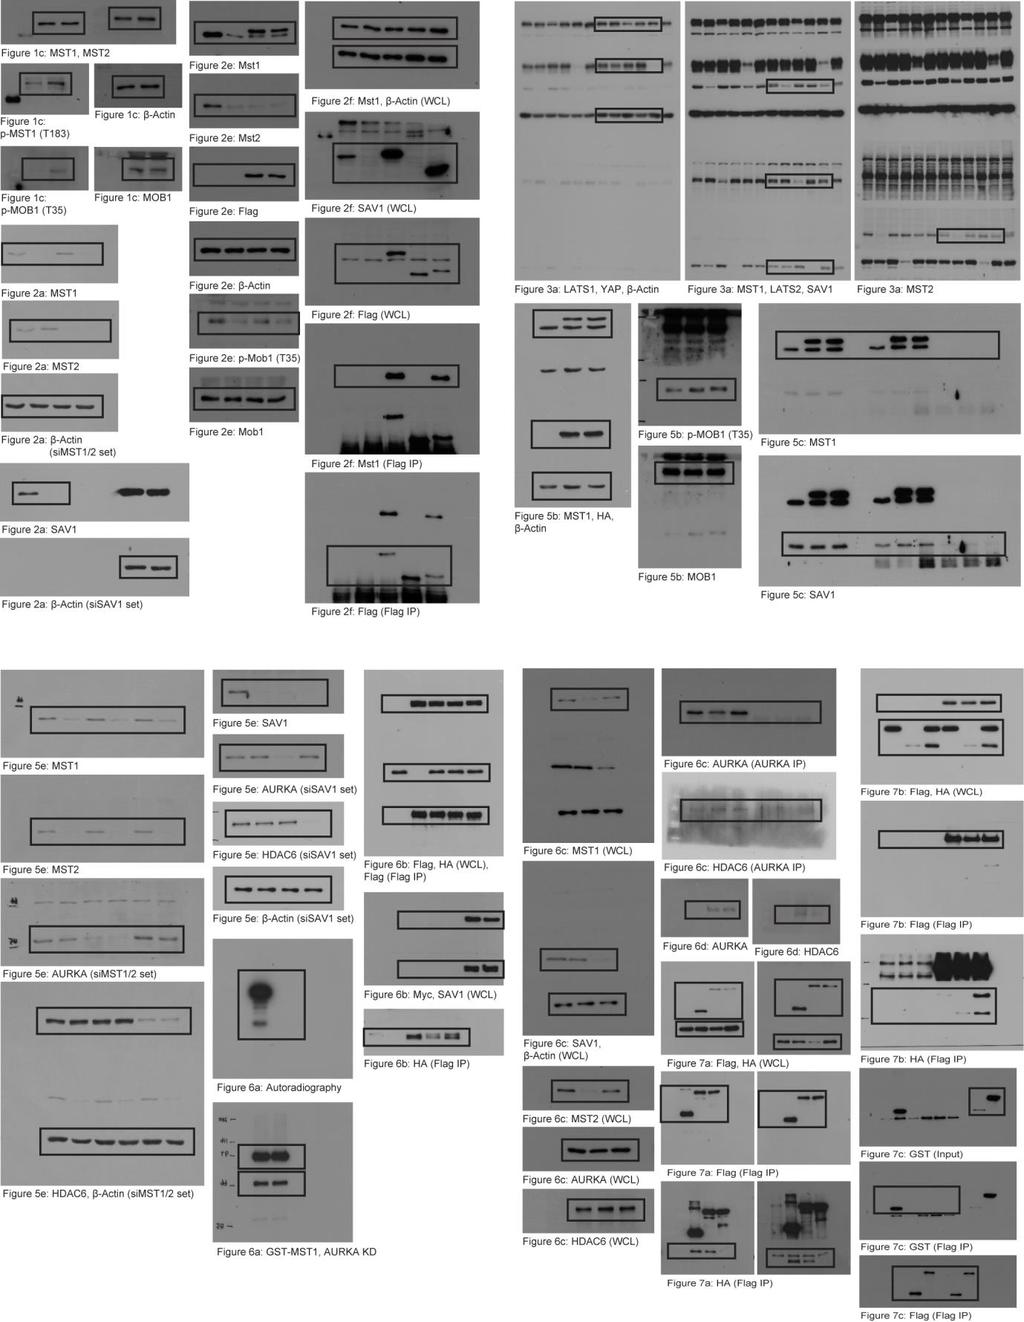
17 Supplementary Figure 16. Full blots and gels. 17
18 sirna Target gene GL2 MST1 MST2 SAV1 LATS1 LATS2 YAP TAO1 TAO3 #1 TAO3 #2 AURKA HDAC6 NPHP1 NPHP4 Target sequence CGT ACG CGG AAT ACT TCG A GGG CAC TGT CCG AGT AGC AGC CGG TCA AGT TGT CGC AAT T GCA CAT GAA GAC TAC AGA TAT GTC TGC TTC ATA CAT TCC TAA AAA GGC GTA TGG CGA GTA G GAC ATC TTC TGG TCA GAG A CTA AGA GTT TGA AGT CTA A CCG TCT CTT CTA TTC ACA GTA GAA AGG CAA GAG CGA GAG ATT ATG CCC TGT CTT ACT GTC A GGA TGG ATC TGA ACC TTG AGA CCT CTG TCT ATT TGA TGG TAA CAG CCG CTT TGT CCA TCT CAA shrna Target gene Target sequence Control (GFP) CAA CAA GAT GAA GAG CAC CAA Mst1 Mst2 Sav1 #1 Sav1 #2 CCG TCT TTC CTT GAA TAC TTT CCC ATG ATG GAA CGA GAA ATA CGG CTA CAT CTC TAG GGA ATT CGA GTA GAG TCA TCA GAA TTT Supplementary Table 1. sirna and shrna sequences. 18