PeCan Data Portal. rnal/v48/n1/full/ng.3466.html
|
|
|
- Chloe Butler
- 5 years ago
- Views:
Transcription

1 PeCan Data Portal rnal/v48/n1/full/ng.3466.html
 If cohort is selected, will show mutation origin Bar above top genes shows where studies supplying sample")
2 Home Page Pie chart of samples representing cancer types in Data Portal cohorts Top genes for diagnosis groups in word cloud If no cohort selected, will show color-coded distribution and mutation origin (not stratified by subtype) If cohort is selected, will show mutation origin Bar above top genes shows where studies supplying sample data

3 Cohort Cohort selected may show color-coding by pathway in word cloud For more details, look at Cohort Summary

4 Default screen in Cohort summary will show heat map Menu on left panel Can hover over Gene Name on Y-Axis to add or delete gene row or sort selection differently
 https://docs.google.")
5 Add your own data SNV and indel a3bfiqdklycyzrjrtpu4_9i3gephty-z38/edit SV (tabular format; JSON format to come) Fusion transcript (tabular format, JSON format to come) same as SV above CNV, gene-level EsKZGYnbBNc9aQIrhzdEJaU/edit ITD r973ijyzc/edit Intragenic deletion LGyGodyg/edit Truncation (N or C terminus loss) Y8r30pSKfan1BhYZcsUtSk7wRb4plaO1S-JCJr4/edit
6 Cohort Variant Summary


7 Cohort Gene and Individual Summaries
8 ProteinPaint
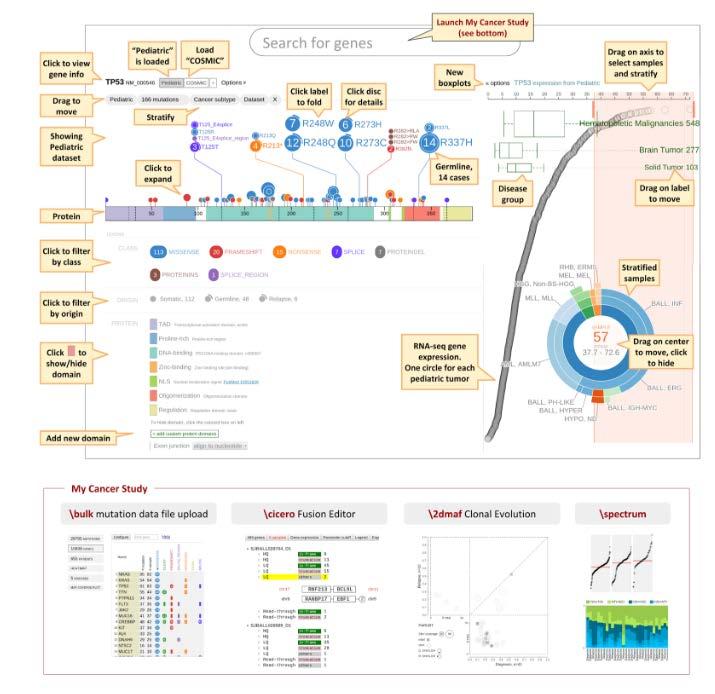
9 ProteinPaint Each lollipop represents an observed mutation. 17 Germline, non-pathogenic variants are hidden by default. To display, click on text and select Show Choice of transcript defaults to canonical, but can switch isoforms by clicking on isoform name. NOTE: PeCan shows genes in hg19 genome build Multiple Data Sets Available Pediatric, COSMIC, ClinVar Zoom Add Custom tracks or adjust view of current tracks SVG export or Popup Window of EP300 Protein/Gene View RNAseq data
, or an aggregation of all isoforms")
10 Choice of Transcript and Gene View Click on transcript name to make this box pop up. Can switch display to genomic, splicing RNA, exon only, protein (default), or an aggregation of all isoforms Can also switch viewed isoform

11 Data Sets Can also add your own data by selecting the + sign Formatting is described within each selection To add text file, see examples, format on this page or Slide 5 Filter selection by class of mutation
12 Sort by Mutation Class Selected Fusion transcript and Show Alone Selected Fusion transcript marker in box. Deselect protein domains to be represented in image above by clicking on colored rectangle next to PROTEIN NOTE: Shaded side of fusion marker is side of gene involved in the fusion gene protein.
 Can stratify by Sample sample ID")
13 Additional labels are underneath the Pediatric and COSMIC labels if those data types are selected. Mutations Cancer Types Datasets Tissue types Mutations Drop Down Stratifying Data Sunburst Mutations Click on ## mutations to see stratificaton window (left bottom) Can stratify by Sample sample ID Specimen diagnostic? Dataset_label what dataset is the mutation from? PMID Committee Classification Origin Type LOH In-frame UseNterm +-Strand Will replicate selected information from dataset and visualize below the gene Other options for visualization Sunburst (left) Table Download Information can be copy/pasted into Excel Contains all information on mutations in gene separated by mutation type
14 Stratifying Data Additional labels are underneath the Pediatric and COSMIC labels if those data types are selected. Mutations Cancer Types Datasets Tissue types Click on Cancer Types label to show breakdown of variants by subtype % Tumors within each subtype with a mutation in this gene Distribution of mutation classes by subtype Important for inferring driver/passenger events Missense/silent mutations suggest passenger mutations Will replicate data from selected cancer subtype to visualize below gene
15 Stratifying Data Stratify by Dataset: mirrors datasets highlighted on homepage. PCGP Pediatric Cancer Genome Project (St. Jude/Wash U) TARGET Therapeutically Applicable Research to Generate Effective Treatments (NIH) DKFZ German Cancer Research Center Shanghai Children s Medical Center Pediatric ALL Project UT SW Medical Center Wilms Tumor Study Selecting a dataset will replicate mutations associated with that dataset and visualize below the gene.
16 Fusion Visualization Fusion transcript is annotated and visualized by selecting fusion transcript marker of interest. PMID of primary publication in hyperlink in table when applicable along with sample information. Toggle chimeric view allows visualization of protein transcript in one bar.
17 Selection of SNV
 Make a selection on x-axis and drag to make pie chart appear. That data is stratified by disease type.")
18 RNA-Seq Data FPKM = fragments per kilobase of transcript per million mapped reads. Select Cohort to make green box plots for different cancer types. Can toggle between normal scale or log 2 for FPKM (x-axis) Make a selection on x-axis and drag to make pie chart appear. That data is stratified by disease type. When collapsed, you can recover RNA-Seq Data by clicking e next to the Pediatric button above the gene.
19 Hg18 Data or Mouse mm9 Data? To use genes found in hg18 or mm9 mouse genome (and other features hidden on PeCan site), use this link: Select genome from the drop down menu first, then type in gene name Also on this version of the website API: under Help Embed in your website Documentation on URL parameters, organizing data into a study. Several other features under Apps
20 PeCan PIE (Pathogenicity Information Exchange) As of 10/23/17 Beta version Cloud-based cancer annotation and presentation service. (DNA Nexus application) Will annotate and rank variants Display on one interactive web page for your review Can select ACMG criteria met and add custom interpretations of data. Requires VCF file as input

21 PeCan PIE Click on PIE button on home screen. You may need to set up a DNA Nexus account. DropBox function to upload VCF Can access any data processed under your account with Manage Previous Uploads Demo and tutorial docs including 2017 ASHG presentation Great tutorial docs! Use these and the ASHG presentation!
22 PeCan PIE Job Page Ranked in order of relevance based on somatic and germline medal classifications. Link to Variant page on right column
23 PeCan PIE Variant Page

24 PeCan PIE Variants Page * Also includes ClinVar, Allele frequency information, Medal ceremony determination fields, links to gene information on dbsnp and SOURCE if available.


25 PeCan PIE Prediction Algorithms and Final Classification
26 Other Pipeline Services (in Beta) Rapid RNA-Seq FASTQ/BAM input to find gene fusions and ITDs in dataset ChIP-Seq Peak Calling Paired ChIP-Seq FASTQ files WARDEN Differential Expression Multiple paired RNA-Seq FASTQs, sample list file Performs alignment, coverage analysis, gene counts, and differential expression. HLA Typing and Neoepitope Prediction Single-end/paired-end WGS FASTQ files or an aligned WGS BAM file Identifies HLA alleles and predicted epitope affinities of peptides.
27 Scenario #1 Your lab wants to make an NGS panel for pediatric brain tumors. What genes should you look into using for your panel? Gene Cloud Cohort Summary

28 Select BT from Home Page or type in Search bar and see Gene Cloud

29 Go Into Cohort Summary and Observe Heat Map If you would like to see more genes see next slide. If you would like to narrow NGS regions down to regions where mutations have been previously observed, look at ProteinPaint for each gene (choose appropriate data sets) and narrow regions from there.

30 Want to Investigate more genes for your panel? RNF213 = Last gene on heat map If you set desired cutoff at 8 mutations observed, you may want to look into these additional 8 genes.
31 Whole genes or critical regions to interrogate for NGS panel? Example gene: TTN all observed mutations in COSMIC and Pediatric data sets fall on exon 46. Is it worth covering the whole gene in your NGS panel?
32 Scenario #2 You want to design PCR primers overlapping DNA binding domains (Zinc Finger domains) in IKZF1 which exons should you target? ProteinPaint
33 IKZF1 Search for gene name IKZF1 in search bar in ProteinPaint or Home Page Manually curated ZnF domains in exons 4, 5, 6, and 8. Hover over Protein to see exons boundaries annotated by dashed vertical line.
34 Scenario #3 You would like to design a D-FISH strategy targeting RUNX1-RUNX1T1 gene fusions ProteinPaint
35 Use Search bar to search for RUNX1 Find most common RUNX1T1 Filter by fusion transcript Select fusion transcript marker representing 27 mutations Within Fusion view, toggle to chimeric view Repeat for fusion transcript marker representing 7 mutations Use transcript information to guide probe placement
36 Scenario #4 You are a laboratory consultant trying to interpret a pediatric neuroblastoma case with just one mutation identified, which your lab has not seen before. AHNAK2 E825D (missense) ProteinPaint
37 Potential clues: PMID connected with variant Manual curation interpretation RNA-Seq data
38 Online Tutorials Tutorial Document: /1JWKq3ScW62GISFGuJvAajXchcRenZ 3HAvpaxILeGaw0/edit Video: DSoIs-2ZfU
39 Contacts Xin Zhou: Jinghui Zhang: User community on Google+ to learn about latest development and provide feedback: unity