E VA L U AT I O N O F N E W T E C H N O L O GY F O R T H E Q U A L I T Y C O N T R O L L A B O R ATO R I E S JEFF SCHNEIDERHEINZE, PH.D.
|
|
|
- Thomas Eaton
- 5 years ago
- Views:
Transcription

1 E VA L U AT I O N O F N E W T E C H N O L O GY F O R T H E Q U A L I T Y C O N T R O L L A B O R ATO R I E S JEFF SCHNEIDERHEINZE, PH.D. 1
2 OUTLINE Background on Microchip CE (MCE) Extended Qualification and Robustness of MCE Troubleshooting Case Studies 2


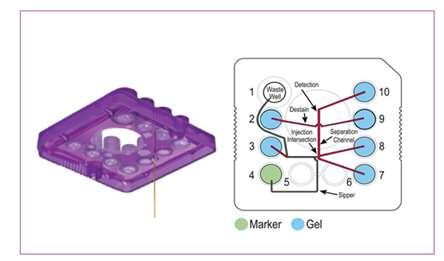
3 EVOLUTION OF ELECTROPHORESIS Technology Resolution Maximum Throughput PAGE Low ~ hours Run Time Schematic Instrument Example Result (Depends on gel size) CE High mins MCE High s per sample (16 mins for 24 samples) 3


4 MCE USING PERKINELMER LABCHIP INSTRUMENTS GXII GXII Touch Protein PICO Assay Reagent Kit WHT_LabChip_GXII_Touch_Antibody_Analysis.pdf 4
5 PRINCIPLE OF THE PICO MCE ASSAY Alkylating agent Dye LDS Heat A fluorescent dye is chemically attached to free amines contained in the protein of interest. The labeled sample is subsequently analyzed by MCE using fluorescence detection 5
6 COMPARISON OF CE-SDS RESULTS TO MCE USING PICO 6
7 ADVANTAGES OF MCE GXII/GXII TOUCH INSTRUMENTS High Throughput Bottleneck becomes data processing rather than sample analysis time Fewer instruments are needed to match the same throughput of CE Ease of use/interface No manipulation of capillaries, cutting capillaries, etc. Minimal method parameters Compatibility with high salt matrices without sample pretreatment 7

8 EXTENDED QUALIFICATION AND ROBUSTNESS
9 WORKFLOW OF PICO MCE ASSAY Samples Add Buffers Denature Add Dye Integration parameters Analyst integration Identity ph Ionic strength Concentration of alkylating agent Detergent (SDS vs. LDS) Humidity Temperature Temperature Volume Pooled vs. unpooled Cooling time Sitting time Sitting location Heated vs. unheated lid Cooling time Incubate to Attach Dye Electropherograms Run Assay Load Plate and Chip Add Stop Solution Image credit:
10 GXII AND GXII TOUCH COMPARABILITY STRATEGY Current Qualified Molecules (n=10 at the time of study, 15 to date) New Molecules Bridging study between with GXII and GXII Touch to allow analysis by either model Qualify using the GXII Touch instrument 10
11 RFU RFU COMPARABILITY BETWEEN INSTRUMENT MODELS Comparability study between the GXII and GXII Touch GXII model being superseded by the GXII Touch HT Examined 10 separate molecules Any differences were 0.8%, which is within the established assay variability (SD%) LC HC GXII Instrument Average( %) GXII GXII Touch LMW NGHC Purity n = 6 preps Minutes GXII Touch Minutes 11

12 RFU ALKYLATING AGENT AND PH Non-Reduced ph Minutes Total area increases with higher ph while the concentration of the alkylating agent is robust across a wide range 12


13 DETERMINATION OF OPTIMUM SAMPLE PREPARATION Non-Reduced Reduced DOE study previously performed and temperature confirmed for material from new cell line 13
14 Percent Percent STABILITY OF PLATED SAMPLES AT 5C Non Reduced Reduced MP+NGMP MP Purity LMW HMW LC+HC Purity LMW HMW NGHC MInutes NGMP Minutes Prepared samples are stable up to 4 hours at 5C 48 14


15 PRELIMINARY COMPARISON OF CE AND MCE Non-Reduced Reduced Non-Reduced Reduced Purity LMW NGMP Purity LMW NGHC MCE CE-SDS Difference

 84.4 CE (LMW) 7.")
16 COMPARISON OF STABILITY SAMPLES 3M AT 40C Non-Reduced Method %area CE (Purity) 83.7 MCE (Purity) 84.4 CE (LMW) 7.75 MCE (LMW)

 6.94 MCE (LMW) 5.")
17 COMPARISON OF STABILITY SAMPLES 3M AT 40C Reduced Method %area CE (Purity) 84.2 MCE (Purity) 85.3 CE (LMW) 6.94 MCE (LMW)
18 LINEARITY Consistency of Analysis Total Area Consistency of Analysis 18
19 LOQ/LOD DETERMINATION Product Level (ppm) Average Total Time Corrected Area SD RSD
20 MCE METHOD ACCURACY Non-reduced Nominal Concentration Recovered Concentration % Recovery (mg/ml) (mg/ml) Reduced Nominal Concentration Recovered Concentration % Recovery (mg/ml) (mg/ml)
21 MCE ASSAY PRECISION Non-Reduced Prep LMW NGMP MP HMW Average SD RSD Reduced Prep LMW NGHC HMW Purity Average SD RSD
22 MCE INTERMEDIATE PRECISION Non-reduced Analyst % LMW % NGMP % HMW ND Average SD RSD Reduced Analyst % LMW % NGHC % HMW % Purity Average SD RSD Two different analysts were utilized using separate instruments, reagent kits and microchips 22
23 PERFORMANCE AND TRENDING mean UCL LCL CE Purity MCE Purity CE LMW MCE LMW
24 PERFORMANCE AND TRENDING mean UCL LCL CE Purity MCE Purity CE LMW MCE LMW

25 TROUBLESHOOTING CASE STUDIES


26 TROUBLESHOOTING ATYPICAL PROFILE FRONTING ON LIGHT CHAIN Issue Analyst noted atypical fronting of the light chain peak Root Cause After thorough investigation, it was determined that the O-rings were soiled. The O-rings were replaced and subsequent eletropherograms were typical Remediation O-rings are now visually inspected and replaced more often 26
27 CELL LINE CHANGE FOR A MONOCLONAL ANTIBODY Comparison of Non-Reduce MCE Electropherograms Issue Analyst noted shoulder on the tail of the main peak in new cell line Root Cause After thorough investigation with supporting post-translational and mass spec analysis, dye was conjugating more in the hinge region of the cell line 2 more so than the cell line 1 material 27
28 CONCLUSIONS AND NEXT STEPS MCE analysis using GXII has demonstrated to provide quality data comparable to CE with comparable method qualification performance Robust operating ranges have been developed and qualified for use in QC testing Data trending between the assays is similar however the number of total invalid assays thus far by MCE is about half that of CE Instrument downtime is nearly non-existent for MCE with regular preventative maintenance and daily cleaning Careful cleaning and training of analysts is necessary to reduce abnormal profiles and maintain instrument performance 28
29 ACKNOWLEDGEMENTS IOPS QC and Analytical Sciences Timothy Riehlman Gabriel Carreau Nicole Nall Anu Rambhadran Matthew Allen (intern) Paul Bigwarfe IOPS management Daniel Van Plew Rong Wang 29