Galaxy Platform For NGS Data Analyses
|
|
|
- Aubrie Carr
- 5 years ago
- Views:
Transcription
1 Galaxy Platform For NGS Data Analyses Weihong Yan Collaboratory Web Site
2 Workshop Outline ü Day 1 UCLA galaxy and user account Galaxy web interface and management Tools for NGS analyses and their application Data formats Build/share workflow and history Q and A ü Day 2 Galaxy Tools for RNA-seq analysis Galaxy Tools for ChIP-seq analysis Galaxy Tools for annotation. Q and A *** Published datasets/results will be used in the tutorial
3 1. Import qc history from published histories Shared Data -> Published Histories -> qc -> Import history -> start using this history 2. Import qc-bowtie-picardsummary workflow and run the workflow Shared Data -> Published Workflows -> qc-bowtie-picardsummary -> Import workflow -> start using this workflow -> in the pulldown list of imported: qc-bowtie-picardsummary, select Run -> Choose s_1_1_600000_qseq.txt as input -> check Send results to a new history - > click Run workflow 3. Repeat (1) and (2), select demultiplex as history and workflow for import Run demultiplex workflow, s_2_2_1101_cut_qseq.txt as index file, s_2_1_1101_cut_qseq.txt as sequence file, barcode.txt as barcode file
![RNA-Seq Analyses ü Tophat: align reads to a reference genome ü Cufflinks: assembles transcripts and estimates their abundance FPKM = fragments per kilobase per million = [# of fragments]/[length of](/docs-images/87/95392917/images/4-0.jpg "transcript in kilo base]/[million mapped reads] ü Cuffdiff: identify significant changes in transcript expression, splicing, and promoter use.")
4 RNA-Seq Analyses ü Tophat: align reads to a reference genome ü Cufflinks: assembles transcripts and estimates their abundance FPKM = fragments per kilobase per million = [# of fragments]/[length of transcript in kilo base]/[million mapped reads] ü Cuffdiff: identify significant changes in transcript expression, splicing, and promoter use. Import RNA- seq pipeline history and workflow from workshop 5
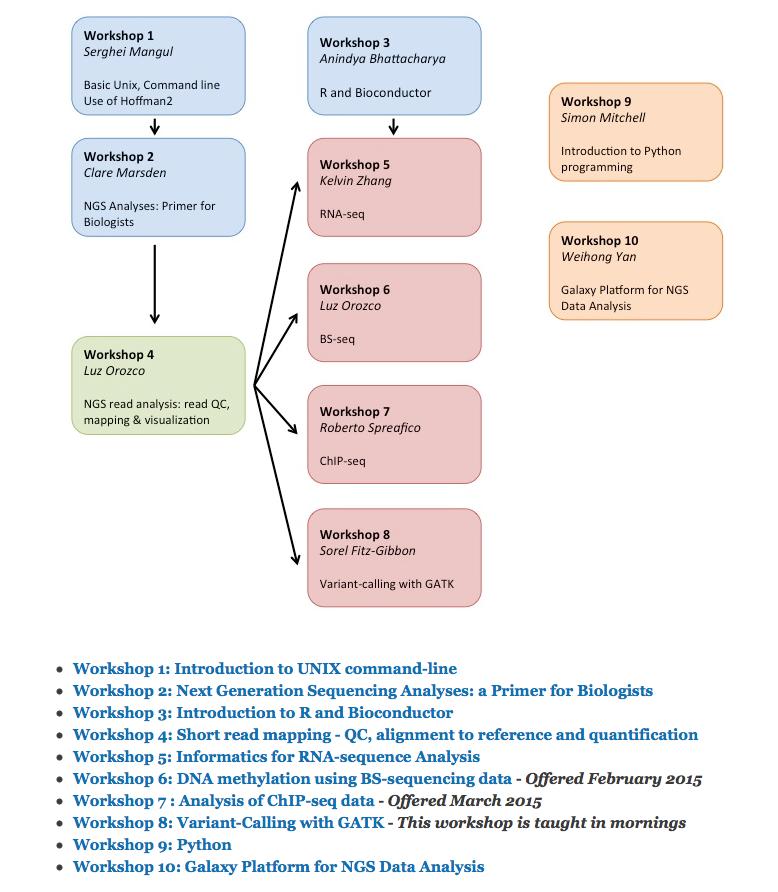
5 Collaboratory Workshops
6 ChIP-seq Data Analysis Applications ü Protein-DNA interaction sites ü Nucleosome position histone modification ü DNA methylation

7

8 Model-based Analysis of ChIP-seq (MACS) ü Removing redundant reads: MACS retains no more than one read per genomic location ü Building the peak model: Reads that map to the positive and negative strands often appear to the left and right of the protein-dna interaction location. ü Calculate peak enrichment using local background normalization
9 MACS Protocol to Call Peaks


10 MACS Protocol to Call Peaks
11 Peak Calling Workflow Bowtie: -m 1 -S sam format output MACS14: --wig saving wig file Import call peaks history and peak calling workflow from published histories and published workflows

12 MACS Output Files
13 MACS Output Files ü FoxA1_peaks_model.pdf Red: the percentage of reads from + strand at each pair. Blue: the percentage of reads from strand at each pair d: d is the distance between the summits of read and blue curves Black: the distribution of reads after shifting them by d/2 towards the 3 nds
14 MACS Output Files Col1: chromosome Col2: peak start position Col3: peak end position Col4: peak name Col5: -10*log10(pvalue)

15 MACS Output Files Fold_enrichment: Compared to the expectation from Poission distribution with local lambda False discovery rate will be reported if a control sample is used

16 Integrative Genomics Viewer


17 IGV Viewer Download peaks bed file and bam and bam_index files from history Open igv, load bed file, bam and bam_index files

18 CEAS

19 CEAS Overview


20 CEAS Modules
21 Galaxy CEAS Package ü CEAS: Enrichment on chromosome and annotation Annotate the given intervals and scores with genome features such as gene body ü SitePro: Aggregation plot tool for signal profiling Draw the score profile near a given interval ü GCA: Gene centered annotation Find the nearest interval in the given intervals set for every annotated coding gene ü peak2gene: Peak Center Annotation Input a peak file, and It will search each peak on UCSC GeneTable to get the refgenes near the peak center. (for ce4, ce6, dm2, dm3, hg18, hg19, mm8, mm9, and saccer3)
22 CEAS Input Files ü Gene annotation table file (sqlite3) Available gene annotation tables in galaxy: Worm: ce4 and ce6 Fly: dm2 and dm3 Mouse: mm8 and mm9 Human: hg18 and hg19 ü BED file with ChIP regions (TXT) a bed file contains chromsome, start and end locations of ChIP regions (chr ) ü WIG file with ChiP enrichment signal (TXT)

23 Import CEAS history and ceas workflow

24 CEAS Output Files P-value: significance of the relative enrichment of ChIP regions compared to the genome background
25 Relative enrichments of ChIP regions in promoters, downstreams of genes, and gene bodies (intron, exon, 5 UTR, 3 UTR) Bidirectional promoters are promoter regions between divergently transcribed genes whose TSS are closer than defined distances
26 Top: average ChIP enrichment signals near transcription starting site (left) and transcription termination site (right) Bottom: average ChIP signals on the meta-gene of 3kb. H3K36me3 enriches gene bodies and increases towards the 3 end.
 and then draws the average signal in any arbitrary regions (e.")
27 SitePro Output SitePro measures average signal (defined in the wig file) for the regions defined in the input file (bed file) and then draws the average signal in any arbitrary regions (e.g transcription binding sites)
28 peak2gene: peak annotation Nearest genes near the peak

29 Gene centered annotation (GCA)
30 Other Tools in CEAS Package ü Conservation Plot use UCSC PhastCons conservation scores to produce a figure showing the average conservation score profiles around the peak centers. Useful as an indicator of data quality ü Heatmap extract the signals centered at every given genomic location, perform k-means clustering and draw a heatmap
31 Downstream Analysis Tools ü Motif Tools MEME and FIMO

32 Downstream Analysis Tools ü Motif tools sequence logo

33 Downstream Analysis Tools ü Kmeans cluster and Heatmap

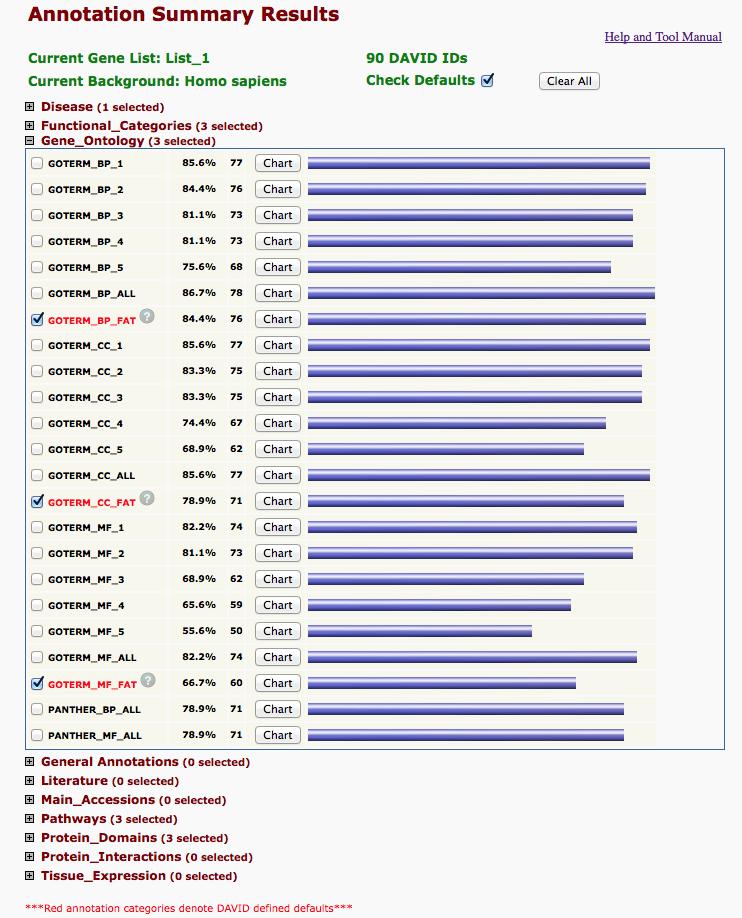
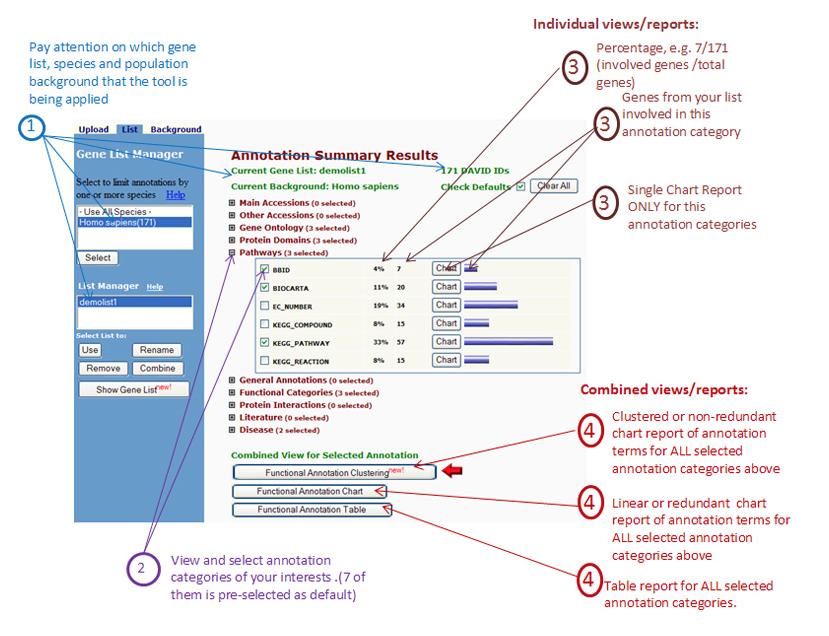
34 Downstream Analysis Tools ü Gene Ontology Analysis Database for Annotation, Visualization, and Integrated Discovery (DAVID)
35 Downstream Analysis Tools


36 Downstream Analysis Tools