0.9 5 H M L E R -C tr l in T w is t1 C M
|
|
|
- Juliet Gilmore
- 5 years ago
- Views:
Transcription
 1.1 0 1.0 5 1.0 0 0.")

.")
, n 3.")
 trfp + HMLER-Twist1 cells, (6, 7) GFP + HMLER-Ctrl cells from (6) 1:1 and (7) 10:1")
 Representative 18hr invasion assays of HMLER-Snail1/Twist1 and HMLER-Ctrl cells in indicated CM.")
1 a. b. c. d. e. f. g. h. 2.5 C elltiter-g lo A ssay M T S a s s a y Lum inescence (A.U.) n s H M L E R -C tr l in C tr l C M H M L E R -C tr l in S n a il1 C M A bsorbance (@ 490nm ) n s H M L E R -C tr l in C tr l C M H M L E R -C tr l in T w is t1 C M 0.0 d a y 0 d a y d a y 0 d a y 1 Supplementary Figure 1. Snail1 and Twist1 non-cell autonomously increase invasion of HMLER-Ctrl cells without altering EMT markers (a) Representative image of HMLER-Ctrl cells co-cultured with HMLER-Snail1/Twist1 cells at 1:1 and 10:1 ratio (day 11 of 14). (b) Representative Western blot analyses of whole cell lysates (WCLs) from GFP + or trfp + sorted from co-culture experiments at day 14. (HDAC1 loading control), n 3. Lanes: (1) GFP + HMLER-Ctrl cells, (2) trfp + HMLER-Snail1 cells, (3, 4) GFP + HMLER-Ctrl cells from (3) 1:1 and (4) 10:1 co-culture with HMLER-Snail1 cells, (5) trfp + HMLER-Twist1 cells, (6, 7) GFP + HMLER-Ctrl cells from (6) 1:1 and (7) 10:1 co-culture with HMLER-Twist1 cells. (c,e) Representative 18hr invasion assays of HMLER-Snail1/Twist1 and HMLER-Ctrl cells in indicated CM. (d,f) Quantitation of invasion assays in panel c and e. (g,h) Representative proliferation assay by MTS (g) and CellTiter-Glo (h) for HMLER-Ctrl cells in indicated CM. Scale bar-100µm; S.E.M shown, One way ANOVA with Tukey post test in d,f; n 6; RM Two-way ANOVA in g,h; ns- not significant, **p value<0.001, ***p value<0.0001

 qrt-pcr analyses of HMLER-Ctrl, Snail1 and Twist1")

.")


 qrt-pcr analyses of 3 clones each of MCF7-Ctrl and")


2 a. b. c. d. e. f. g. h. i. j. Supplementary Figure 2. Six1 is upregulated downstream of Snail1 and Twist1 in HMLER cells and only Six1 is overexpressed in MCF7 cells (a) qrt-pcr analyses of HMLER-Ctrl, Snail1 and Twist1 cells show that Six1 is upregulated downstream of Snail1 and Twist1 and is knocked down in cells transfected with 150nM of sisix1 compared to a non-targeting sirna pool (sint). (b,c) Representative 18hr invasion assay of HMLER-Ctrl cells in CM from HMLER-Snail1 or Twist1 cells +/- sisix1. (d,e) Quantitation of cell invasion in panel b and c respectively. (f) qrt-pcr analyses of Six1 levels in HMLER-Ctrl cells cultured in CM from HMLER-Ctrl or HMLER-Snail1/Twist1 +/- sisix1. (g-i) qrt-pcr analyses of 3 clones each of MCF7-Ctrl and MCF7-Six1 cells (combined data shown for each group). Gene expression normalized to 18s, GAPDH or PP1B. (j) 7hr migration assay of HMLER-Ctrl cells in CM from MCF7-Ctrl and Six1 cells (combined data shown for >3 experiments). S.E.M shown, One way ANOVA with Tukey post test on compiled experiments n 3 in a,d-f; two tailed unpaired t-test in g-j, n=3; ns- not significant, *p<0.05, **p<0.001, ***p<0.0001


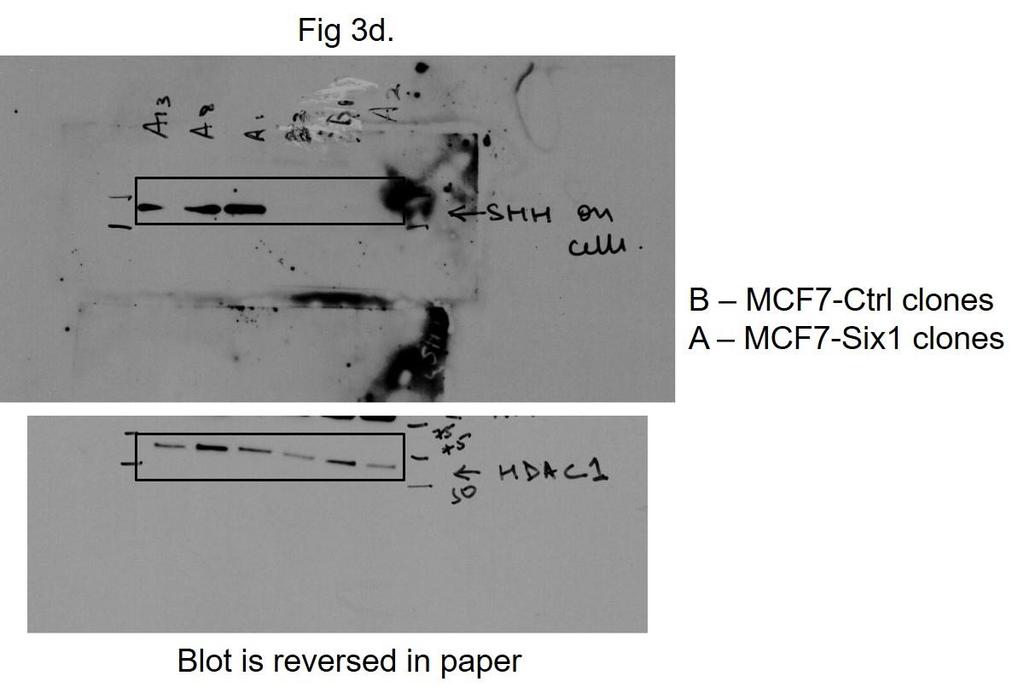
3 a. b. c. d. e. f. g. Supplementary Figure 3. Hh ligand levels are differentially regulated downstream of Snail1, Twist1 and Six1 (a,b) qrt-pcr analyses in HMLER-Ctrl, Snail1 and Twist1 cells transfected with 150nM of sint or sisix1. (c,d) qrt-pcr analyses in combination of 3 clones each of MCF7-Ctrl and MCF7-Six1 cells. (e) qrt-pcr analyses in A2780 cells transfected with 100nM of sint or sisix1. (f) qrt-pcr analyses in HMLER-Ctrl cells transfected with 1µg of Six1 and/or Eya2. EV-Empty vector. (g) Western blot analyses of whole cell lysates from HMLER and MCF7 cells showing endogenous levels of Eya2. Gene expression normalized to PP1B. S.E.M shown, compiled experiments n 3. One way ANOVA with Tukey post test in (a,b,f), two tailed unpaired t-test in (c-e). ns not significant; *p value<0.05, **p<0.001, ***p<0.0001
 mutant (m)-gli1-gfp reporter assay in HMLER cells cultured in CM from HMLER-Ctrl and (a)")
 m-gli1-gfp reporter assay in MCF7-Ctrl cells cultured in MCF7-Ctrl/Six1 CM. (e) 7-Gli1 and m-gli1-gfp reporter assays in MCF7-Ctrl cells with addition of 1µg/ml of rhshh to media.")
4 a. b. c. d. e. f. g. Supplementary Figure 4. Hh/Gli signaling is specifically activated in the presence of CM from cells expressing EMT-TFs (a,b) mutant (m)-gli1-gfp reporter assay in HMLER cells cultured in CM from HMLER-Ctrl and (a) HMLER-Snail1+/- sisix1 cells or (b) HMLER-Twist1+/-siSix1 cells. (c) qrt-pcr analyses of Hh pathway target genes in HMLER-Ctrl cells in different CM; gene expression normalized to PP1B. (d) m-gli1-gfp reporter assay in MCF7-Ctrl cells cultured in MCF7-Ctrl/Six1 CM. (e) 7-Gli1 and m-gli1-gfp reporter assays in MCF7-Ctrl cells with addition of 1µg/ml of rhshh to media. (f,g) m-gli1-gfp reporter assay in (f) HMLER cells in CM from HMLER-Ctrl, Snail1 or Twist1 cells, and in (g) MCF7- Ctrl cells in MCF7-Ctrl/Six1 CM treated with indicated drug/antibodies. All Gli1-GFP reporter assays are represented as %GFP + cells. S.E.M shown, compiled experiments n 2 (c),n=3 (with different sets of CM). One way ANOVA with Tukey post test in all cases. ns not significant; *p value<0.05, ***p value<0.0001

 16-18hr invasion assays of HMLER-Ctrl cells cultured in HMLER-Snail1/Twist1 CM treated with (a)")
 Representative ICC of E-cadherin (green) in MCF7-Ctrl cells cultured in CM from MCF7-Ctrl and Six1")
 Quantitation of % membranous E-cadherin in panel c, cell counted per condition 45-60.")
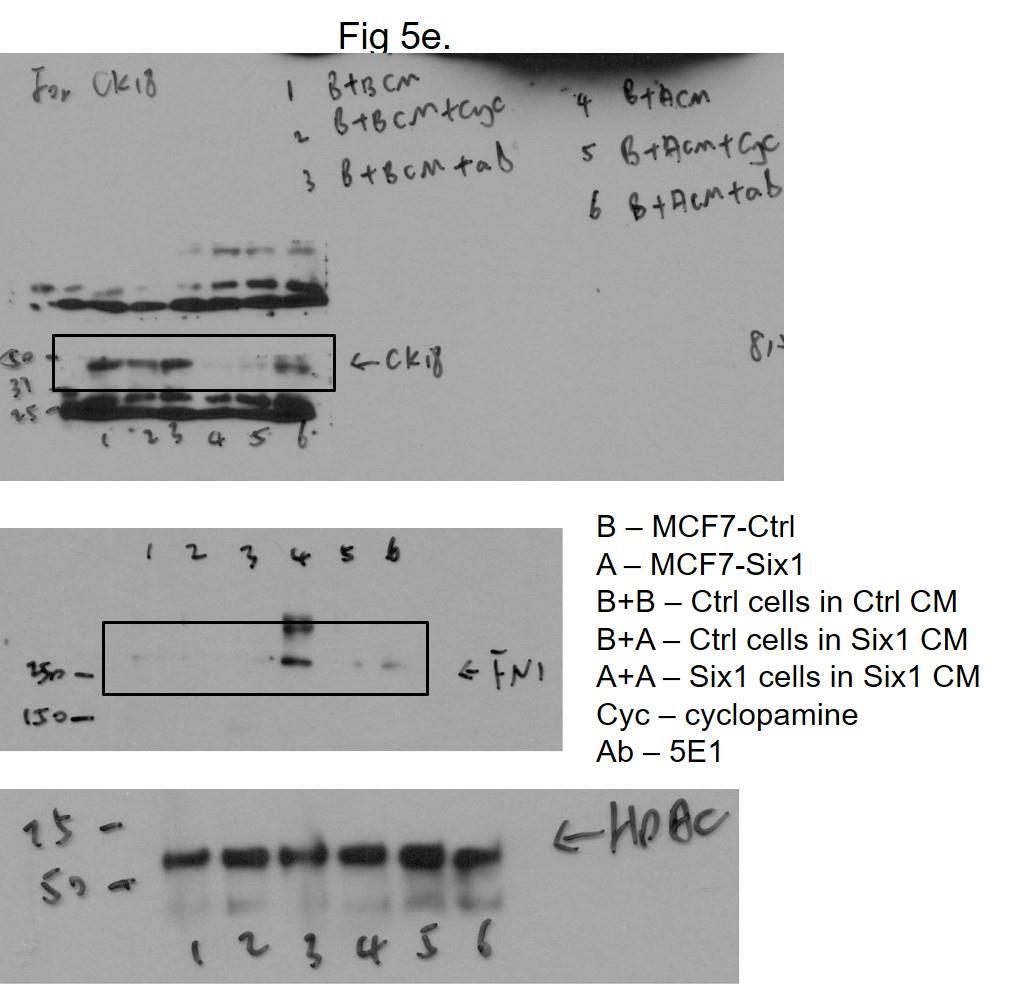
5 a. b. c. d. e. Supplementary Figure 5. Hh pathway inhibition via upstream vs downstream inhibitors differentially regulates non-cell autonomous phenotypes dependent on context. (a,b) 16-18hr invasion assays of HMLER-Ctrl cells cultured in HMLER-Snail1/Twist1 CM treated with (a) cyclopamine or (b) GANT61 or corresponding vehicle control. (c) Representative ICC of E-cadherin (green) in MCF7-Ctrl cells cultured in CM from MCF7-Ctrl and Six1 cells, treated with 5E1 and control NS-1 antibody for 48hrs (Dapi, blue), scale bar 20µm. (d) Quantitation of % membranous E-cadherin in panel c, cell counted per condition (e) Anoikis resistance assay in MCF7-Ctrl cells cultured in indicated CM +/- cyclopamine or 5E1 for 24hrs. S.E.M shown, n 3. One way ANOVA with Tukey post test in all cases. ns not significant; *p<0.05, **p<0.001, ***p<0.0001
 Representative fluorescent images of NOG/SCID mice at same time point (corresponding to similar tumor volumes) with MCF7-Six1-tRFP singly injected")
 Quantitation of red fluorescent signal (EMT cells) from primary tumor and distant sites (in lymph nodes/lungs - yellow boxed region in a representing")
 Quantitation of fluorescent signal (representing MCF7-Six1 EMT cells) from (c) distant sites and (e) primary tumor in tumors groups treated with")
 Normalized fluorescent signal (MCF7-Six1 cells) from (d) distant sites and (f) primary tumors of individual mice pre- and post-treatment.")
6 a. b. c. d. e. f. g. Supplementary Figure 6. Six1-expressing EMT cells benefit from inter-clonal cooperation with non-emt non-six1 expressing cells. (a) Representative fluorescent images of NOG/SCID mice at same time point (corresponding to similar tumor volumes) with MCF7-Six1-tRFP singly injected tumors and GANT61 or vehicle treated injection groups. (b) Quantitation of red fluorescent signal (EMT cells) from primary tumor and distant sites (in lymph nodes/lungs - yellow boxed region in a representing MCF7-Six1 cells) in MCF7-Six1-tRFP and tumor groups represented as c/s, counts per second. (c,e) Quantitation of fluorescent signal (representing MCF7-Six1 EMT cells) from (c) distant sites and (e) primary tumor in tumors groups treated with vehicle or GANT61, represented as fold change over pre-treatment signal. (d,f) Normalized fluorescent signal (MCF7-Six1 cells) from (d) distant sites and (f) primary tumors of individual mice pre- and post-treatment. (g) Overall tumor volumes of mice that received vehicle or GANT61 treatment over the course of the experiment, measured by calipers. S.E.M shown, two tailed unpaired t-test for a-f; Two-way ANOVA followed by Bonferroni post test for g; ns- not significant; *p value<0.05, **p value<0.001

7 Supplementary Figure 7. Uncropped blots for western blots analyses in the main figures

8 Supplementary Fig. 7 continued
9 Supplementary Fig. 7 continued

10 Supplementary Fig. 7 continued

11 Supplementary Fig. 7 continued

12 Supplementary Fig. 7 continued
13 Supplementary Table 1. Combination Prognosis Subtype/Grade p value Six1, Gli1 Luminal A ER+ LN negative tumors LN negative tumors PAM50-Luminal A LN negative ER+ LN negative tumors Luminal B RFS Grade Snai1, Gli1 Grade Luminal A PAM50-Luminal A RFS Grade RFS Twist1, Gli1 Basal Basal RFS LN negative High expression of only both EMT-TFs and GLI1 correlate with worsened prognosis across multiple breast subtypes and grades, while high expression of either the EMT-TF or GLI1 alone does not. Distant metastasis-free survival, RFS Relapse-free survival, with RFS data. Data obtained from GOBO or KM Plotter (in red).
14 Supplementary Table 2. Primer sequences for qrt-pcr analyses Primer Forward Primer (5'-3') Reverse Primer (5'-3') Six1 TGCGCCGAAAATTTCCA TTGAAGCAGTAGCTGGTCTCC Twist1 GGAGTCCGCAGTCTTACGAG TCTGGAGGACCTGGTAGAGG Snai1 GAAAGGCCTTCAACTGCAAA TGACATCTGAGTGGGTCTGG Gli1 GATGACCCCACCACCAATCA AGAAAAGAGTGGGCCCTCGG Ptch1 CTGGCTTCAGGGACTTCAGG CGGTTTGCACCAGGAGTTTG Ptch2 CCAGAGATCCTGAGTCCACC GGCTGGATGGATGTAGGCAC VEGF-A AAGAAAATCCCTGTGGGCCTT TTTCCTGGTGAGAGATCTGCA Bcl-2 GGAGGCTGGGATGCCTTTGT TTCACTTGTGGCCCAGATAGG BMP-4 ACCGAATGCTGATGGTCGTT CAGAAGTGTCGCCTCGAAGT FoxF1 TCTCGCTCAACGAGTGCTTC GTTCATCATGCTGTACATGGGC CyclinD1 CTGCTCCTGGTGAACAAGC TGTGGCACAGAGGGCAAC MTSS1 AAGAACGTGGCCGATTCTGT TGGACTTTCTGGACATGGTGG SHH GAAGAGGAGGCACCCCAAAA CCCTTCATACCTTCCGCTGG IHH CCGCGACCGCAATAAGTATG CGAGTGCTCGGACTTGACG DHH ACATCACTACGTCTGACCGC ACCGCCAGTGAGTTATCAGC GAPDH CATCACCATCTTCCAGGAGC ATGCCAGTGAGCTTCCCGTC PP1B GGAGATGGCACAGGAGGAAA CGTAGTGCTTCAGTTTGAAGT 18S GTAACCCGTTGAACCCCATT CCATCCAATCGGTAGTAGCG
15 Supplementary Table 3. Antibodies used for Western blot analyses and ICC Antibody Company Catalog Number Dilution Used SHH Cell signaling :1000 WB E-Cadherin BD Biosciences :2500 WB 1:300 ICC E-Cadherin Cell signaling 3195S 1:300 ICC Vimentin BD Biosciences :2500 WB Cytokeratin-18 Abcam ab :10,000 WB Fibronectin BD Biosciences :500 WB Eya2 Sigma-Aldrich HPA :1000 HDAC1 Santa Cruz sc :1000 WB β-tubulin Sigma-Aldrich T8328 1:5000 WB GAPDH Cell signaling 2118S 1:1000 WB AlexaFluor 488 α- rabbit IgG AlexaFluor 594 α- mouse IgG HRP-anti-mouse IgG HRP-anti-rabbit IgG Invitrogen A :300 ICC Invitrogen A :300 ICC Sigma-Aldrich A9044 1:10,000 WB Sigma-Aldrich A9169 1:10,000 WB WB Western blot analysis, ICC - Immunocytochemistry