Experimental Design. Sequencing. Data Quality Control. Read mapping. Differential Expression analysis
|
|
|
- Sylvia Hudson
- 5 years ago
- Views:
Transcription
1 -Seq Analysis
2 Quality Control checks Reproducibility Reliability
3
4 -seq vs Microarray Higher sensitivity and dynamic range Lower technical variation Available for all species Novel transcript identification Alternate splicing Allele specific expression Fusion genes Higher Informatics Cost

5 Reproducibility, Linearity and Sensitivity <2% of genome Mortazavi et al., Nature Methods 5, (2008)
6 isolation Total Poly(A) selection r depletion Clinical Samples (tissue biopsies) Bacterial samples Size selection Small nc
7
8 Gene A Gene B Gene C Sample # of reads Gene A Gene B Gene C Sample Reads per kb of exon Gene A Gene B Gene C Total Sample Sample Gene A Gene B Gene C Total Sample Reads per kb of exon Sample Reads per kb of exon per million mapped reads - RPKM
9
10 What are my goals? Transcript assembly Identify new/rare transcripts What are Characteristics of my system? Large and complex genome Introns and high degree of alternative splicing No reference genome or transcriptome.
11 Biological Comparison(s) Paired End vs Single end Read depth Read length Replicates
12 Simple - Pairwise comparison Two Groups Complex design Cancer Subtype A Control Cancer Subtype B treatment Consult a statistician - +drug - +drug
13 Read depth and read length Small genome with no alternate splicing (yeast) Annotated transcriptome 10million reads per sample, 50bp single-end reads Mammalian genomes (Large transcriptome, alternative splicing, gene duplication) 30million reads per sample, assembly (100X coverage of transcriptome) million reads per sample, 100bp paired end reads Nature of samples. What is the expected purity of your sample? Is there contamination or heterogeneity expected? If yes, then High coverage to detect variants at lower frequency due to impurity or because they come from minor (but possibly still interesting) subpopulations of your sample.
14 Replicates: Factors determining number of replicates: Variability in measurements (Technical noise and Biological variation) Statistical power Technical Replicates Not Needed : High reproducibility at sequencing step Error prone steps fragmentation, cdna synthesis, adapter ligation, PCR amplification, bar-coding, lane loading Spike Ins: Quality control and library-size normalisation Minimize batch effects Randomize samples at library preparation and sequencing runs Biological Replicates Not required for transcription assembly Essential for differential expression Complex designs: 3+ for cell lines 5+ for inbred lines 20+ for human samples

15 Scotty:
16
17 Illumina sequencing by synthesis SOLID Color-Space reads Low error rate 454 pyrosequencing Longer reads, low throughput Pacific-Bioscience (pacbio)/ Oxford Nanopore Longer read (Recovery of full length transcripts)
18 assembly


19 Sequence Data Format.FASTQ Sample1_R1. Sample1_R2. R1 R2 Machine ID Read pair # 1 QC Filter flag Y=bad N=good Sample ID/Barcode Read ID Sequence Quality Score Phred +33 Read pair # 2 assembly
20 Data Quality Assessment Evaluate raw read library quality Sequence quality GC content for biases Adapter Contamination K-mer over representation Duplicate reads PCR artifacts Software/Tools FASTQC (Command line) Illumina read files NGSQC Support reads from any platform Support quality based read trimming and filtering SAMSat (Command line) Also work with Bam alignment files
21 Data Quality Assessment


22 Data Quality Assessment Sequence quality : Quality scores over bases Good Phred 30 = 1error/1000bases Phred 20 =1 error/100 bases Bad Trimming required Software/Tools FastX-Toolkit Trimmomatic Sickle Cutadapt


23 Data Quality Assessment GC Distribution: Acceptable levels depend on Source of sample Good Bad

24 Data Quality Assessment

25 Data Quality Assessment
26 Data Quality Assessment Recommendations: Generate quality plots for all read libraries Trim and/or filter data if needed Always trim and filter for de novo transcriptome assembly Regenerate quality plots after trimming and filtering to determine effectiveness Acceptable duplication K-mer or GC content levels are experiment and organism specific but the values should be homogeneous for samples in the same experiment. Outliers with >30% disagreement should be discarded.
27
28 Read Mapping (1) With reference genome (with/without transcriptome). (2) With reference transcriptome. (3) free assembly.
29 -seq: Assembly vs Mapping based -seq Ref : or -seq reads De novo -seq contig 1 contig 2
30 Mapping with reference genome Gapped mapper With GFF Short reads TopHat STAR, HISAT2 Mapping to genome Cufflinks, htseq-count,subread Without GFF Transcript identification & counting Transcript discovery & counting Homology based Blast2GO Functional annotation
31 Mapping with reference Short reads Ungapped mapper Bowtie2 Mapping to RSEM Kallisto express Transcript identification & counting
32 Mapping without reference De Brujin graphs Ungapped mapper Short reads Trinity Oases Velvet Assembly into transcripts Map reads back GTF-based Counting Homology based Bowtie Htseq-count RSEM, express Blast2GO Functional annotation

33 Alignment tools


34 Alignment tools Conesa et al, Biology :13

35 Read Mapping `
36


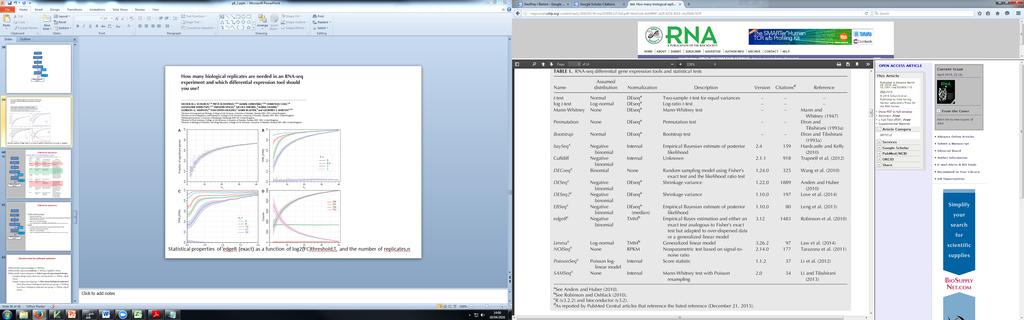
37 Statistical properties of edger (exact) as a function of log2(fc)threshold,t, and the number of replicates,n
38 Differential expression Common tools for differential expression

39 Decision tree for software selection
40 Sources: Conesa et al, Biology :13 Schurch et al, Zeng And Mortazavi Nat Immunol 13(9), Mortazavi et al Nature Methods volume5, pages (2008)