Supplementary Information
|
|
|
- Magdalen Doyle
- 5 years ago
- Views:
Transcription
1 Supplementary Information Figure S1. Transiently overexpressed ECFP-TIAF1/EYFP-TIAF1 causes apoptosis of Mv1Lu cells. Mv1Lu cells were transfected by electroporation with ECFP, EYFP, ECFP-TIAF1, EYFP- TIAF1, and/or EYFP-TIAF1(E22/23A). In controls, cells were undergone electroporation in serumfree medium. After culturing for 24 hr, cell cycle analysis was performed using flow cytometry. a, SubG1 phase; b, G0/G1 phase; c, S phase; d, G2/M phase. Each number indicates % cells in each phase of the cell cycle. The mutant TIAF1(E22/23A) and wild type TIAF1 failed to induce apotosis. 1

2 Figure S2. Transiently overexpressed ECFP-TIAF1/EYFP-TIAF1 induces apoptosis of non-small cell lung cancer (NSCLC) NCI-H1299 cells and TGF-β1 did not increase the extent of cell death. The cells were transfected with constructs for overexpressing ECFP-TIAF1 and/or EYFP-TIAF1 by electroporation. In controls, cells were transfected with ECFP, EYFP, or serum-free medium only. The cells were cultured overnight and then treated with human recombinant TGF-β1 (5 ng/ml) for 24 hr, followed by cell cycle analysis by flow cytometry. A representative set of data is shown from 2 experiments. 2

3 Figure S3. Transiently overexpressed ECFP-TIAF1/EYFP-TIAF1 induces apoptosis of human breast MCF7 cells. MCF7 cells were transfected with constructs for overexpressing ECFP, EYFP, ECFP-TIAF1, and/or EYFP-TIAF1 by electroporation. The cells were cultured overnight and then treated with recombinant human TGF-β1 or β2 (5 ng/ml) for 24 hr, followed by processing cell cycle analysis by flow cytometry. A representative data set is shown from 2 experiments. Control, no electroporation. Control (ep), cells electroporated with serum-free medium only. X-axis: DNA content; Y-axis: Cell numbers. a, SubG1 phase; b, G0/G1 phase; c, S phase; d, G2/M phase. Each number indicates % cells in each phase of the cell cycle. 3
4 Figure S4. Transiently overexpressed ECFP-TIAF1/EYFP-TIAF1 induces apoptosis of human neuroblastoma SK-N-SH cells. SK-N-SH cells were transfected with constructs for overexpressing ECFP, EYFP, ECFP-TIAF1, and/or EYFP-TIAF1 by electroporation. The cells were cultured overnight and then treated with recombinant human TGF-β1 (5 ng/ml) for 24 hr, followed by processing cell cycle analysis by flow cytometry. A representative data set is shown from 2 experiments. Control, no electroporation. Control (ep), cells electroporated with serum-free medium only. X-axis: DNA content; Y-axis: Cell numbers. a, SubG1 phase; b, G0/G1 phase; c, S phase; d, G2/M phase. Each number indicates % cells in each phase of the cell cycle. 4
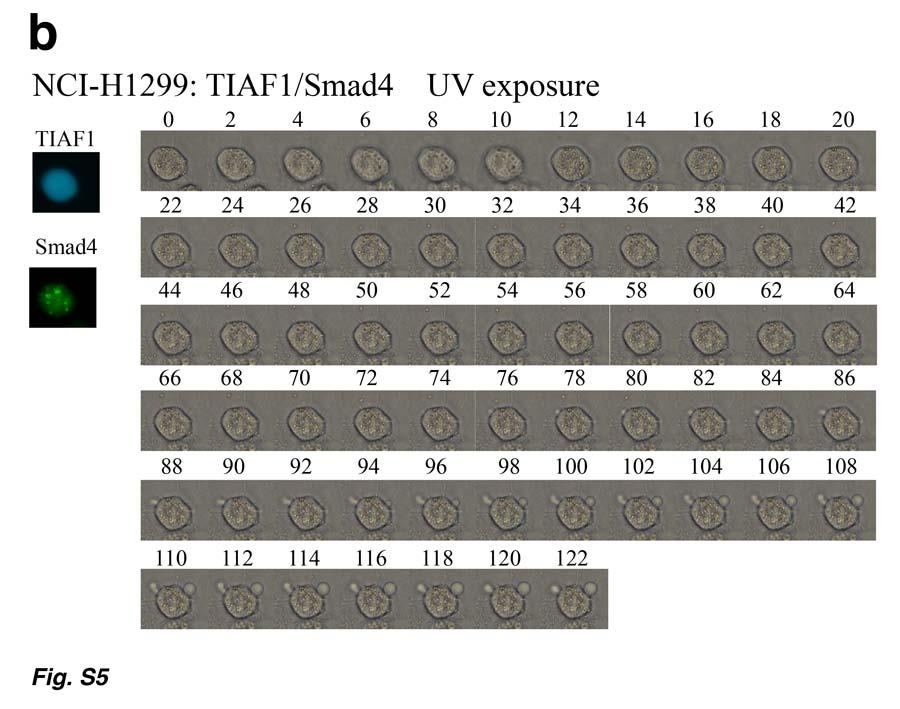
. (a) Cells were overexpressed with ECFP-TIAF1 and EYFP-TIAF1.")
5 Figure S5. Smad4 suppresses UV irradiation-induced apoptosis of NCI-H1299 overexpressing ECFP-TIAF1 and EYFP-TIAF1. Time-lapse microscopy of UV irradiationinduced apoptosis of NCI-H1299 cells was performed (one picture taken per min). (a) Cells were overexpressed with ECFP-TIAF1 and EYFP-TIAF1. Reduction in cell size by 50% occurred at 20 min and membrane blebbing at 40 min post UV exposure. A much slow kinetics of apoptosis was observed in control cells overexpressing ECFP and EYFP only ( min delay). (b) When cells were transfected with ECFP-TIAF1 and EYFP-Smad4. Smad4 suppressed the apoptosis response. Membrane blebbing occurred at 76 min without reduction in cell size. 5
6 6
 or incubated at room temperature for 1, 2, 4, 8 and 24 hr (b), and then run under reducing and non-reducing SDS-PAGE.")
7 Figure S6. Monoclonal Aβ antibody (MCA2172) specifically interacts with Aβ but not with APP. Synthetic Aβ peptide (aa 1-17) was dissolved in degassed MilliQ water at 3 mm. The samples were without incubation (a) or incubated at room temperature for 1, 2, 4, 8 and 24 hr (b), and then run under reducing and non-reducing SDS-PAGE. Western blotting was performed using indicated antibodies (shown in the graph). Wherever indicated, monoclonal antibody against Aβ (MCA2172) was used in this entire article or the entire experiments (unless otherwise specified). Monoclonal Aβ antibody (MCA2172) interacts with Aβ monomer (a) and polymers (a,b). Monoclonal antibodies against APP (MAB348), Aβ (6E10), and AICD (SIG-39152) and polyclonal A11 (AHB0052) did not cross-react with Aβ polymers (b). Gels were also stained with silver (BioRad) to demonstrate the Aβ peptide polymerization. Our data and many other reports show that Aβ (6E10) antibody interacts with APP. 7
, - β2 (5 ng/ml), and/or TNF-α (10 ng/ml) for 24 hr. The cells were harvested.")
8 Figure S7. TGF-β1 induces TIAF1 self-polymerization. L929 fibroblasts were treated with TGF-β1 (5 ng/ml), - β2 (5 ng/ml), and/or TNF-α (10 ng/ml) for 24 hr. The cells were harvested. Expression of APP, Aβ and TIAF1 in the whole cell lystates was examined by Western blotting using specific antibodies. 8
 for seeding with HCT116 cells. HCT116 cells were grown for 48 hr. Western blotting analyses were performed using specific antibodies.")
9 Figure S8. Extracellular matrix induces Aβ production. NCI-H1299 cells were pretreated with pifithrin µ (10 and 100 µm) for 30 min, followed by exposure to hyaluronidase PH20 (200 units/ml) for 2 hr. Cell matrices were prepared (see Methods) for seeding with HCT116 cells. HCT116 cells were grown for 48 hr. Western blotting analyses were performed using specific antibodies. TIAF1 appears to undergo polymerization, and pifithrin µ-activated matrix supported the polymerization (lanes 2 and 5 from left). Amyloid oligomer antibody A11 appeared to interact with TIAF1, whereas the AO antibody revealed the presence of amyloid fibrils. NCI-H1299-derived extracellular matrix specifically induced Aβ generation, which was not recognized by antibodies against APP and Aβ(6E10). PH20 abolished the Aβ generation. 9

10 Figure S9. TIAF1 expression in rat glial cells. At high cell density, TIAF1 is expressed as 17- and 20-kDa isoforms. High molecular size TIAF1 at 50- and 55-kDa is also observed. Coexposure of cells to lactacystin and nocodazole for 3 hr resulted in suppression of TIAF1 expression. Lactacystin appeared to block TIAF1 accumulation. Lactacystin is a proteasome inhibitor, and nocodazole is an inhibitor of microtubule polymerization. Generation of Aβ was not observed. 10
. Nuclei were stained with DAPI.")
11 Figure S10. TIAF1 in the AD hippocampus. Confocal microscopy of TIAF1 aggregates is shown in the human AD hippocampus. Each confocal section is 1 µm in thickness (section #1 from left; 400x magnification). Nuclei were stained with DAPI. D, merged images from A, B, and C; E, D merged with images from DIC (Differential Interference Contrast). Scale bar, 20 µm. Stacked picture from each section is shown in Figure 5d. Pictures were taken using a Zeiss confocal microscope. 11
 Confocal microscopy analysis shows the presence of small Aβ aggregates in a large size TIAF1 plaque in the hippocampus of a transgenic APP/PS1 mouse (age month 9).")
12 Figure S11. Low levels of Aβ in TIAF1 aggregates. (a) Confocal microscopy analysis shows the presence of small Aβ aggregates in a large size TIAF1 plaque in the hippocampus of a transgenic APP/PS1 mouse (age month 9). Each confocal section is 1 µm in thickness (section #2 starting from left). Top panel: 400x magnification. Bottom panel: merged pictures and 100x magnification. (b) A confocal section from mouse cortex is shown (100x; scale bar, 100 µm). 12
 A residual TIAF1 (or debris) is in shown on the background of an Aβ plague (100x).")
13 Figure S12. TIAF1 debris in large size Aβ plaques in the hippocampus of APP/PS1 transgenic mice. (a) A residual TIAF1 (or debris) is in shown on the background of an Aβ plague (100x). (b) The TIAF1 debris is in the epicenter of a mature Aβ plague (400x). 13
 TIAF1 protein aggregates were analyzed by non-reducing SDS-PAGE (5%) and Western blots using the lysates of hippocampal samples from postmortem AD patients and nondemented controls.")
14 Figure S13. TIAF1 aggregates in nondemented and demented human hippocampi. (a,b) TIAF1 protein aggregates were analyzed by non-reducing SDS-PAGE (5%) and Western blots using the lysates of hippocampal samples from postmortem AD patients and nondemented controls. The blots were stained with specific anti-tiaf1 antibody (pseudocolored in green; see panel a), stripped, and then probed with anti-ubiquitin antibody (pseudo colored in red; see panel b). Only representative data is shown. (c) A merged picture of panels a and b is shown. Majority of TIAF1 proteins were not ubiquitinated. C, control; A, Alzheimer s disease; AP, Alzheimer s and Parkinson disease; H, Huntington disease; M, multiple systems atrophy (MSA). 14
15 Video 1. TGF-β1 induces TIAF1 self-aggregation. Stimulation of neuroblastoma NCI-H1299 cells, overexpressing EYFP-TIAF1, with TGF-β1 (5 ng/ml) resulted in aggregation of TIAF1 in less than 60 min (see green punctates). Membrane blebbing occurred at 180 min. 15