Lincoln University Digital Thesis
|
|
|
- Bruce Underwood
- 5 years ago
- Views:
Transcription

1 Lincoln University Digital Thesis Copyright Statement The digital copy of this thesis is protected by the Copyright Act 1994 (New Zealand). This thesis may be consulted by you, provided you comply with the provisions of the Act and the following conditions of use: you will use the copy only for the purposes of research or private study you will recognise the author's right to be identified as the author of the thesis and due acknowledgement will be made to the author where appropriate you will obtain the author's permission before publishing any material from the thesis.
2 Biological control of sheath blight of rice with bacterial and fungal antagonists A thesis submitted in partial fulfilment of the requirements for the Degree of Master of Applied Science at Lincoln University New Zealand by Mana Kanjanamaneesathian Lincoln University 1994
3 i Abstract of a thesis submitted in partial fulfilment of the requirements for the Degree of M.Appl.Sc. Biological control of sheath blight of rice with bacterial and fungal antagonists by Mana Kanjanamaneesathian Potential bacterial and fungal antagonists were isolated from rhizosphere soils and soils taken from rice fields. These were screened in vitro for their ability to suppress Rhizoctonia solani on agar medium. One isolate of Pseudomonas fluorescens and one isolate of Bacillus subtilis were selected from one-hundred and twelve isolates of potential bacterial antagonists. One isolate of Trichoderma koningii was selected from sixty-seven isolates of potential fungal antagonists. They were selected for in vivo experiment on the basis of their ability to suppress mycelial growth and sclerotial production. The selected bacterial 'and fungal antagonists were tested in vivo in a greenhouse experiment for suppression of sheath blight disease development. Seed treatment, rice root dipping, and plant spraying were used for both single and combined antagonist applications. Better suppression of sheath blight disease development was obtained from seed treatment and plant spraying. The two bacterial antagonist applications gave better sheath blight suppression than the fungal antagonist. Application of individual antagonists was more effective than the combined
4 applications (the concentration of bacterial and fungal ii antagonists in the combination treatments was 50 % of the antagonists applied singly). Seed treatment and plant spraying were selected as two application methods for a field experiment. Antagonists applied ~y spraying plants one day before Rhizoctonia solani inoculation gave the best suppression of sheath blight disease development. Both Pseudomonas fluorescens and Bacillus subtilis established colonies on rice seeds, rice roots, and rice stems after application. Epidemiological data such as temperature and relative humidity should be used to predict the likelihood of Rhizoctonia solani infection so that the effectiveness of antagonist application can be enhanced. Keywords: Biological control; Sheath blight disease; Rice; Oryza saltiva; Rhizoctonia solani; Antagonists; Bacillus subtilis; Pseudomonas fluorescens; Trichoderma koningii.
5 iii Contents Chapter Abstract List of Tables List of Figures List of Appendices 1. Introduction Page i vi viii x 1 2. Review of Literature 2.1 Sheath blight disease and its casual agent 2.2 Symptom and disease development 2.3 Disease cycle 2.4 Epidemiology and yield loss 2.5 Biological control In vitro antagonism between potential antagonists and Rhizoctonia sol ani 3.1 Introduction Materials and meth6ds Isolation of potential bacterial and fungal antagonists Isolation of Rhizoctonia solani In vitro antagonism of potential bacterial and fungal antagonists to Rhizoctonia solani Pathogenicity test of Rhizoctonia solani isolates 28
6 3.2.5 Scanning electron microscope observation iv of Rhizoctonia solani sclerotia Induction of teleomorphs of Rhizoctonia solani and Rhizoctonia spp. isolates Data analysis Results Isolation of potential bacterial and fungal antagonists Isolation of Rhizoctonia solani In vitro antagonism of potential bacterial and fungal antagonists against Rhizoctonia sol ani In vitro compatibility'among bacterial and fungal antagonists Pathogenicity tests Scanning electron microscope (SEM) observation of Rhizoctonia solani sclerotia Induction of teleomorphs in Rhizoctonia spp Discussion In vivo test for suppression of sheath blight disease of rice 4.1 Introduction Materials and methods Experimental design Soil and field preparation Rice seedlings and rice plant preparation Antagonist inoculum and application
7 v Inoculum and inoculation of Rhizoctonia solani Detection of applied bacterial antagonists Scanning electron microscope (SEM) observations and quantitative study of applied bacterial antagonists Disease assessment Data analysis Results Suppression of sheath blight disease development Detection of antagonists on plant surfaces Scanning electron microscope observations Discussion General discussion 93 Acknowledgements 100 References 102 Appendix 112
8 vi List of Tables Table Page 2.1 Characteristics of Rhizoctonia solani Anastomosis groups (AGs) of isolates of Rhizoctonia solani which causes various plant diseases Potential bacterial and fungal antagonists isolated from rhizosphere soils and soils taken from Phatthalung Rice Research Centre Size of clear (inhibition) zone, number of sclerotia produced and time to maturity of sclerotia In in vitro antagonism tests with Rhizoctonia solani Overgrowth distance and number of sclerotia produced in in vitro antagonism test between Trichoderma spp. and Rhizoctonia sol ani Clear (inhibition) zone and number of sclerotia produced in in vitro antagonism test between Penicillium spp. group and Rhizoctonia sol ani 40
9 vii 3.5 Number of sclerotia produced in ~n vitro antagonism test between unidentified hyphomycetes and Rhizoctonia solani 41 ~.1 Effect of antagonist treatments on lesion height, relative lesion height (RLH), plant height, and tiller number at the seedling stage (25 days after sowing) In the greenhouse Effect of antagonist treatment on lesion height, relative lesion height (RLH), plant height, and tiller number at the tillering stage (60 days after sowing) In the greenhouse Effect of antagonist treatment on sheath blight lesion height in the field in which antagonists [Pseudomonas fluorescens (B 18) and Bacillus subtilis (B 1)] were applied as seed treatment, spray seven days, and spray one day before Rhizoctonia solani inoculation Number of Pseudomonas fluorescens and Bacillus subtilis colonies recovered from rice plant stem surface 87
10 viii List of Figures Figure Page 2.1 Disease cycle of sheath blight disease of rlce Antagonism tests between selected antagonists on agar media between Bacillus subtilis and Pseudomonas fluorescens; Bacillus subtilis and Trichoderma koningii; and Pseudomonas fluorescens and Trichoderma koningii Competitiveness tests between Bacillus subtilis and Trichoderma koningii; and Pseudomonas fluorescens and Trichoderma koningii Sheath blight disease symptom on rice RD-l variety plants artificially inoculated with rice tissue infested with Rhizoctonia solani Scanning electron micrographs of sclerotia of Rhizoctonia solani Basidiocarps and microscopic structures of unidentified teleomorphic stage of white type isolate of Rhizoctonia sp. 51
11 lx 4.1 Sheath blight lesion height at seedling stage (25 days after sowing) Sheath blight relative lesion height at seedling stage (25 days after sowing) Sheath blight relative lesion height at tillering stage (60 days after sowing) Sheath blight lesion height at tillering stage (60 days after sowing) Effect of treatments on sheath blight lesion height from field experiment Bacillus subtilis colonies recovered from un-germinated seeds, seven-day-old rice seedlings, plant parts when applied as seed treatment, and plant parts when appli'ed by root dipping Pseudomonas fluorescens colonies recovered from un-germinated seeds, seven-day-old rice seedlings, plant parts when applied as seed treatment, and plant parts when applied by root dipping Scanning electron micrographs of Bacillus subtilis on rice stem 89
12 x List of Appendices Appendix Page I. Recipes for culture media used for culturing microorganisms 112 II. Characteristics of rlce plant (variety RD-1*) 115 III. Analytical data of soil used In the greenhouse and field experiments 116 IV. Characteristics of selected antagonists; Bacillus subtilis, Pseudomonas fluorescens, Trichoderma koningii, and sheath blight pathogen, Rhizoctonia solani used in greenhouse and field experiments 117 V. Specimen preparation for scanning electron microscope (SEM) observation 121
13 1 Chapter 1 Introduction Rice sheath blight disease caused by Rhizoctonia soiani has been reported to occur ln every part of the world where rice is cultivated (Ou, 1985). It is one of the most destructive diseases constraining rice productivity, especially where rlce production is intensive, being second only to rice blast caused by pyricuiaria oryzae (Ou, 1985; Bonman et ai., 1992). There have been few recent reports of estimated losses due to sheath blight but in Japan yield reductions equivalent to 20 % may be incurred if the disease reaches the flag leaves (Teng et ai., 1990). Breeding for disease resistant to sheath blight is still in a rudimentary stage, and no variety has been selected against all anastomosis groups of Rhizoctonia soiani (Gangopadhyay and Padmanabhan, 1987). Thus no universally useful resistant variety is available to farmers, although attempts have been made to incorporate resistant genes into some rice cultivars (Bonman et ai., 1992). Control measures normally used are usually only partly effective because Rhizoctonia soiani is able to produce survival structures which can persist in the soil for at least 2 years (Ou, 1985). Several fungicides have been tested for many years for rlce disease control. Some potentially effective fungicides are highly phytotoxic on rice and if disease is not severe, these fungicides tend to cause more damage than good (Groth et ai., 1990). Changes in cultural practices, such as higher input of nitrogen fertilizer and higher density planting, resulted in an
14 2 increase of sheath blight (Woodburn, 1990). Biological control has become an attractive option for controlling rice sheath blight disease, and many other diseases (Cook, 1993). In Thailand, research is conducted at Phatthalung Rice ~esearch Centre to develop biological control for rice blast and bacterial leaf blight diseases (Charigkapakorn et al., 1992). However, biological control to control sheath blight has not been investigated in Thailand. Research on the application of biological control for sheath blight was carried out in the Philippines, India and Indonesia (Mew and Rosales, 1986; Vasantha Devi et al., 1989; Suparyono, 1991; Gnanamanickam et al., 1992). These studies usually involved screening for antagonists in vitro, followed by in vivo tests in the greenhouse and small scale field experiments. Results from small scale field testing of the efficacy of selected bacterial antagonists were promising (Vasantha Devi et al., 1989), but the effectiveness of selected antagonists should be evaluated in larger scale field experiments so that research may be applicable to farmers. To date, only bacterial antagonists have been tested (Mew and Rosales, 1986; Vasantha Devi et al., 1989; Gnanamanickam et al., 1992). In this study bacterial and fungal antagonists were tested individually and in combination. Seed treatment, rice root dipping, and spraying were used as application methods in the greenhouse experiment, while seed treatment and spraying were tested in the field. Laboratory and greenhouse experiments were carried out between July, March, 1993 with two objectives: 1. To detect suitable isolates of bacterial and fungal antagonists against Rhizoctonia solani on agar media.
15 3 2. To assess the efficacy of single and combined antagonists and the effectiveness of application methods in the glasshouse. The results from these experiments were used as a basis for ~he field experiment conducted between April, August, 1993 with the following objectives: 1. To compare the effectiveness of Pseudomonas fluorescens and Bacillus subtilis to control sheath blight disease. 2. To assess the efficacy of seed treatment and rice plant spraying to reduce sheath blight with antagonists. 3. To examine the importance of the timing of bacterial antagonist application.
16 4 Chapter 2 Review of Literature 2.1 Sheath blight disease and its causal agent Sheath blight of rice has assumed economic important ln the last two decades, since modern, semidwarf nitrogenresponsive cultivars were introduced. There are few reports on actual yield losses in farmers' fields. In Japan, a loss of 24-38,000 tonnes of rice annually was estimated by the National Institute of Agricultural Sciences in 1954 (Teng et al., 1990) The disease has become the most important rice disease in the southern rice-producing areas of the United States of America over the last 10 years. Yield losses up to 50 % occur ln susceptible cultivars when all the leaf sheaths and leaf blades are infected (Lee and Rush, 1983). In Thailand, data are not available concerning losses incurred from sheath blight disease nationwide. However, yield losses in farmer fields can be as high as 40 % (Arunyanart, Personal communication). with the introduction of semidwarf and high-yielding rice varieties in Thailand, it is possible that crop losses from sheath blight disease will increase. Sheath blight was first described ln Japan by Miyake in 1910 (Ou, 1985). Subsequently, similar disease was found in the Philippines, Sri Lanka, China, and many countries in Asia. It was for some time considered to be a disease of the Orient only, but later has been reported from Brazil, Surinam,
17 5 Venezuela, Madagascar, and the USA. The causal agent was first named as Sclerotium irregulare, but later was considered to be due to a fungus of the Rhizoctonia solani group (Ou, 1985) In North India, a banded blight disease of rice was reported, and copious air-borne basidiospores were found to cause banded symptoms and spots on the leaf sheath. This organism was identified as Thanatephorus cucumeris (Frank) Donk. (Ou, 1985) The anamorph of the casual agent of rice sheath blight disease is Rhizoctonia solani (Ou, 1985). The teleomorph of Rhizoctonia solani is considered to be Thanatephorus cucumeris (Frank) Donk. (Talbot, 1970). The current species concept (Parmeter and Whitney, 1970) stipulates that isolates of Rhizoctonia solani possess the characteristics as listed ln Table 2.1. Isolates ln a common anastomosis group (AG) are more genetically related than isolates in different AGs (Ogoshi, 1987). Rhizoctonia solani which causes sheath blight disease of rice has been assigned to anastomosis group-1 IA (AG-1 IA) (Jones and Belmar, 1989; Bu~pee and Martin, 1992). Apart from sheath blight of rice, Rhizoctonia solani AG-1 IA causes blight of soybean, and banded leaf and sheath blight of sorghum and corn, whereas Rhizoctonia solani AG-1 IB causes web blight of soybean (Jones and Belmar, 1989) (Table 2.2). Many weeds of the family Gramineae in rice fields were also naturally infected with the sheath blight pathogen (Anonymous, IRRI Annual Report for 1979, 1980). These weed species included Chloris sp., Digitaria sp., Echinochloa colona, Echinochloa crus-galli spp. hispidula, and Leptochloa chinensis. Weeds in the family Capparidaceae (Cleome rutidosperma), and the family
18 6 Table 2.1 Characteristics of Rhizoctonia solani 1. Pale to dark brown, rapidly growing mycelium of relatively large diametai with branching near the distal septum of the hyphal cells, often nearly at right angles in older hyphae 2. Constriction of the branch hyphae at the point of origin 3. Formation of a septum in the branch near the point of 4. Production of monilioid cells, often called barrel-shaped cells or chlamydospores, in chains or aggregate 5. Production of sclerotia of nearly uniform texture and varying in size and shape from small, round sclerotia, often less than 1 mm in diameter, to thin crusts several centimetres across 6. Pathogenicity to a wide range of hosts, resulting In a variety of symptoms incl';lding damping-off, rotting of roots and other underground plant parts, and blighting of stems and leaves 7. Possession of a basidiomycetous perfect stage variously referred to as Thanatephorus spp. 8. Possession of a prominent septal pore apparatus, and 9. Possession of multinucleate cells in actively growing hyphae (Source: Parmeter and Whitney, 1970)
19 Table 2.2 Anastomosis groups (AGs) of isolates of Rhizoctonia solani which causes various plant diseases R. solani isolates AGs Host 1 AG-l IA Rice sheath, Texas 2 AG-l IA Rice sheath, Texas 3 AG-l IB Bean leaves, Costa Rica 4 AG-l IB Bean leaves, North Carolina 5 AG-l IC Pine seedling, Canada 6 AG-l IC Radish root, Florida 7 AG-2-1 Peanut root, Georgia 8 AG-2-2 Corn root, Georgia 9 AG-2-2 St. Augustinegrass, Texas 10 AG-3 Soil, Maryland 11 AG-4 Conifer seedling, California 12 AG-4 Cotton seedling, Texas 13 AG-4 Cotton seedling, California 14 AG-5 Soil, Japan 15 AG-6 Soil, Japan 16 AG-7 Soil, Japan 17 AG-8 Wheat root, Washington (Source: Adapted from Jones and Belmar, 1989)
20 8 Pontederiaceae (Monochoria vaginal is) also served as host for parasitic survival of Rhizoctonia solani (Anonymous, IRRI Annual Report for 1979, 1980). The physiology of Rhizoctonia solani was extensively reviewed by Sherwood (1970). Ou (1985) reviewed physiological aspects of Rhizoctonia solani which causes sheath blight disease of rice more recently. The optimum temperature for mycelial growth was 30DC (maximum 40-42DC) with little or no growth occurring at 10 D C. The minimum, optimum and maxlmum ph for growth was 2.5, , and 7.8 respectively. Several carbon sources, especially inositol and sorbitol, supported the highest mycelial growth rate, while arginine,urea, threonine, glycine, and ammonium sulphate as nitrogen sources were best for mycelial growth. Sclerotia were formed most abundantly in the light and formation was also accelerated by a sudden fall in temperature. A temperature range of D C, with optimum at D C, was suitable for sclerotial germination and a high relative humidity (95-96 %) was essential. The size and number of sclerotia formed on agar plates were affected by the carbon and nitrogen sources present in the medium, particularly the latter, irrespective of the isolates tested. Sclerotia were formed in a medium containing proline many (average 37 per petri dish) very large sclerotia (3.5 x 3.1 mm) and few (3-8) large (2.5 x 2.2 mm) sclerotia were produced on urea, isoleucine, threonine, arginine, leucine, and valine media. Abundant ( ) moderately sized sclerotia were found on sodium nitrate, serine, glutamine, alanine, and aspartic acid
21 9 media. Tryptophan, histidine, and sclerotia on media containing lysine were formed very few small or none at all. No sclerotia were formed on media containing ammonium sulphate or peptone as nitrogen sources. 2.2 Symptom and disease development Sheath blight of rice causes spots mostly on the leaf sheath, but spots may occur on leaf blades if conditions are favourable (Reissig et al., 1986). Even though sheath blight lesions can be found on rice seedlings under favourable conditions, initial symptoms are usually lesions on sheaths of the lower leaves when plants are in the late tillering or early internode elongation stage of growth. These lesions appear cm below the leaf collar as circular, oblong, or ellipsoid, green grey, water-soaked spots about 1 cm long~ They enlarge to approximately 1 cm wide and 2-3 cm long. As the lesion develops, the centre becomes bleached with an irregular purplebrown border. Subsequently, infection may spread rapidly by external runner hyphae to upper plant parts, including leaf blades, and to adjacent plants. Lesions on the upper portion of the plant may coalesce to encircle the leaf sheath and stem. With opening of the plant canopy through leaf death, increased sunlight penetration and decreased humidity may occur and lesions may become dry, and white, tan, or grey with brown borders (Lee and Rush, 1983). High levels of nitrogen fertilizer and growlng of high yielding improved varieties are conducive for disease
22 10 development. Maximum disease development also occurs under the favourable microclimatic conditions of low sunlight, humidity near 95 % and high temperature (28-32 C). (Ou, 1985; Reissig et al., 1986). These microclimatic conditions occur when rice plants reach maximum tillering stage. While temperature within the rice crop v~ries with the ambient temperature, humidity among the rice plants is greatly affected by the thickness of the rice stand, so that close planting and heavy applications of fertilizers, leading to thick growth, increase disease incidence. Disease development is also affected by the susceptibility of the rice plant. It was shown that plants become more susceptible as they grow older (Lee and Rush, 1983). The stems of rice plants as they approach the heading stage become more compact and more subject to contact infection. In addition, ln older rice plant the encirclement of the leaf sheath around the stem becomes looser; which facilitates penetration of the mycelium to the inner surface of the sheath (Du, 1985). The runner hyphae may thus spread upwards and lesions may appear on the upper portion of rice plants (Lee and Rush, 1983). Before the heading stage, the upper leaf sheaths and blades are more resistant than the lower ones, but after the heading stage the susceptibility of the upper parts increases with the increasing plant age (Ou, 1985) Disease development is most rapid in the early heading and grain-filling growth stages. plants heavily infected at these stages produce poorly filled grains, particularly in the lower portion of the panicle. Additional losses may result from increased lodging or reduced tillering due to death of the culm
23 11 (Lee and Rush, 1983). 2.3 Disease cycle The sheath blight disease cycle was simplified by Reissig et al. (1986) (Flgure 2.1). The fungus, Rhizoctonia solani, survives in the soil in the form of a sclerotium. The sclerotium floats to the water surface during land preparation. This sclerotium may be carried away or finally come in contact with a rice plant. The sclerotium may then germinate and initiate infection (Ou, 1985). Mycelium in plant debris is also the means of pathogen survival between rice crops and 1S a form of primary inoculum for initiating infection (Lee and Rush, 1983). Infection takes place by cuticular penetration or through the stomatal slit. One or several infection pegs are formed from each lobe of the lobate appressorium or infection cushion for penetration. Infection pegs from lobate appressoria are much more common than those from infection cushions. Stomatal invasion seldom occurs on the outer surface of the sheath, but is quite common on the inner surface. The mycelium often grows externally from the outer sheath to the inner surface (Ou, 1985). Soon after the primary lesions are formed, mycelium grows rapidly on the surface of the plant and inside its tissue, proceeding upwards as well as laterally and initiating secondary lesions. Sclerotial formation develops on lesions. They later germinate and infect the plants (Ou, 1985; Reissig et al., 1986).
24 12 The disease spreads sideways and moves up the plants. Sclerotia develop on lesions and drop to the soil. The fungus grows on the plant. The fungus survives in sclerotia in the soil. The sclerotia float to the water surface during land preparation. The sclerotia germinate and the fungus penetrates the plant. Figure 2.1 Disease cycle of sheath blight disease of rice (Source: Reissig et al., 1986)
25 Epidemiology and yield loss Epidemics of rice sheath blight disease are influenced by the rice growth stage when infection occurs (Reissig et al., 1986), the amount of primary inoculum (Qu, 1985; Damicone et al., 1993), and cultural practices (Qu, 1985). Pre-planting density of sclerotia of Rhizoctonia solani was positively correlated to rice sheath blight incidence (Qu, 1985; Damicone et al., 1993). Factors other than sclerotia density may have contributed to rice sheath blight incidence, as other forms of inoculum may serve to initiate disease foci. Mycelium in rice plant debris may serve as primary inoculum (Lee and Rush, 1983). Differences between fields in cultural practices may also account for increasing sheath blight incidence and severity (Damicone et al., 1993)_ Nitrogen fertilization has a strong impact on sheath blight disease by creating a dense canopy and a favourable environmental condition for infection (Lee and Rush, 1983). While rice growth stage (Reissig et al., 1986; Jones et al., 1987), cultural practices such as nitrogen fertilizer application (Qu, 1985), and conducive environmental conditions may dictate the temporal aspect of sheath blight disease epidemiology, land preparation, water movement across field, preplanting inoculum density of Rhizoctonia solani, and crop rotation may govern the spatial pattern of sheath blight disease of rice (Belmar et al., 1987). In paddy rice production systems, water is applied across fields from the high end to
26 14 low end until the low end is saturated. Rice plant debris infested with Rhizoctonia solani and sclerotia are frequently observed to collect at the low ends of the fields, where incidence of sheath blight is often highest (Damicone et al., -1993). This causes a clumped distribution pattern of sheath blight disease of rice. Over time, sclerotia redistribution would occur, and this would increase the clumping of this disease (Damicone et al., 1993). The distribution of preplanting inoculum density may be the result of sclerotia production in disease foci of previous crops (Belmar et al., 1987). Differences In crop rotation patterns also have a significant effect on the pre-planting inoculum density of sclerotia of Rhizoctonia solani and subsequent sheath blight disease incidence. More sclerotia and disease were found In fields cropped to soybeans than in fields where rice was rotated with pasture (Belmar et al., 1987). Yield loss in rice due to sheath blight disease was dependent on the degree of resistant in rice varieties (Marchetii and Bollich, 1991), and nitrogen fertilizer application (Anonymous, IRRI Annual Report for 1975, 1976) Sheath blight disease developed more extensively in the semidwarf rice varieties than in the standard height cultivars. The semi-dwarf varieties appeared to be infected completely by the pathogen In a shorter time simply because of the shorter distance from infection courts near the waterline to the panicles (Marchetti, 1983). Yield reduction in semi-dwarf varieties was 31.3 % (in LB/BM rice cultivars) (Marchetti, 1983) and 21.9 % (in Bellemont rice cultivar), whereas percent
27 15 yield reduction in standard cultivars (Labelle and Lebonnet) was 1.3 % and 9.1 % respectively (Marchetti, 1983). A strong relationship between symptom severity and yield reduction was well established (Marchetti and Bollich, 1991). However, sheath blight disease symptoms and yield reduction may not be correlated in all cases. The cultivar II NewbonnetII sustained greater losses than disease symptoms indicated. Marchetti and Bollich (1991) explained this phenomenon in relation to the relative availability of non-structural carbohydrate for grain filling. With lesser amount of non-structural carbohydrate reserve during grain filling in II NewbonnetII cultivar, yield reduction would be greater even under the lower disease severity. 2.5 Biological control Management of sheath blight disease of rice has been directed toward the integra~ion of cultural practices with chemical control (Damicone et al., 1993). However, some cultural practices, such as crop rotation, may not be suitable for sheath blight disease control because of the wide host range and the survival of viable sclerotia (Lee and Rush, 1983). For chemical control, organic arsine compounds and organic tins are the most effective for inhibiting infection, lesion enlargement, and mycelial growth (Lee and Rush, 1983) However, they are highly toxic to rice and environmentally unacceptable in many countries and recommendation for their use is unlikely (Groth et al., 1990). Less effective antibiotic
28 16 preparations, such as polyoxin and validamycin, have also been used commercially in Japan (Ou, 1985). Benomyl is accepted as the first modern fungicide registered on rice which is effective against sheath blight disease (Groth et al., 1990). However, fungicide application may not be economically feasible and the timing of application appears to be important (Lee and Rush, 1983). The first fungicide application should be made shortly after symptoms are observed (usually early internode elongation) and a second, days later (before heading). The requirement for critical timing of fungicide application may hinder its usage. Biological control approach is thus being investigated (Mew and Rosales, 1986; Vasantha Devi et al., 1989; Gnanamanickam et al., 1992). Cook and Baker (1983) defined Biological control as "the reduction of the amount of inoculum or disease producing activity of the pathogen accomplished by or through one or more organisms other than man". This definition is broad enough to encompass clbssic approache? to biological control that influence pest populations as well as newly emerging biological control strategies. These new strategies include the use of plant growth-promoting rhizobacteria (PGPR), seed inoculants, induced resistance, biotic systems that exclude the pathogen from the host, and transgenic plants (Jacobsen and Backman, 1993). Biological control for plant pathogens and other pests can be defined either in a narrow or a broad sense. The most narrow definition would be to limit the concept to the use of introduced antagonists, a one-on-one effect much the same as that of most chemical controls, but using a microbial agent
29 17 instead of a chemical (Cook, 1984). In this thesis, biological control is used in the broader sense, as defined by Cook and Baker (1983). The benefit of using the broader definition of biological control is to accommodate newly emerging biological control strategies, and allow the possibility of the integration of two or more individual biological control strategies. Several factors are shifting disease management strategies toward increased dependence on biological and cultural controls and decreased pesticide use (Cook and Baker, 1983; Cook, 1993) For example, the public perceives that residues of synthetic chemical pesticides create food safety problems and that chemical pesticides are inherently deleterious to the environment. Resistance to chemical pesticides ls an additional and ever-increasing problem, as are ground and surface water quality concerns (Cook and Baker, 1983). Public concerns regarding resurgence of pest problems, development of pest resistance, and risks to farm workers and consumers, are increasingly restricting the uses of many pesticides (Norton and Way, 1990). High costs of discovering and registering a new chemical pesticide are also the cause of the reduction In the registered chemical pesticides and are contributory to the increased reliance on biological and cultural controls. Finally, more producers are beginning to use non-pesticide control approaches so they can cater for the demand and compete In the organic foods markets (Jacobsen and Backman, 1993). Biological control of plant pathogens has been divided into three categories, according to Cook and Baker (1983).
30 18 These are: (1) biological control of inoculum; (2) biological protection of plant surfaces; and (3) biological control of post-infection,i.e., by induced resistance or cross protection. The first approach may occur remote from the living host. This may include the destruction of propagules by antagonists, or by competitive displacement of a pathogen by saprophytes in infested crop residue. This approach, aimed at inoculum of the pathogen, may also occur on the plant, e.g., the use of secondary colonists in lesions to suppress the production of inoculum, or the use of hypovirulent agents to reduce the virulence or aggressiveness of the inoculum. The second approach, protection of plant surfaces with antagonistic microorganisms, uses the host as the site for the antagonistic interactions, and the third approach involves biological control inside the plant tissues (Cook, 1984). As might be expected, many of the more effective biological control systems developed in plant pathology use more than one approach. Biological control may also be used as one component of integrated pest management programmes. To a lesser extent, biological control may be combined with cultural and chemical controls to be used in crop protection strategies for modern agricultural systems. The degree of integration of biological, cultural, and chemical controls will depend on economics, crop type, farm size and location, government programme and their restrictions, the availability of reliable biological control products, the grower's perception of risk, and the requirements of the marketplace (Jacobsen and Backman, 1993). Flooding of soil, as practised for paddy rice production
31 19 In much of Asia, can be highly effective for protection of roots or maintaining the root health of crops grown after rice (Cook, 1984). But this practice may still not be effective for rice sheath blight and it may create a temporary biological vacuum which may then be quickly occupied by the rice sheath blight pathogen., Biological control of sheath blight disease of rice is thus being investigated (Mew and Rosales, 1986i Vasantha Devi et al., 1989i Gnanamanickam et al., 1992). Basically, two biological control approaches were pursued In sheath blight disease of rice. They were: (1) the protection of rice plant surfaces with antagonistic microorganisms, and (2) the destruction of propagules by antagonists, and by competitive displacement of a pathogen by saprophytes In infested crop residues. Rice seeds and rice plants were treated with selected antagonists for deterring sheath blight disease development (Mew and Rosales, 1986i Gnanamanickam et al., 1992). The degradation of sclerotia of Rhizoctonia solani by bacterial antagonists was a~so investigated (Vasantha Devi et al., 1989i Suparyono, 1991). Trichoderma harzianum was also investigated as a possible saprophyte to displace Rhizoctonia solani in infected rice straw in both dryland and wetland conditions (Mew and Rosales, 1985). Although a hypovirulent strain of Rhizoctonia solani was investigated for its possibility in controlling Rhizoctonia disease of potato plants (Bandy and Tavantzis, 1990), this approach has not yet been applied to sheath blight disease of rice. This unexplored area should be investigated so that biological control of sheath blight disease is attainable. These studies investigate the
32 20 application of fungal and bacterial antagonists (both individual and combined) to reduce sheath blight disease with seed treatment, root dipping, and spraying.
33 21 Chapter 3 In vitro antagonism between potential antagonists and Rhizoctonia sol ani 3.1 Introduction' In vitro screening of isolated potential antagonists against Rhizoctonia sol ani is considered an important aspect of identification of suitable isolates. In vitro tests are also useful as a primary screening procedure for identification of mechanisms such as antibiosis and hyperparasitism. Primary screening for the relative effectiveness of potential antagonists has been carried out on agar, in soil (Merriman and Russell, 1990) and in plant tissues (Gnanamanickam and Mew, 1990). Initial laboratory tests based on agar culture are often quick, simple, and inexpensive since a large number of potential,biological control agents can be tested. However, the validity of the agar test can be questioned, especially if it is used as the only prlmary screening procedure. The most obvious reason for this is that it will not select microorganisms which act by competition, avirulence and cross protection. An alternative to a programme solely dependent upon agar test is to carry out additional screening procedures in the soil or on detached plant tissue. Although more time consuming, such tests are likely to yield more relevant results than agar tests. This is especially true if some attempt is made to ensure that environmental conditions
34 22 simulate those anticipated under field conditions (Merriman and Russell, 1990). These simulated conditions will expose microorganisms to the environment in which they are ultimately expected to act as antagonists. The sources or sampling sites where potential antagonists should be isolated are of paramount important. Sites where serious outbreaks of disease occur are not usually good for potential antagonists, because if the potential antagonists are present, then the disease should not be serious. More suitable sites are where the disease should be expected to occur but it is absent, or less serious, than expected. Any host plants or patches of plants that are healthy in an otherwise diseased site are worthy of investigation. Random contamination of laboratory cultures, or isolates from culture collections, rarely produce useful antagonists as the microorganisms in laboratories are usually adapted to the high n~trient levels ln laboratory media (Campbell, 1989). Consideration of the sampling site and primary s9reening at the start of biological control research protocol is important, since a great deal of time and money is spent in the development of the potential antagonists. In this studies ~n vitro tests were carried out to detect potential antagonists. These potential antagonists were later used to test their effectiveness in vivo in the greenhouse and field experiments.
35 Materials and methods Isolation of potential bacterial and fungal antagonists Rhizosphere and soil samples were collected from rice fields at Phatthalung Rice Research Centre, Thailand. These were used as sources for isolation of bacterial and fungal antagonists respectively. Bacterial antagonists were isolated by the soil dilution plate method on King's B medium (Schaad, 1980) and Thornton's standardized medium (Johnson and Curl, 1972), for Pseudomonas spp. and Bacillus spp. respectively (Appendix I). Rhizosphere soil samples (1 g) were placed In 9 ml of sterilized water, and homogenized with an electric stirrer. Serial dilution of these soil samples were carried out, with a final dilution of 10-6 g/ml. The diluent (0.1 ml) from each serial dilution was dispensed by pipette on King's B medium and Thornton's standardized medium. Fungal antagonists were isolated by the soil plate method on peptone dextrose rose bengal agar (Johnson and Curl, 1972) (Appendix I). Ground, airdried soil samples (5 mg) were placed in sterilized petri dish, the agar medium (cooled to approximately 40 C) was poured into the petri dish and the dish was agitated carefully so that the soil particles were thoroughly dispersed. After 5-7 days incubation at room temperature (26-35 C), single colonies of bacteria and fungi were transferred to potato dextrose agar (PDA) slants (Appendix I), maintained at room temperature (26-35 C), and subsequently used for antagonism testing against
36 24 Rhizoctonia solani Isolation of Rhizoctonia sol ani Rhizoctonia solani was isolated from diseased rice plants, and other Rhizoctonia spp. were isolated from roots of diseased rice plants, and from soils adjacent to diseased rice plants. Three rice plants, infected with Rhizoctonia solani and with typical sheath blight symptom left in paddy fields from the previous harvesting season, were collected. Infected tissue was transferred aseptically by razor blade and, without surface sterilization, plated on PDA medium amended with streptomycin sulphate solution (16 mg/l). The infected rice tissue was incubated at room temperature (26-35 C) without light and the appearance of Rhizoctonia solani mycelium observed daily. Hyphal tips of Rhizoctonia solani were transferred to PDA slant cultures. These pure cultures were maintained in the incubator at 4 C for subsequent pathogenicity and antagonism tests. Rhizoctonia spp. were also isolated from roots of diseased rlce plants. Roots of diseased plants were washed in running water until all soil particles were removed. Roots were then cut aseptically from the rice plants, and small pieces (approximately 20 rom) long were placed on sterile filter paper until excess water was absorbed. Without surface sterilization, four small pieces of these root were then plated on PDA medium amended with streptomycin sulphate solution and incubated at room temperature (26-35 C). The appearance of Rhizoctonia spp. mycelium was observed daily and hyphal tips were transferred to
37 PDA slant. These pure cultures were maintained ln the incubator 25 Rhizoctonia spp. were isolated from soils planted with rice plants using a baiting technique (Sinclair, 1970). Rice seeds were boiled until the husk was broken. These boiled rice seeds were thenautoclaved at 121 C for 1 hour. Autoclaved rice seeds were buried in soils taken from rice fields (contained ln plastic bag), and incubated for 36 hours at room temperature (26-35 C). Soils were kept moist by regularly spraying with sterile water. Ten autoclaved rice seeds were used in each soil sample. After incubation, buried seeds were taken from the soil and surface sterilized with 4.5 % (v/v) sodium hypochlorite for 5 minutes, following by washing in sterile water until excess sodium hypochlorite was removed. The rice seeds were then plated on Modified Richard's agar (Johnson and Curl, 1972) (Appendix I), and incubated at room temperature (26-35 C) for 4 days. Colonies of Rhizoctonia spp. were detected daily. All isolate colonies of RhizoctQnia spp. were transferred as hyphal tip samples and these pure cultures were maintained in the same conditions as those described for Rhizoctonia solani In vitro antagonism of potential bacterial and fungal antagonists to Rhizoctonia sol ani Pure cultures of potential antagonists, and Rhizoctonia solani, were grown on PDA medium in 90 rnrn petri dishes for 3 days. For antagonism tests between potential fungal antagonists and Rhizoctonia solani, hyphal tips were then removed by cork
38 26 borer (5 mm diameter) and placed on petri dishes 50 mm apart on the dish diameter. Interaction between potential fungal antagonists and Rhizoctonia solani was observed daily and data were collected as the ability to reduce the number of sclerotia produced. The numbers of sclerotia produced per plate were assessed. The overlapping distance in which potential fungal antagonists covered Rhizoctonia solani colony was also measured. Dual culture was also carried out between potential bacterial antagonists and Rhizoctonia solani. Four inoculation points per plate were used for testing. An agar plug of Rhizoctonia solani was placed at the centre of the dishes with the potential bacterial antagonists inoculated haft way between the rim the dish and agar plug of Rhizoctonia solani. The width of clear (inhibition) zone created between potential bacterial antagonists and Rhizoctonia solani was measured. The numbers of sclerotia produced per plate were also assessed, and the maturation of sclerotia in the dual culture was observed. For each potential antagonist tested against Rhizoctonia solani, three replications were used for most fungal tests and four replications were used for bacterial antagonists. Antagonism tests were carried out at room temperature (26-35 C). Two bacterial antagonists, which were identified as strains of Pseudomonas fluorescens and Bacillus subtilis, and one fungal antagonist, Trichoderma koningii, were selected on the basis of their ability to inhibit growth and to reduce sclerotia produced, and these were used in further tests to determine their compatibility as combined antagonists. These
39 27 antagonists were cultured for 3 days on PDA medium before being used. For compatibility tests between selected bacterial antagonists, one loop of either Pseudomonas fluorescens or Bacillus subtilis was taken from 5 day bacterial cultures and streaked on 5 day cultures of the other. Three line patterns were used in this test, in which one isolate of bacterial antagonist were streaked, one line after the others, upon culture of another isolate which was spread on the surface of potato peptone agar (Appendix I) (Charigkapakorn et al., 1992) For antagonism tests between selected bacterial and fungal antagonists, an agar plug of the selected fungus was placed at the centre of the petri dish, while the bacterial antagonist was inoculated at four points half way between the agar plug and the rim of the petri dish by wire loop. These tests were carried out with equal aged inoculum of bacterial and fungal cultures. Each pairing had three replications, -with individual cultures of each antagonist used as a control treatment. Antagonism interactions were observed as clear inhibition zones created in dual culture between bacteria-bacteriaj and bacteria-fungus compatibility tests. Compatibility was tested between the selected bacterial and fungal antagonists by mixing cell suspensions of either Pseudomonas fluorescens or Bacillus subtilis with a spore suspension of Trichoderma koningii. Inoculum of the bacterial antagonists, Pseudomonas fluorescens and Bacillus subtilis, was prepared by growing on Pseudomonas Agar F (Difco) (Appendix I) (Schaad, 1980), and potato peptone agar respectively for 48 hours at 25 C (Charigkapakorn et al., 1992). Sterilized water
40 28 (25 ml) was added to 4 plates and these bacterial cultures were gently scraped from the agar surface with sterilized glass rod. These bacterial suspensions were adjusted to a concentration of about 1 x 10 6 colony-forming units (cfu)/ml. For the fungal antagonist, Trichoderma koningii was grown on PDA plates for 2 weeks at 25 C. Sterilized water (25 ml) was added to 4 plates and spores were scraped from the agar surface. This spore suspension was adjusted to a concentration of about 1 x 10 6 spores/ml. For combined antagonist tests, equal volumes (50:50) of bacterial suspensions were mixed with spore suspensions of Trichoderma koningii, using a concentration of about 1 x 10 6 for each antagonist. Single or mixed suspensions of paired antagonists were pipetted (0.1 ml) and spread on PDA medium with sterilized glass rod in three replicate plates, which were incubated at room temperature (26-35 C) for 3 days. These plates were observed daily for growth of bacterial and fungal antagonists in the mixture treatments. Growth of bacterial or fungal antagonists in the mixed treatments was compared with that of the single antagonist cultures Pathogenicity test of Rhizoctonia solani isolates Rice plants (RD-1 variety) (Appendix II) were grown In clay pots (380 mm diameter and 480 mm high) in the greenhouse for 50 days before inoculation with agar plugs of Rhizoctonia solani and Rhizoctonia spp. Approximately 10 kg of soil (Appendix III) used for growing rice plants were taken from a paddy rice field and put
41 29 into each clay pot. Water was dispensed into the clay pot until soil was submerged. The flooded soil preparation was allowed to stand for 2 days before it was manually agitated so that soil aggregates were loosened. The water level in the clay pot was adjusted to the same level daily. This was done to ensure an appropriate humidity which was necessary for infection. Three clay pots were used for each isolate of Rhizoctonia spp. Four rice plants were grown in each clay pot. One isolate of Rhizoctonia solani from infected rice plant, one isolate from roots of diseased rice plants, and three isolates of Rhizoctonia spp. from soils were tested for their pathogenicity with rice plants. The isolates were grown on PDA medium at room temperature (26-35 C) for 7 days. An agar plug of each isolate was removed with a sterile cork borer (5 mm diameter) and attached to rice plant stems, two plugs for each stem. One stem was used within each rice plant. There were four plants for each clay pot and three clay pots for each isolates of -Rhizoctonia spp, Observation for typical sheath blight symptoms was carried out daily. Re-isolation of tested Rhizoctonia spp. was carried out at the end of the pathogenicity test. The re-isolation was carried out in the same manner as described in section Scanning electron microscope observation of Rhizoctonia sol ani sclerotia Rhizoctonia sol ani isolated from infected rice plants was used for scanning electron microscope observation. Infected
42 30 rice tissues were removed aseptically with a razor blade and plated onto PDA medium amended with streptomycin sulphate solution. These plates were incubated at room temperature (26-35 C) for 10 days. Observation of sclerotial production was carried out daily~ Sclerotia produced on rice tissues and on PDA medium were taken aseptically and kept in sterile petri dishes for 2 days at room temperature (26-35 C). Specimens were then transferred to a desiccator and kept for 7 days for further drying at 25 C. At the end of the drying period, fungal specimens were removed and placed on a stub with electroconductive glue before being coated with gold particles by ion sputter apparatus (JFC-IIQO). Fungal specimens were observed with a scanning electron microscope (JSM-35 CF) at 15 KV Induction of teleornorphs of Rhizoctonia solani and Rhizoctonia spp. isolates One isolate of Rhizoctonia solani, and four isolates of Rhizoctonia spp. were tested for their production of the sexual stage (Sneh et al, 1991). Isolates of Rhizoctonia spp. were grown in petri dishes on a modified potato-yeast extract agar (PYDA) (Sneh et al., 1991) (Appendix I), and incubated at room temperature (26-35 C) for 5 days. When the hyphae reached the margins of the petri dishes, cultures were covered to the rim with air dried soil aggregates (3-5 mm diameter) taken from a paddy rice field. Distilled water was added 1-3 times daily and the excess water was decanted. The cultures were incubated at
43 31 room temperature (26-35 C) with the petri dish lids removed. Observation for basidiocarp production was done 3-14 days after soil was added Data analysis Data obtained from ~n vitro antagonism test between potential bacterial and fungal antagonists against Rhizoctonia solani were analyzed with the Statistical Package for Social Science (SPSS) computer package. One way analysis of variance was carried out on the width of clear zones, number of sclerotia produced, and covering distance of antagonists on Rhizoctonia solani. Data were compared with least significant differences (LSD) at p < 0.05.
44 Results Isolation of potential bacterial and fungal antagonists One hundred and twelve isolates of bacterial antagonists and sixty seven isolates of fungal antagonists were obtained (Table 3.1). The fungal antagonists obtained were divided into three groups, referred to as Group I, Group 2, and Group 3. Group 1 was tentatively identified as Trichoderma species group. Group 2 as Penicillium species group, and Group 3 consisted mainly of unidentified species. One bacterial isolate was identified as Bacillus subtilis, and nine isolates were identified as fluorescent Pseudomonas species (Appendix IV). Bacillus subtilis was isolated from rhizosphere soil of healthy rice plants, whereas the nine isolates of fluorescent Pseudomonas species were isolated from rhizosphere soil of sheath blight diseased rice, plants. All potential fungal antagonists were obtained from soil planted with rice plants.
45 33 Table 3.1 Potential bacterial and fungal antagonists isolated from rhizosphere soils and soils taken from Phatthalung Rice Research Centre. Microorganisms Bacteria Trichoderma spp. group Penicillium spp. group Unidentified hyphomycetes group Total Number of isolates
46 Isolation of Rhizoctonia sol ani One isolate of Rhizoctonia sol ani was obtained from infected rice plant tissues. One isolate of Rhizoctonia sp. was obtained from roots of diseased rice plant while three isolates obtained from soils from rice fields were identified as Rhizoctonia spp. Isolates of Rhizoctonia spp. obtained from soils were referred to as white type isolate, yellow type isolate, and brown type isolate according to the coloration of their cultures. The isolate of Rhizoctonia solani obtained from a rice plant which showed sheath blight disease symptom was examined microscopically and a pure culture was obtained ln the laboratory. The colony on PDA medium was white initially and then turned brown, and the mycelium grew superficially on agar. Rhizoctonia solani grew very fast (45 mm in radius within 3 days) at room temperature (26-35 C). Sclerotia were produced on agar surface- usually after the mycelium covered the whole plate. Sclerotia on PDA medium were grey when they were immature, and turned to deep brown 2 days later. Shape of sclerotia was varied on PDA medium but usually was spherical except for the flat side attached to the agar surface. Both single and aggregated sclerotia were observed on the agar medium. Sclerotia were mm wide, mm long, and mm high. Hyphae were septate, usually 6-12 ~m in diameter, and branched near the distal septum of cells. A septal pore apparatus was prominent in this isolate. Young mycelia were multinucleated. Brown barrel-shaped (monilioid)
47 35 cells were also observed, produced in aggregates. No conidia and clamp connections were observed (Appendix IV) In vitro antagonism of potential bacterial and fungal antagonists against Rhizoctonia solani Among one hundred and twelve isolates of bacterial antagonists tested against Rhizoctonia solani, ten isolates were effective in inhibiting mycelial growth and suppressing the production of sclerotia (Table 3.2). All these isolates delayed sclerotia production, especially isolate B 1. Among the isolates which reduced mycelial growth, B 18 reduced the number of sclerotia produced in dual culture more than other isolates and B 1 was also selected for further in vivo test in the greenhouse experiment based on the ability to reduce mycelial growth even though it did not create any clear (inhibition) zone. This bacterium grew very fast, and because of its motility, occupied the agar surface to an extent that Rhizoctonia solani mycelial growth was suppressed. This in turn affected the number and maturation of sclerotia produced. Bacterial antagonist isolates Bland B 18 were identified as Bacillus subtilis and Pseudomonas fluorescens respectively.
48 Table 3.2 Size of clear (inhibition) zone, number of sclerotia produced and time to maturity of sclerotia in in vitro antagonism tests with Rhizoctonia solani _Isolates Mean width of Mean number of Time to clear zone sclerotia sclerotial (mm) maturity (days) B 1 o 0 8 B B B B B B B B B control LSD p < 0.05 Note: The clear (inhibition) zone was measured and sclerotia were counted after 7 and 10 days respectively. Only mature sclerotia (dark brown) colour were counted. Incubation was carried out at C on PDA medium.
49 37 Among twenty-one isolates of potential fungal antagonists from Group 1 tested against Rhizoctonia solani, isolate T 1 reduced the number of sclerotia produced in dual culture significantly (Table 3.3). The other isolates (isolates T 2 - T 21) also showed their ability to reduce sclerotia production to various degrees. The ability of different isolates to overgrow Rhizoctonia solani mycelia was less obvious. Isolate T 1 did not obviously overgrow the Rhizoctonia solani colony. However, lack of obvious colonization observed visually did not indicate that colonization and parasitism did not occur. Observation of the dual culture with compound microscope between T 1 and Rhizoctonia solani taken from the area in which there was no obvious overlapping revealed that T 1 mycelia did coil around and penetrate Rhizoctonia solani mycelium. This indicated that colonization did occur prior to sporulation and the reduction in sclerotia produced in dual culture between T 1 and Rhizoctoniasolani was possibly the effect of colonization and parasitism. Thus Trichoderma spp. isolate T 1 was selected for further in vivo tests in the greenhouse experiment. Trichoderma spp. isolate T 1 was tentatively identified as Trichoderma koningii (Appendix IV).
50 38 Table 3.3 Overgrowth distance and number of sclerotia produced in in vitro antagonism test between Trichoderma spp. and Rhizoctonia solani. Isolates T 1 T 2 T 3 T 4 T 5 T 6 T 7 T 8 T 9 T 10 T 11 T 12 T 13 T 14 T 15 T 16 T 17 T 18 T 19 T 20 T 21 control LSD p < 0.05 Overgrowth distance (mm) o o Mean number of sclerotia Note : Overgrowth distance was measured and numbers 0f sclerotia of Rhizoctonia solani were counted 6 days after coinoculation and incubation was carried out at C on PDA medium.
51 39 A large number of Penicillium spp. (group 2) obtained from soil samples were selected and tested against Rhizoctonia solani. Both clear (inhibition) zones and numbers of sclerotia produced in dual culture were used as a basis for isolate selection (Table 3.4). Various degrees of inhibition of Rhizoctonia solani mycelial growth and reduced sclerotial production were exhibited by different isolates of Penicillium spp. (Table 3.4). Among thirty isolates, isolate P 10 created the largest clear (inhibition) zone and reduced sclerotia production markedly. Potential fungal antagonists from the unidentified isolates (group 3) were tested and selected on the basis of their ability to reduce sclerotia production. Different isolates of potential fungal antagonists from unidentified group exhibited various degree of sclerotia reduction when the data was compared (p < 0.05) (Table 3.5). Isolate M 11 also showed its potential for po~sible test in the greenhouse experiment by markedly reducing sclerotial production.
52 40 Table 3.4 Clear (inhibition) zone and number of sclerotia produced in in vitro antagonism test between Penicillium spp. group and Rhizoctonia solani. Isolates Mean width of clear zone (mm) Mean number of sclerotia P 1 P 2 P 3 P 4 P 5 P 6 P 7 P 8 P 9 P 10 P 11 P 12 P 13 P 14 P 15 P 16 P 17 P 18 P 19 P 20 P 21 P 22 P 23 P 24 P 25 P 26 P 27 P 28 P 29 P 30 control LSD P < 0.05 o 1.7 o o o o o 5.0 o o o o o 3.7 o o 2.0 o o o Note: Width of clear (inhibition) zone was measured and numbers of sclerotia of Rhizoctonia solani were counted 6 days after co-inoculation and incubation was carried out at C on PDA medium.
53 41 Table 3.5 Number of sclerotia produced in in vitro antagonism test between unidentified hyphomycetes and Rhizoctonia solani. Isolates Mean number of sclerotia M M M M M M M M M M M M M M M M control LSD 6.2 p < 0.05 Note: Number of sclerotia of Rhizoctonia solani were counted 6 days after co-inoculation and incubation was carried out at C on PDA medium.
54 In vitro compatibility among selected bacterial and fungal antagonists Obvious antagonistic interaction was observed between selected bacterial antagonists, Bacillus subtilis and Pseudomonas fluorescens. Clear zones were detected when Bacillus subtilis was streaked on cultures of Pseudomonas fluorescens (Figure 3.1 a) Attempts to re-isolate Pseudomonas fluorescens from this clear zone were not successful. On the other hand, there were no obvious antagonistic interactions when Pseudomonas fluorescens was streaked on cultures of Bacillus subtilis (Figure 3.1 b). Some antagonistic interactions were observed between Bacillus subtilis and Trichoderma koningii (Figure 3.1 c and d) but no obvious antagonistic interactions were observed between Pseudomonas fluorescens and Trichoderma koningii (Figure 3.1 e and f). Both Bacillus subtilis and Pseudomonas fluorescens were re-isolated from the dual culture test after they were covered by Trichoderma koningii.
 Pseudomonas fluorescens was streaked on Bacillus subtilis.")
55 43 Figure 3.1 Antagonism tests between selected antagonists. a) Bacillus subtilis was streaked on Pseudomonas fluorescens. Clear inhibition zone was observed and colonies of Bacillus subtilis expanded b) Pseudomonas fluorescens was streaked on Bacillus subtilis. No clear inhibition zone was observed and there was no growth of Pseudomonas fluorescens c) Antagonism test between Bacillus subtilis and Trichoderma koningii d) Reversed position (bottom view) of the same test. Some antagonistic interactions were observed e) Antagonism test between Pseudomonas fluorescens and Trichoderma koningii f) Reversed position (bottom view) of the same test. No clear inhibition zone was observed.
56 44 In the competitiveness test between selected bacterial antagonists and fungal antagonist, both Pseudomonas fluorescens and Bacillus subtilis were readily recovered from dual cultures on PDA medium after 3 days incubation, but Trichoderma koningii colonies were restricted by growth of bacterial antagonists (Figure 3.2 a and b), compared to colonies of individual Trichoderma koningii which grew profusely (Figure 3.2 c). Colony characteristics such as colour and diameter of Trichoderma koningii were also affected. Colony colour was pale green. Colonies were small (4-7 rom diameter). Only a very small number of colonies (1.6 colonies per plate) were observed In the dual cultures (Figure 3.2 a and b).
 Pseudomonas fluorescens and Trichoderma koningii.")
57 45 Figure 3.2 Competitiveness tests between a) Bacillus subtilis and Trichoderma koningii. Colonies of Trichoderma koningii were restricted and white colonies of Bacillus subtilis covered the medium surface b) Pseudomonas fluorescens and Trichoderma koningii. Colony of Pseudomonas fluorescens covered the most of the medium surface while colonies of Trichoderma koningii were restricted c) Colonies of Trichoderma koningii without either Bacillus subtilis or Pseudomonas fluorescens.
58 Pathogenicity tests Only Rhizoctonia solani isolated from sheath blight diseased rice plants initiated typical sheath blight symptom on the tested rice,plants (Figure 3.3). Re-isolation and reinoculation of Rhizoctonia solani from typical symptom of infected rice plants was successful.
59 47 Figure 3.3 Sheath blight disease symptom (arrows) on rice RD-l variety plants artificially inoculated with rice tissue infested with Rhizoctonia solani
60 Scanning electron microscope (SEM) observation of Rhizoctonia solani sclerotia Sclerotia of Rhizoctonia solani were irregularly globose to sub-globose with either a pitted or smooth surface. It was possible that sclerotia were produced from Rhizoctonia solani mycelia colonizing rice tissues. Diameter of sclerotium of Rhizoctonia solani taken from PDA medium (Figure 3.4 a) was 1.3 times longer than diameter of that observed on the rice tissue (Figure 3.4 b). Aggregates of sclerotia of Rhizoctonia solani were usually found from sclerotia taken from PDA medium, while single sclerotia were observed on rice tissues. Contact fusion was also observed between mycelia of Rhizoctonia solani, but it was not possible to prove whether or not lysis of cell walls occurred at the site of contact.

61 49 Figure 3.4 Scanning electron micrographs of sclerotia of Rhizoctonia solani. a) sclerotia from PDA medium and b) sclerotia from rice tissues
62 Induction of teleomorphs in Rhizoctonia spp. From four isolates of Rhizoctonia spp. and one isolate of Rhizoctonia solani used for induction of teleomorphs, only the white type isolate of Rhizoctonia solani obtained from soils initiated the teleomorphic stage (Figure 3.5 a). Basidiocarps were observed 14 days after the overlay of soil aggregate to cover Rhizoctonia sp. cultures. Basidiocarps were white and small (approximately 10 mm from the soil surface and 15 mm wide) (Figure 3.5 a). Some basidiocarps were immature and appeared as small white fruiting bodies on the soil surface. Microscopically, basidia were observed with fine sterigmata. Four sterigma were detected per basidium, but no basidiospores or cystidia were observed (Figure 3.5 b). However, this study failed to identify this teleomorphic stage of the white type isolate of Rhizoctonia sp.

63 51 Figure 3.5 Basidiocarps and microscopic structures of unidentified teleomorphic stage of white type isolate of Rhizoctonia sp. a) basidiocarps on air dried soil surface and b) basidia and sterigmata
64 Discussion Rhizosphere soils and soils from rice paddy fields were good sources of bacterial and fungal antagonists. This study showed that both fluorescent and non-fluorescent bacterial species were readily available in the rhizosphere soil of rice root. Fungal antagonists were also detected from soils planted with rice plants. Among one hundred and twelve isolates of isolated bacterial antagonists from rhizosphere soil of rice plants, nine isolates of these bact~rial antagonists were fluorescent Pseudomonas spp. and one of these isolates was tentatively identified as Pseudomonas fluorescens (isolate number 18). Fluorescent Pseudomonas spp. were also found in the rhizosphere soils in other cereal, fibre, and tuber crops (Mew and Rosales, 1986). As for the Bacillus spp., Gram-positive bacteria like Bacillus spp. were always present on roots of the major temperate cereals (Ja9now, 1991). This study also showed that Bacillus subtilis was present on rice roots. This study showed that most of the isolated fungal antagonists were spore forming. These species included Trichoderma spp., Penicillium spp., and other spore-forming unidentified fungi species. Fungi exist in soil in a variety of morphological forms (Kendrick and Parkinson, 1990), including spores of various types, dormant structures, and active and dormant hyphae. The fact that mostly spore forming fungi could be obtained was associated with the use of the soil plate technique in this study. Soil plate and soil dilution plate
65 53 methods are convenient and fast, but these two methods selectively isolate fungi present in soil samples as spores. Thus, non-sporing potential fungal antagonists may not have been obtained in this study. Rhizoctonia spp. were readily isolated from diseased plants and soils, with isolates differing in pathogenicity and morphology, as well as cultural and physiological characteristics (Ogoshi, 1987). Rhizoctonia solani was varied in its pathogenicity, sclerotial morphology, cultural appearance on media, and physiological characteristics. This indicated that Rhizoctonia solani is a collective species and taxonomic groupings of the species are known to be artificial. Although there have been many attempts to divide Rhizoctonia solani into logical groups, these attempts may fall basically into two categories: those based on differences ln pathogenicity, cultural appearance, morphology,- physiology, or ecology; and those based on hyphal anastomosis on cultural media (Ogoshi, 1987). Neith~r may be able to explain the phylogeny of Rhizoctonia solani. Recently, analysis of ribosomal DNA by technique such as restriction fragmentation length polymorphism (RFLPs) was used for studying phylogenetic and physiological relationships among isolates and anastomosis groups of Rhizoctonia spp. (Vilgalys and Gonzalez, 1990). These techniques have confirmed that isolates within anastomosis groups are related genetically (Sneh et al., 1991). These studies showed that Rhizoctonia solani isolated from infected rice plant tissues, and Rhizoctonia spp. isolated from rice roots and soils taken from rice fields were diversified
66 54 morphologically and culturally. Pathogenicity tests conducted showed that Rhizoctonia solani, isolated from infected rlce plant tissues, caused sheath blight disease symptom on the tested rice plants. However, other isolates of Rhizoctonia spp. obtained from rice roots and soils planted with rice may belong to the same anastomosis group as that of the isolate which could cause sheath blight disease symptom. Reference isolates of known anastomosis group of Rhizoctonia spp. should be obtained and used to test against local isolates of Rhizoctonia spp. obtained from this studies to ascertain their anastomosis 'I groups. Unfortunately, reference lsolates of known anastomosis group of Rhizoctonia spp. could not be obtained due to quarantine regulations (Ogoshi, Personal communication), and thus classification of Rhizoctonia spp. isolated in these studies could not be carried out. In vitro tests for selecting effective isolates of bacterial and fungal antagonists are the basic procedure in biological cdntrol research. The specific objectives of a biological control research programme may dictate methodological options used for in vitro tests. This requirement makes it necessary that the strategy of plant pathogens and isolated potential antagonists should be taken into account right at the start of a biological control programme so that selected potential antagonists based on ~n vitro tests may be effective with the plant pathogen in the real situation (Campbell, 1989). For instance, agar tests based on antibiosis may be suitable for selecting potential antagonists to protect the plant from primary colonization.
67 55 Selection based on the degradation of survival structures of plant pathogens may be appropriate for screening potential antagonists for killing the plqnt pathogen in the soil or eradicating an existing infection on the plant. In this study, all of the fluorescent Pseudomonas spp. produced inhibit ion zones when they were paired with Rhizoctonia solani. This indicated that antibiosis may be the mechanism of inhibition. However, to ascertain that antibiosis was the mechanism of inhibition, biochemical evidence must be established to demonstrate a causal relationship between in vitro antibiosis and biological control activity (Handelsman and Parke, 1989). Nutrient competition may also be responsible for biological control activity. Bacillus subtilis, one of the potential antagonist, may be a good nutrient competitor. However, nutrient competition ls one of the most difficult biological control strategies to study. This may be because a complex array of nutrients are available in the soils, and the levels and availability of the nutrients changes with every perturbation. Thus, it is very difficult to duplicate this complex and variable system in the laboratory (Handelsman and Parke, 1989). A large number of Trichoderma spp. and Penicillium spp., tested against Rhizoctonia solani, exhibited various degrees of Rhizoctonia solani suppression. Hyphal interaction of Trichoderma spp. and Rhizoctonia solani were examined microscopically and there was direct contact between the mycelia of Trichoderma spp. and that of Rhizoctonia solani. Coiling hyphae of Trichoderma spp. were also found around
68 56 Rhizoctonia solani hyphae. This evidence may indicate that a destructive mycoparasite was involved in Rhizoctonia solani suppression. For instance, hyphae of Trichoderma hamatum parasitized hyphae of Rhizoctonia solani and pythium ultimum (Chet et al., 1981). Unlike antibiosis and nutrient competition, an 'advantage in working with mycoparasites was that the mycoparasite physically contacted its host and destroyed it. Thus the effect of mycoparasitism was direct, and quantifiable. Mycoparasitism could also be demonstrated in situ by recovering pathogen over time, testing their viability, and determining the presence of the parasite on these propagules (Handelsman and Parke, 1989). Phase-contrast and Nomarski differential interference-contrast microscopy should be used to elucidate the mechanism of Rhizoctonia solani suppression by fungal antagonists (Chet et al., 1981). This should be done to ascertain the mechanism of Rhizoctonia solani suppression. The importance of synergism and the benefits of mixtures of selected 'antagonists in biological control of plant pathogen were suggested by some authors (Bell et al., 1982; Cook, 1991) Natural systems, especially soil environment, are complex and are a competitive environment for microorganisms (Harman and Lumsden, 1991). Thus, it is necessary to conduct basic in vitro tests to ascertain the compatibility of mixtures of selected antagonists, However, in vitro antagonism tests are a simplistic approach to understanding an interaction between selected antagonists (Bell et al., 1982). In this study, the results suggested that mixtures of Trichoderma koningii with either Pseudomonas fluorescens or Bacillus subtilis were
69 57 compatible, while incompatibility was observed between Pseudomonas fluorescens and Bacillus subtilis. However, it 1S important to remember that an indirect in vitro antagonism test may only infer potential antagonism among selected antagonists and this may be misleading. To date~ nothing can fully replace results obtained 'from interactions between selected antagonists in a natural ecosystem (Harman and Lumsden, 1991) Pathogenicity studies of Rhizoctonia solani, isolated from infected rice plant tissues, and Rhizoctonia spp., obtained from rice roots and soils planted with rice, revealed that parasitic relationship could be established between Rhizoctonia solani isolated from infected rice plant tissues. Rhizoctonia spp., taken from soils planted with rice, could not initiate disease symptom with tested rice plants and might be a saprophytic strain. While Rhizoctonia solani could survive parasitically and saprophytically, Rhizoctonia sp., isolated from roots of rice may be pathogenic on other plant species or only weakly parasitic on ri~e roots. Isolates of Rhizoctonia spp. constituted the largest group of endophytes associated with orchid roots (Sneh et al., 1991). Thus, it may be worth investigating the symbiotic characteristics of this isolate on other plant species. Isolates of Rhizoctonia spp. may sporulate when exposed to specific environmental conditions (Sneh et al., 1991). However, isolates of Rhizoctonia spp. may differ in their requirement for specific environmental conditions. Our study showed that one isolate of Rhizoctonia spp. (white type isolate) from soil formed the teleomorphic stage, while the other isolates of
70 58 Rhizoctonia spp. and Rhizoctonia solani did not initiate teleomorphic stage. This phenomenon may be the result of the different requirements among Rhizoctonia spp. for specific environmental conditions for the induction of teleomorphs.
71 59 Chapter 4 In vivo test for suppression of sheath blight disease of rice 4.1 Introduction Protocols have been proposed for discovery, development and testing of potential antagonists of plant pathogens. However, no single general approach has emerged. Protocols continue to evolve with continuing research and development for potential antagonist selection (Cook, 1993). Currently, the crucial steps are (1) test the performance of isolates of potential antagonists ~n v~vo in a greenhouse or growth chamber, (2) screen in vivo in the field and (3) finally scale-up for commercial application (Cook, 1993). The second and third steps are necessary to transfer the technology to the fields for the farmers (Cook, 1991). Th~s represents the most demanding component of any evaluation of biological control treatment (Merriman and Rus~ell, 1990). The objective of the in vivo tests is to verify that the potential antagonists are effective outside the laboratory (Campbell, 1989). This implies that in vivo tests are needed to assess the potential antagonist survival in the environment where they are expected to be effective, and to assess the efficacy of potential antagonists for the amount of disease suppression. However, selection of potential antagonists based on in vivo tests has intrinsic limitations because of the variation of
72 60 biological and environmental factors. These variations make it difficult to demonstrate treatment effects (Campbell, 1989; Merriman and Russell, 1990), and this causes a difficulty in potential antagonist selection. Potential antagonists should be selected basing on their effectiveness in disease suppression for particular environments, rather than screening all microorganisms randomly. Testing for potential antagonist performance needs to be conducted over many sites and years to determine the area of potential use and whether different locally adapted strains may be necessary (Cook, 1993). This appr.oach is appropriate because of the need to ensure that optima for growth and survival of the test potential antagonists fall within the range of conditions experienced at the field sites (Merriman and Russell, 1990). This indicates that selection for potential antagonists for the scaleup commercial application is a long term commitment in which financial and time input are required. Field testing of potential antagonist performance and ~he investigation of potential antagonist ecology in the small scale experimental plot are really needed as an extension of primary screening in the laboratory and greenhouse (Campbell, 1989). In these studies preliminary tests were conducted both in the greenhouse and in the field. Selected antagonists were tested with several potential application methods.
73 Materials and methods Experimental design For the greenhouse experiment, there were 3 methods of inoculation and.6 antagonist treatments. Each treatment combination had 3 replicate pots and each replicate had 4 rice plants. The pots were arranged in a completely randomized design (CRD). Two selected bacterial antagonists were used in the field experiment. They were Pseudomonas fluorescens (B 18) and Bacillus subtilis (B 1). Seed treatment and rice plant spraying were used as application methods. Rice plants were sprayed with selected bacterial antagonists either seven days or one day before inoculation of rice stems with Rhizoctonia solani. Each treatment consisted of three replicates. The experiment was arranged in a randomized complete block (RCB) design Soil and field preparation For the greenhouse experiment, clay loam lowland rice soil used in these experiment was collected from Phatthalung Rice Research Centre (Appendix III). Soil (7 kg) from the top 150 rom was transferred to clay pots (300 rom diameter and 450 rom high) Each clay pot was filled with tap water until the soil was totally soaked and the water level was maintained above the soil
74 62 level. After 24 hours the soils were agitateg manually to break up aggregates and excess water was drained. For the field experiment, a rice field (8 x 20 metres) was prepared for rice seedling transplanting. The rice field preparation involved clearing weed and soil preparation so that soil conditions.were suitable for producing rice in lowland rice production system. The rice field was flooded with water and ploughed so that soil aggregates were broken up. Excess water was drained 2 days later and the field was partitioned into 3 blocks (20 m by 2 m). Each block was separated by a 1 m walk way. Each block was further partitioned into 9 sub-plots (2 m x 2 m) by earth embankments. The shoulder of each earth embankment was 20 cm wide. The rice field was flooded again and the water level was maintained by opening or closing a small slit on each sub-plot embankment Rice seedlings and rice plant preparation For the greenhouse experiment, twenty rice seeds (RD-1 variety) (surface sterilized with 4.5 % (v/v) sodium hypochlorite, and rinsed with sterilized water 3 times) were sown in each clay pots. After 1 week, excess rice seedlings were removed and 4 uniform rice seedlings were allowed to grow for further experimentation. For the field experiment, rice seedlings (RD-1 variety) were raised in plastic seedling boxes (300 x 450 x 100 rom) in the
75 63 greeqhouse at Phatthalung Rice Research Centre. Rice seeds (400 g) were surface sterilized as described previously and divided into two groups. Seeds (100 g) were treated with antagonists (either Pseudomonas fluorescens or Bacillus subtilis) and sown in three plastic seedling boxes. The remaining 300 g of seeds were sown without antagonists. These were used for the spray and control treatments. After 25 days in plastic boxes, all rlce seedlings were transplanted into the field with 20 cm spacing between and within row in each 2 x 2 m sub plot. Nine rows and nine columns of rice seedlings were planted for each 2 x 2 m sub plot. Two rice seedlings were planted at each hill site. Seedlings destroyed by rat were replaced with rice seedlings from the greenhouse. Rice seeds were sown in the greenhouse on April 30, 1993, and seedlings were transplanted to field plots prepared as described in section on May 24, Antagonist inoculum and application Inoculum of the bacterial antagonists, Pseudomonas fluorescens and Bacillus subtilis, was prepared by growing on Pseudomonas Agar F (Difco) (Schaad, 1980), and potato peptone agar respectively for 48 hours at 25 C (Charigkapakorn et al., 1992). Sterilized water (25 ml) was added to 4 plates and the bacteria were gently scraped from the agar surface with a sterilized glass rod. Bacterial suspensions were adjusted to a concentration of about 1 x 10 6 colony-forming units (cfu)/ml. For
76 64 the fungal antagonist, Trichoderma koningii was grown on PDA plates for 2 weeks at 25 C. Sterilized water (25 ml) was added to 4 plates and spores were scraped from the agar surface. This spore suspension was adjusted to a concentration of about 1 x 10 6 spores/ml. For combined antagonist tests, equal volumes (50:50) of cell suspensions of either Pseudomonas fluorescens or Bacillus subtilis were mixed with spore suspensions of Trichoderma koningii, using a concentration of about 1 x 10 6 for each antagonist. For the greenhouse experiment, antagonists were applied by seed treatment, rice root dipping, and plant spraying. For seed treatment, 200 g of rice seeds (RD-1 variety) surface sterilized as described in section were soaked ln suspensions of either single or combined antagonists for 24 hours before being sown. For the dipping treatment, roots of 5 day old rice seedlings were immersed in suspensions of either single or combined antagonists and they were then planted. For the plant spraying treatment, 20 ml ot either single or combined antagonists were sprayed on 25 day old rice plants in each pot with a hand-held sprayer. Each rice plant received approximately 5 ml of antagonist suspension. For the field experiment, 1,800 ml of bacterial antagonist suspensions, prepared as described previously, was sprayed with shoulder knapsack sprayer on the inner-most 25 hills of plants ln each treatment (each replicate received 600 ml of bacterial antagonist suspensions). Plants were sprayed seven days before
77 65 Rhizoctonia solani inoculation (at 78 days after sowing) and one day before Rhizoctonia solani inoculation (at 84 days after sowing) in separate treatments. Spray was aimed at the lower parts of rice hills above the waterline where Rhizoctonia solani was inoculated. Both inner and outer parts of rice hills were sprayed thoroughly Inoculum and inoculation of Rhizoctonia sol ani Rice plants (40 days after sowing) were collected from the field, and stems were chopped into small pieces (10-15 mm). These were autoclaved 3 times (20 minutes each time) at 121 C before inoculation with one plug (5 mm diameter) of a virulent strain of Rhizoctonia solani taken from pure culture maintained in the incubator at 4 C. This substrate was incubated at room temperature (26-35 C) for 2 weeks. For the greenhouse experiment, each 25 day old rice seedling received Rhizoctonia solani-inoculum by placing one piece between the outer leaf sheath and the rice stem at the water level (20 mm above the soil surface). Another set of rice plants were prepared similarly, but inoculated with Rhizoctonia solani when 60 days old. Inoculation was carried out by placing five pieces of Rhizoctonia solani inoculum in the centre of each rice hill at the water level (20 rnm above the soil surface). For the field experiment, the inner most twenty-five hills were inoculated with 50 g of Rhizoctonia solani inoculum in each
78 66 hill 85 days after sowlng. Clumps of Rhizoctonia solani inoculum were placed manually above the water level within the centre of each hill. The water was maintained at the same level (100 rom deep) for the whole period of the experiment to ensure that inoculum did not dry out Detection of applied bacterial antagonists Antagonists applied were detected from un-germinated seeds, 7 day old rice seedlings, and 25 days old rice seedlings treated by either seed treatment or root dipping. For antagonist recovery from un-germinated seeds, five seeds treated with cell suspensions of either Pseudomonas fluorescens or Bacillus subtilis (antagonist suspensions were prepared as described in section 4.2.4) for 24 hours were pressed into either Pseudomonas Agar F or potato peptone agar. These seeds were taken out after being pressed for 25 seconds on agar media and discarded. Five seeds treat~d with sterilized water were pressed into either Pseudomonas Agar F or potato peptone agar and used as a control treatment. Plates were incubated for 7 days at 25 C for recovering either Pseudomonas fluorescens or Bacillus subtilis. For antagonist recovery from 7 day old rice seedlings, seeds treated with either Pseudomonas fluorescens or Bacillus subtilis were raised on filter paper in the laboratory for 7 days. Seeds treated with sterilized water were raised on filter paper as a control treatment. These seedlings were pressed on either
79 67 Pseudomonas Agar F or potato peptone agar for 10 seconds before they were taken out from agar media. Plates were incubated as described for the antagonist recovery from un-germinated seeds. For antagonist recovery from rice seedlings treated by seed treatment,. seedlings were raised for 25 days in the greenhouse. These seedlings were obtained from seeds treated with either Pseudomonas fluorescens or Bacillus subtilis for 24 hours as described previously in the laboratory. Rice seedlings raised from seeds treated with sterilized water were used as a control. These seedlings were removed from the clay pots, and the roots were washed with running tap water in the laboratory. Each plant was cut with sterilized razor blade into four portions. They were rlce roots, rice culms (50 mm above soil surface), rice stems (100 mm above soil surface), and rice leaves. Each piece (50 mm long) was pressed on either Pseudomonas Agar F (for Pseudomonas fluorescens) or potato peptone agar (for BacilJus Subtilis). Plates were incubated as described previously. For antagonist recovery from the root dipping treatment, 7 day old rice seedlings raised on filter paper in the laboratory were dipped into the antagonist suspensions prepared as described in section Rice seedlings dipped in sterilized water were used as a control treatment. These seedlings were planted in soil prepared as described in Rice seedlings were raised for 25 days before being carefully pulled off from soil and roots were carefully washed with running tap water in the laboratory. Each plant was cut and divided into 4 portions as described
80 68 previously. Antagonists were recovered as described for seed treatment experiment. plates were incubated as described for antagonist recovery from un-germinated seeds Scanning Electron Microscope (SEM) observations and quantitative study of applied bacterial antagonists Twelve rice plants were randomly selected from 6 field plot treatments (two plants from each treatment, including seed treatment, spray 7 days, and spray 1 day with either Pseudomonas fluorescens or Bacillus subtilis before inoculation with Rhizoctonia solani) by cutting the rice stem at the waterline and place in a plastic bag. These rice plants were used to study quantitatively for the population of applied Bacillus subtilis and Pseudomonas fluorescens. The other 3 plants were randomly selected-from 3 field plot treatments (one plant from each treatment, including seed treatment, spray 7 days, anq spray 1 day with Bacillus subtilis before inoculation with Rhizoctonia solani) and used to observe Bacillus subtilis visually on the surface of the rice stem by SEM. For quantitative study, rice stems (10 g) from the field were cut into small pieces (3-5 mm long). These were washed ln 90 ml of sterilized water and serially diluted to a final concentration (10-6 g/ml). The diluent (0.1 ml) of each concentration was spread on PDA medium, and incubated at 25 C for
81 69 5 days. The number of Bacillus subtilis and Pseudomonas fluorescens colonies was counted on suitable dilutions plates. SEM was used to observe Bacillus subtilis applied onto rice plants. Collected rice plants were taken to the Scanning Electron Microscope unit, Department of Pathology, Faculty of Medicine, Prince of Songkla University for specimen preparation and SEM observation (Appendix V). Five different fields of each rice plant specimen were observed with various magnifications at 10 and 15 KV with SEM (JSM-35 CF). SEM micrographs were taken and kept as a record Disease assessment For the greenhouse experiment, lesion height and plant height (mm) were measured 14 days after Rhizoctonia solani inoculation. Relative lesion height (RLH) was calculated as the proportion of lesion height to plant height. Sheath blight lesion height was measured from th~ soil surface to the upper most end of the sheath blight symptom. For the field experiment, disease was assessed 21 days after Rhizoctonia solani inoculation on August 14, The inner most nine from twenty-five hills of rice plants were cut at the soil surface and taken to the laboratory. Sheath blight lesion height was measured from the end of rice sterns (cut at soil surface level) to the upper-most end of the sheath blight symptom for every infected tiller. The number of hills per plot and tillers
82 70 per hill infected with Rhizoctonia solani were counted Data analysis Data obtained from the greenhouse experiment were analyzed using the Statistical Package for Social Science (SPSS) computer package. Two way analysis of variance was carried out on lesion height, relative lesion height (RLH), plant height, and tiller number. bata was compared with least significant difference (LSD) at P < Data obtained from field experiment were analyzed by using Statistical Package for Social Science (SPSS) computer package. Two way analysis of variance was carried out on lesion height of sheath blight disease symptom. Data was compared with least significant difference (LSD) at P < Number of infected hills per plot and number of infected tillers per hill were also counted.
83 Results Suppression of sheath blight disease development In the greenhouse experiment, there was a significant interaction between isolates and methods of applications for lesion height and relative lesion height (RLH) at the seedling stage but there was no interaction for plant height and tiller number per plant (Table 4.1). There were no interactions for lesion height, relative lesion height (RLH), plant height, and tiller number per plant at the tillering stage (Table 4.2) At the seedling stage, different types of isolates both single (B 18, B 1, and T 1) and combined ( B 18 + T 1 and B 1 + T 1) antagonists suppressed sheath blight disease development comparing to control treatment when lesion height was used as a parameter (LSD at p < 0.05 = 8.2) (Table 4.1). Isolate B 18 gave the best sheath blight suppression, following by isolates B 1, T 1, B 1 + T 1, and B 18 + T 1 respectively (Table 4.1 and Figure 4.1). However, only single (both B 18 and B 1) antagonists suppressed sheath blight disease development when relative lesion height (RLH) was used as a parameter (LSD at p < 0.05 = 0.03) (Table 4.1 and Figure 4.2) while there was no statistical difference between the other treatments [both single (T 1) and combined (B 18 + T 1 and B 1 + T 1)] and control treatment. In term of application methods, spraying gave the best
84 72 Table 4.1 Effect of antagonist treatments on lesion height, relative lesion height (RLH), plant height, and tiller number at the seedling stage (25 days after sowing) in the greenhouse. Lesion Relative Plant Tiller height lesion height number per (mm) height (mm) plant Isolates control B B T B 18 + T B 1 + T LDS at p < B Application methods Seed treatment Dipping Spraying LSD at p < Interaction s s n.s. n.s. LSD at p < Note: Relative lesion height = lesion height/plant height
85 Table 4.2 Effect of antagonist treatment on lesion height, relative lesion height (RLH), plant height, and tiller number at _t_h_e_t_l_ 1_1_e_r_i_n_g_s_t_a_ g _e_(_6_0_d_a_ y _s_a_f_t_e_r s_o_w_i_n_g_)_l_n t_h_e_g_r_e_e_n_h_o_u_s_e_ -: Lesion Relative Plant Tiller height lesion height number per (mm) height (mm) plant Isolates Control B B T B 18 + T B 1 + T LSD at p < Application methods Seed treatment Dipping Spraying LSD at p < Interaction n.s. n.s. n.s. n.s. LSD at p < Note: Relative lesion height = lesion height/plant height
86 , I lesion height (mm) 80~ ~ o control B 18 B1 T1 B 18 + T 1 B 1 + T 1 antagonists ~ Seed treatment _ Root dipping D Spraying B 18 = Pseudomonas fzuorescens, B 1 = Bacillus subtilis, T 1 = Trichoderma koningii Figure 4.1 Sheath blight lesion height at seedling stage (25 days after sowing) -.J 11=>0 t:: ~:- j11!
87 , I relative lesion height 0.35~ ~ , o control B 18 B 1 T 1 B 18 + T 1 B 1 + T 1 antagonists _ Seed treatment _ Root dipping D Spraying B 18 = Pseudomonas fzuoreseens, B 1 = BaeiZ Zus subti lie', T 1 = Trid'lOderma koningii Figure 4.2 Sheath blight relative lesion height at seedling stage (25 days after sowing)
88 76 suppression of sheath blight disease development, following by seed treatment while dipping was not effective when lesion height was used as a parameter at the seedling stage (LSD at p < 0.05 = 5.8) (Table 4.1 and Figure 4.1). However, seed treatment provided the best sheath blight disease suppression, while spraying and dipping were not effective when relative lesion height (RLH) was used as a parameter (LSD at p < 0.05 = 0.02) (Table 4.1 and Figure 4.2). At the tillering stage, there was no statistical difference for the effectiveness of different types of isolates when both relative lesion height (RLH) and lesion height were used as a parameter (LSD at p < 0.05 = 0.14 and LSD at p < 0.05 = 17.6 respectively) (Table 4.2, Figure 4.3 and Figure 4.4) In term of application methods, seed treatment provided the best sheath blight disease suppression, while s-praying and dipping treatments were not effective when lesion height was used as a parameter (LSD at p < 0.05 = 12.5) (Table 4.2 and Figure 4.4). In addition, there was no statistical difference for the effectiveness of application methods when relative lesion height (RLH) was used as a parameter (LSD at p < 0.05 = 0.09) (Table 4.2 and Figure 4.3).
89 , I relative lesion height 0.4~ ~ ~ o control B 18 B 1 T 1 B 18 + T 1 B 1 + T 1 antagonists _ Seed treatment _ Root dipping o Spraying B 18 = Pseudomonas fluorescens, B 1 = Bacillus subtilis, T 1 = Trichoderma koningii Figure 4.3 Sheath blight relative lesion height at tillering stage (60 days after sowing)
90 lesion height (mm) 200,~ ~, I o control B 18 B 1 T 1 B 18 + T 1 B 1 + T 1 antagonists _ Seed treatment '_ Root dipping D Spraying B 18 = Pseudomonas fluorescens, B 1 = Bacillus subtilis, T 1 = Trichoderma koningii Figure 4.4 Sheath blight lesion height at tillering stage (60 days after sowing) -..J (X) :) ". ". j n
91 79 In the field experiment, there was an interaction between antagonist application methods and isolates (Pseudomonas fluorescens and Bacillus subtilis) (Table~4.3). Spray 1 day before Rhizbctonia solani inoculation 1SP 2) gave better sheath blight disease suppression than spray 7 days before Rhizoctonia solani inoculation (SP 1) while seed treatment (ST) was not effective when lesion height was used as a parameter (LSD at p < 0.05 = 24.4) (Table 4.3 and Figure 4.5). Pseudomonas fluorescens (B 18) gave better disease suppression than Bacillus subtilis (B 1) when lesion height was used as a parameter (LSD at p < 0.05 = 24.4) (Table 4.3 and Figure 4.5). However, assessment of sheath blight disease incidence as the number of infected hills per plot showed that disease incidence was 100 % in all treatments. Assessment of sheath "" blight disease incidence as the number of infected plants per plot revealed that disease incidence ranged from 93 % to 100 %. The sheath blight disease incidence was lowest in the treatment in which Pseudomonas fluorescens was sprayed seven days before Rhizoctonia solani inoculation. Sheath blight disease incidence was very high because a high inoculum load of Rhizoctonia solani was used for artificial inoculation.
92 8 Table 4.3 Effect of antagonist treatment on sheath blight lesion height in the field in which antagonists [Pseudomonas fluorescen (B 18) and Bacillus subtilis (B 1)] were applied as seed treatment, spray seven days, and spray one day before Rhizoctonia sol ani inoculation Lesion height (rom) Methods of application -Seed treatment -Spray 7 days before Rhizoctonia sol ani inoculation -Spray 1 day before Rhizoctonia sol ani inoculation LSD at p < Isolates -B 18 -B 1 -control LSD at p < 0.05 Interaction LSD at p < s 42.3
93 lesion height (mm) 600~ ~, I o ST SP 1 SP 2 methods and timings of application I-B18 D control ST seed treatment, SP 1 sprayed antagonists 7 days before Rhizoctonia solani inoculation, SP 2 = sprayed antagonists 1 day before Rhizoctonia solani inoculation Figure 4.5 Effect of treatments on sheath blight lesion height from field experiment
94 Detection of antagonists on plant surfaces Bacterial antagonists, both Bacillus subtilis and Pseudomonas fluorescens, applied to rice seeds were recovered from un-germinated rice seeds, and from seven-day-old rice seedlings [Figure 4.6 (A) and (B); Figure 4.7 (A) and (B)]. Bacillus subtilis was recovered from all plant parts both from seed treatment and root dipping [Figure 4.6 (C) and (D)]. Pseudomonas fluorescens was recovered from all plant parts when it was applied as seed treatment [Figure 4.7 (C)] and it was recovered from all plant parts except leaf when it was applied as root dipping [Figure 4.7 (D)]. Bacillus subtilis and Pseudomonas fluorescens were not recovered from control treatment in which rice seeds were treated with sterilized water or rice roots were dipped into sterilized water [Figure 4.6 (E) and Figure 4.7 (E)]. Quantitatively, the greatest number of Pseudomonas fluorescens and Bacillus subtilis cells was recovered from samples taken from the one day spraying treatment (Table 4.4) The numbers of Pseudomonas fluorescens and Bacillus subtilis recovered from the seven days spraying treatment and seed treatment were lower than the numbers of Pseudomonas fluorescens and Bacillus subtilis recovered from the one day spraying treatment.
95 83 Figure 4.6 (A) Bacillus subtilis colonies recovered from ungerminated seeds a) Bacillus subtilis b) water control treatment (B) Bacillus subtilis recovered from seven-day-old rice seedlings a) Bacillus subtilis b) water control treatment (C) Bacillus subtilis recovered from plant parts when applied as seed treatment a) root b) stem section 50 mm from soil surface c) stem section 100 mm from soil surface d) leaf (D) Bacillus subtilis recovered from plant parts when applied by dipging a) root b) stem section 50 mm from soil surface c) stem section 100 mm from soil surface d) leaf and (E) water control treatment a) root b) stem section 50 mm from soil surface c) stem section 100 mm from soil surface d) leaf Note: Bacillus subtilis colonies are indicated by arrows
96 84
97 85 Figure 4.7 (A) Pseudomonas fluorescens colonies recovered from un-germinated seeds a) Pseudomonas fluorescens b) water control treatment (B) Pseudomonas fluorescens recovered from seven-dayold rice seedlings a) Pseudomonas fluorescens b) water control treatment (C) Pseudomonas tluorescens recovered from plant parts when applied as seed treatment a) root b) stem section 50 mm from soil surface c) stem section 100 mm from soil surface d) leaf (D) Pseudomonas tluorescens recovered from plant parts when applied by dipping a) root b) stem section 50 mm from soil surface c) stem section 100 mm from soil surface d) leaf and (E) water control treatment a) root b) stem section 50 mm from soil surface c) stem section 100 mm from soil surface d) leaf Note: Pseudomonas fluorescens colonies are indicated by arrows
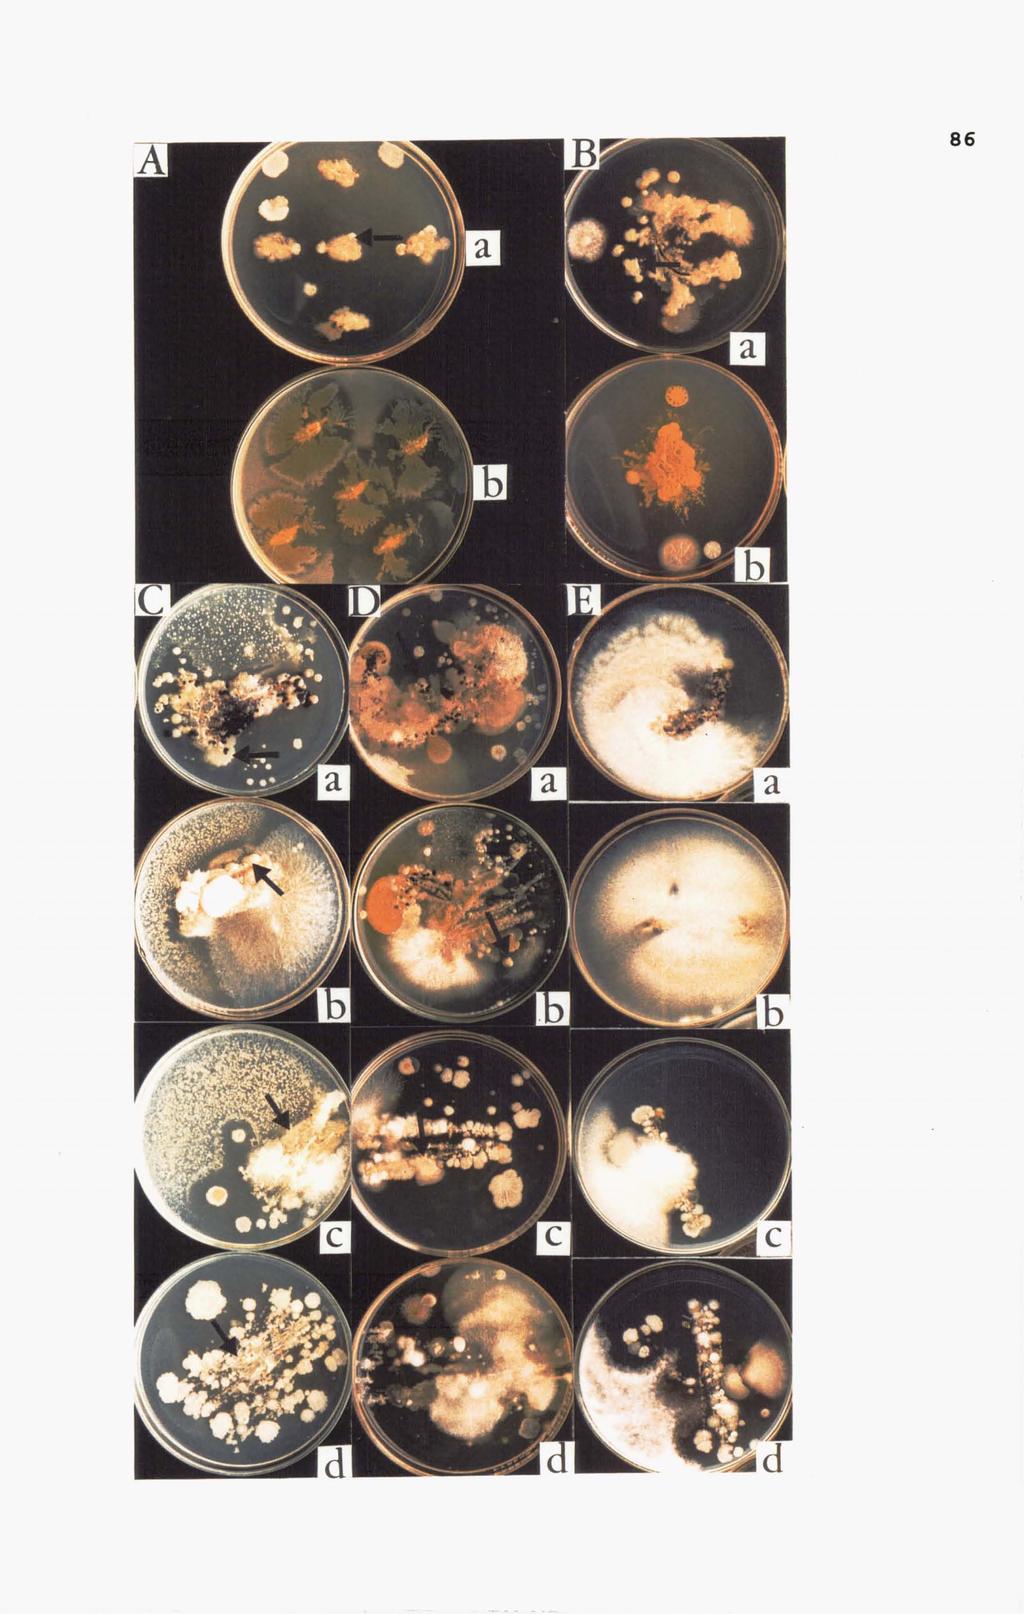
98 86
99 87 Table 4.4 Number a of Pseudomonas fluorescens and Bacillus subtilis colonies recovered from rice plant stem surface. a) The population of bacterial antagonists recovered was expressed as a number of bacterial antagonist colony forming units per mg (cfu/mg) of rice tissues. b) Number of days before rice plant samples were collected.
100 Scanning electron microscope observations Greatest numbers of Bacillus subtilis were observed by SEM when applied by spraying one day before collecting the rice plant sample (Figure 4~8 a). Similarly, greater numbers of Bacillus subtilis were observed when applied seven days before collecting the samples (Figure 4.8 b) compared to the seed treatment (Figure 4.8 c). Bacillus subtilis cells were easily found and always observed on the rough plant surfaces, while fewer cells attached on the smooth surfaces. Bacillus subtilis cells were also seen to multiply on the rice plant stem surface in the seven days before spraying treatment.
 Spraying rice plant with Bacillus subtilis one day before collecting the")
101 89 Figure 4.8 Scanning electron micrographs of Bacillus subtilis on rice stem a) Spraying rice plant with Bacillus subtilis one day before collecting the samples b) Spraying rice plant with Bacillus subtilis seven days before collecting the samples and c) seed treatment with Bacillus subtilis