SUPPLEMENTARY INFORMATION
|
|
|
- Charles Wells
- 5 years ago
- Views:
Transcription
 WCE C N M H 2 O 2 : p(s1981) 2 2 LDH Lamin A/C β-integrin c b d AT Flag- WT Flag- RQ H 2 O")
 p (S1")


 Subcellular fractionation of Zellweger (GM13267) fibroblasts demonstrating the localization of phospho- (S1981)")
, nuclear (N) and membrane (M) fractions,")
 AT (GM05849) fibroblasts were transfected with either wild type (WT) or peroxisome localization-deficient R3047Q")


 Frequency of γ-h2ax foci in AT cells (AT5, GM05849) and HepG2 cellssi at different time points post irradiation")
 Representative figures of γ-h2ax foci.")

1 DOI: /ncb3230 a GM13267(ZW) WCE C N M H 2 O 2 : p(s1981) 2 2 LDH Lamin A/C β-integrin c b d AT Flag- WT Flag- RQ H 2 O 2 IgG p (S1981) p (S1981) 2 IP: Flag N.S. 2 e f A: Untreated AT5 cells B: AT5 WT cells after 30 min of postirradiation C: AT5 cells after 30 min of postirradiation g D: AT5 cells after 180 min of postirradiation E: AT5 WT cells F: AT5-R3047Q cells after 180 min of postirradiation after 180 min of postirradiation h Supplementary Figure 1 Response of RQ mutant to oxidative and DNA damage. (a) Subcellular fractionation of Zellweger (GM13267) fibroblasts demonstrating the localization of phospho- (S1981) and in response to H 2 O 2 (0.4 mm, 1 h) in the indicated subcellular compartments. LDH, Lamin A/C and β-integrin were used as markers for cytosol (C), nuclear (N) and membrane (M) fractions, respectively. WCE, whole cell extract. (b) AT (GM05849) fibroblasts were transfected with either wild type (WT) or peroxisome localization-deficient R3047Q (RQ) mutant Flag-tagged and treated with H 2 O 2 (0.4 mm) for 1 h. was immunoprecipitated using anti- Flag antibody and activation determined using phosphoserine S1981 specific antibody. (c and d) kinase assay with MR complex, Nbs1, and DNA were performed with 0.2 nm dimeric, nm GST-p53 substrate, 96 nm MR, 195 nm Nbs1, and 140 nm linear double stranded DNA. Phosphorylation of was detected by SDS-PAGE and western blotting with an antibody to p53 phospho-ser. (e) Frequency of γ-h2ax foci in AT cells (AT5, GM05849) and HepG2 cellssi at different time points post irradiation of 2 Gy. cells were analyzed for each time point in each experiment (Mean ±s.d., n = 3 independent experiments, student s t ). The mean number of foci is plotted against time. * P < 0.05, ** P < (f) Representative figures of γ-h2ax foci. A: Untreated cells; B: AT5 (GM05849) cells 30 min post irradiation; C: AT5 cells 30 min post irradiation; D: AT5 cells 180 min post irradiation; E: AT5 cells 180 min post irradiation; F: AT5-R3047Q cells 180 min post irradiation. Scale bar, 10 μm (g) Representative images of chromosome aberrations at metaphase. A: AT5 control metaphase; B: AT5 showing dicentric (big arrow) and breaks (small arrow); C: AT5 showing radials (big arrow) and breaks (small arrow); D: AT5-R3047Q showing radials (big arrow) and breaks (small arrow) (h) Chromosome aberrations at metaphase post irradiation of 3 Gy in AT cells (AT5, GM05849) and HepG2 cells si. For each group metaphases were scored in each experiment (mean ±s.d., n = 3 independent experiments, student s t ). ** P < Uncropped images of western blots are shown in Supplementary Fig. S9. Statistical source data for Supplementary Fig. S1e,h can be found in Supplementary Table Macmillan Publishers Limited. All rights reserved
2 Fold change SUPPLEMENTARY INFORMATION a b Ehhadh on FAO Cells Treated with Clofibrate Acca1 on Fao Cells Treated with clofibrate * 10 5 Fold Change Control Clofibrate 48hr 0 Control Clofibrate 48hr c time ACAA1 EHDH 0 FAO cells treated with Clofibrate at 0. mm (hrs) d MCF7-GFP-LC3 cells treated with clofibrate at 0. mm time p- (S1981) 2 2 p-ampk (T172) AMPK p-acc (S79) ACC 2 2 e GFP-LC3 DMSO GFP-LC3 Clofibrate f Clofibrate Time (hr): p- (S1981) p-ampk AMPK p-acc ACC ps6k S6K ps6 S6 p4ebp1 4EBP1 p-ulk1 (S7) p-ulk1 (S317) ULK1 LC g p-s6k S6K p-s6 S6 LC3-I LC3-II p-s6 S6 MEFs TSC2 / TSC2 -/- Clofibrate (mm) TSC2 1 h Baf A1: Clofibrate: LC3 Supplementary Figure 2 Peroxisomal activation of signaling to AMPK- TSC2 to repress mtorc1 and induce autophagy. (a) FAO cells treated with clofibrate (0. mm) for 48 h activated PPARα to increase the mrna level of EHDH by RT-PCR analysis. The data shown is representative of two independent experiments. (b) FAO cells treated with clofibrate (0. mm) for 48 h activated PPARα to increase the ACAA1 mrna levels as demonstrated by RT-PCR analysis. (mean ± s.d., n = 3 independent experiments, Student s t ). * P < 0.05, ** P < (c) Western analysis of FAO cells treated with clofibrate at 0. mm for indicated times with ACAA1 and EHDH antibodies. (d) MCF7 cells stably transfected with GFP-LC3 were treated with clofibrate (0. mm) for indicated times, and activation of -AMPK- TSC2 signaling and induction of autophagy monitored by western analysis using p (S1981),, pampk (T172), AMPK, pacc (S79), ACC, ps6k (T389), S6K, ps6 (S235/236), S6, and LC3. (e) Representative images of GFP-LC3 puncta from MCF7 cells stably expressing GFP-LC3 and treated with clofibrate (0. mm) for 6 h. Scale bar, 10 μm. (f) HepG2 cells treated with 1 mm clofibrate for indicated times, were monitored for -AMPK-TSC2 signaling, suppression of mtorc1, and induction of autophagy by western analysis using p (S1981),, pampk (T172), AMPK, pacc (S79), ACC, ps6k (T389), S6K, ps6 (S235/236), S6, p4e-bp1 (T/46), 4E-BP1, pulk1 (S7), pulk1 (S317), ULK1, and LC3. (g) TSC2 / and TSC2 - /- MEF cells were treated with clofibrate for 6 h at the indicated doses, and suppression of mtorc1 monitored by western analysis using ps6 (235/236), and S6. (h) Western analysis of FAO cells pre-incubated in the presence or absence of Bafilomycin A1 (Baf A1, 0 nm) for 1 h before treatment with 1 mm clofibrate for 3 h using anti- and LC3-II antibodies. Uncropped images of western blots are shown in Supplementary Fig. S9, statistic source data for Supplementary Fig. S2a,b can be found in Supplementary Table Macmillan Publishers Limited. All rights reserved
 d: Clofibrate (24 hrs) 0.2µm 0.")


 (c) vehicle 24 h, (d) clofibrate 24 h (0.")
, and (f) clofibrate 72 h (0. mm). Scale bar, 0.5 μm.")

3 a: Vehicle (6 hrs) b: Clofibrate (6 hrs) 0.2µm c: Vehicle (24 hrs) d: Clofibrate (24 hrs) 0.2µm 0.2µm e: Clofibrate (48 hrs) f: Clofibrate (72 hrs) Supplementary Figure S3 Pexophagy in FAO cells with clofibrate. Representative electron microscopy images of FAO cells treated with vehicle or clofibrate. (a) vehicle 6 h, (b) clofibrate 6 h (1 mm) (c) vehicle 24 h, (d) clofibrate 24 h (0. mm), (e) clofibrate 48 h (0. mm), and (f) clofibrate 72 h (0. mm). Scale bar, 0.5 μm. Autophagosomes containing peroxisomes are represented by yellow arrows and shown enlarged in the boxed area (Scale bar, 0.2 μm). 3 Macmillan Publishers Limited. All rights reserved
: PPLSQETF CHK2 (65-72): TVSTQELY BRCA1(21-28): NYPSQEEL consensus motif: B*XB*-S/TQZ* (B*: Hydrophobic amino acids) (Z*: Negatively charged amino acids) p-(s/t) substrates Ab IP: p")
4 a c ScanSite: PhosphoSite: WT AT Fibroblast Fibroblast IgG - WT H 2 O 2 b : Human ( ): TDWSQEFI Mouse: TDWSQEFI Rat: TDWSQEFI Rabbit: TDWSQEFI Pig: TDWSQEFI Chicken: ADWSQEFI Horse: TDWSQEFI p53 (12-19): PPLSQETF CHK2 (65-72): TVSTQELY BRCA1(21-28): NYPSQEEL consensus motif: B*XB*-S/TQZ* (B*: Hydrophobic amino acids) (Z*: Negatively charged amino acids) p-(s/t) substrates Ab IP: p (S1981) 2 2 Supplementary Figure S4 contains S*/T*Q phosphorylation motif. (a) Prediction of phosphorylation site and ubiquination site by ScanSite and PhosphoSite. (b) Conserved S141 ( phosphorylation site) sequence in. (c) WT fibroblasts (GM08399) and AT fibroblasts (GM05849) were transfected with --WT and treated with H 2 O 2 for 1 h. The complex was immunoprecipitated with anti- and immunoblotted with phospho-(s/t) substrate antibody. s were immunoblotted using the indicated antibodies. Uncropped images of western blots are shown in Supplementary Fig. S Macmillan Publishers Limited. All rights reserved
 2 2 p (S1981) 2 2 e sipex2/10/12 --WT -UB H 2 O 2 IgG d sirna: IgG CT CT PEX2 0 CT 2 H 2 O 2 PEX2 0 2 IP: Ub IP: p (S1981) 2 2 p (S1981) 1.5 1 0.")
 HEK293 cells expressing --WT or mutants (K28R, K52R, K170R, K4R, K9R, K292R) and -Ub constructs were co-immunoprecipitated using anti- and blotting with an anti- antibody.")
 WT (GM08399) and AT (GM05849) fibroblasts were treated with H 2 O 2 for 6 h and immunoprecipitated with anti- and immunoblotted with anti-ub antibodies.")
 HEK 293 cells were transfected with SiRNA for PEX2, 0 and 2, and treated with H 2 O 2 for 6 h.")
 HEK293 cells transfected with - -WT/--K9R and -Ub constructs for 24 h following a prior sirna knockdown of PEX2/10/12 for 48 h were immunoprecipitated with anti- and immunoblotted with")
5 Fold change of PEX2 mrna Fold change of 0 mrna Fold change of 2 mrna SUPPLEMENTARY INFORMATION a -Pex5 IgG -UB: WT K28R K52R K170R K4R K292R K9R b IgG WT AT H 2 O 2 c si --WT -UB H 2 O 2 IgG Ub IP: IP: IP: p (S1981) 2 2 p (S1981) 2 2 e sipex2/10/12 --WT -UB H 2 O 2 IgG d sirna: IgG CT CT PEX2 0 CT 2 H 2 O 2 PEX2 0 2 IP: Ub IP: p (S1981) 2 2 p (S1981) Si-CT CT H 2 O 2 Si-PEX CT H 2 O 2 Si-CT Si Si-CT CT H 2 O 2 Si-2 Supplementary Figure S5 ROS-induced ubiquitination is dependent. (a) HEK293 cells expressing --WT or mutants (K28R, K52R, K170R, K4R, K9R, K292R) and -Ub constructs were co-immunoprecipitated using anti- and blotting with an anti- antibody. lysates were immunoblotted using the indicated antibodies. (b) WT (GM08399) and AT (GM05849) fibroblasts were treated with H 2 O 2 for 6 h and immunoprecipitated with anti- and immunoblotted with anti-ub antibodies. lysates were immunoblotted using the indicated antibodies. (c) HEK293 cells transfected with --WT and -Ub for 24 h following a prior sirna knockdown of for 48 h, were treated with H 2 O 2 for 6 h and immunoprecipitated with anti- and immunoblotted with anti- antibodies. lysates were immunoblotted using the indicated antibodies. (d) HEK 293 cells were transfected with SiRNA for PEX2, 0 and 2, and treated with H 2 O 2 for 6 h. Immunoprecipitation was performed with an anti- antibody followed by immunoblotting for endogenous ubiqintin. RT- PCR was performed to confirm sirna knockdown of, 0 and 2. (e) HEK293 cells transfected with - -WT/--K9R and -Ub constructs for 24 h following a prior sirna knockdown of PEX2/10/12 for 48 h were immunoprecipitated with anti- and immunoblotted with anti- antibodies. lysates were immunoblotted using the indicated antibodies. Uncropped images of western blots are shown in Supplementary Fig. S Macmillan Publishers Limited. All rights reserved

 2 2 c IP: --WT --K9R - IgG IP:")


. Scale bar, 10 μm.")

 HEK293 cells were transfected with - -WT")


6 a FIP0 Merge/DAPI Control FIP0 Merge/DAPI H 2 O 2 ATG16L1 Merge/DAPI Control ATG16L1 Merge/DAPI H 2 O 2 b --WT - H 2 O 2 (Time:hr) IgG p (S1981) 2 2 c IP: --WT --K9R - IgG IP: Supplementary Figure S6 K9 is responsible for interaction with in response to ROS. (a) Representative image of HepG2 cells treated with or without H 2 O 2 for 3 h and immunostained for FIP0 or ATG16L (green) and peroxisomal marker (red). Scale bar, 10 μm. High-magnification images of boxed areas showed co-localization between FIP0 or ATG16L and (Scale bar, 3 μm). (b) HEK293 cells were transfected with - -WT and-, and treated with 0.4 mm of H 2 O 2 for indicated times. The complex of - and - was immunoprecipitated with anti- and immunoblotted with anti-. s were immunoblotted using the indicated antibodies. (c) HEK293 cells were transfected with - and --WT or --K9R. The complex of - and - was immunoprecipitated with anti- and immunoblotted with anti- antibodies. lysates were immunoblotted using the indicated antibodies. Uncropped images of western blots are shown in Supplementary Fig. S Macmillan Publishers Limited. All rights reserved


 Western analysis of HepG2 cells pre-incubated in the presence or absence of Bafilomycin A1 (Baf A1, 0 nm) for 1 h before treatment with 0.")
7 Fold change of or 14/ puncta per cell Fold change of or 14/ SUPPLEMENTARY INFORMATION a GFP-LC3 DsRed-SKL Merge/DAPI H 2 O 2 30min H 2 O 2 60min b H 2 O 2 Baf A1 (light) (dark) LC3-I LC3-II p (S1981) c 1.8 NS * *** *** ** ** H 2 O 2 Baf A1 d H 2 O 2 WCE P Baf A1: si p(s141) 2 1 p Catalase (S1981) 2 2 i AT Flag--WT Flag--KD H 2 O 2 Flag p(s1981) e 1 2 j 2 Si PEX2/10/12 H 2 O 2 p(s1981) f NS NS NS NS *** ** H 2 O 2 si P g WT AT Control H2O2 h CT NS H2O2 *** WT AT Supplementary Figure S7 Regulation of pexophagy by ROS is dependent. (a) Frame capture from time course imaging of pexophagy in live RPE cells stably expressing GFP-LC3 and DsRed-SKL following H 2 O 2 (0.4 mm) treatment. Scale bar, 10 μm. (b) Western analysis of HepG2 cells pre-incubated in the presence or absence of Bafilomycin A1 (Baf A1, 0 nm) for 1 h before treatment with 0.4 mm H 2 O 2 for 3 h using anti-, anti-, anti- and LC3-II antibodies. (c) Quantification of and intensity normalized to from Fig. S7b (mean ± s.d., n = 3 independent experiments, Student s t ). * P < 0.05, ** P < 0.01, *** P < 0.001, NS= not significant. (d) Western analysis of whole cell extracts (WCE) and peroxisome fractions (P) of HepG2 cells treated with Baf A1 (0 nm) for 4 h immunoblotted using anti-, anti-p(s141) and antibodies. (e) Western analysis of HepG2 cells transfected with or without si for 72 h and treated with 0.4 mm H 2 O 2 for 3 h using anti-, anti-, anti-p, anti-, anti- and LC3-II antibodies. (f) Quantification of and intensity normalized to from Fig. S7e (mean ± s.d., n = 3 independent experiments, Student s t ). ** P < 0.01, *** P < 0.001, NS= not significant. (g) Representative images of wild type (WT, GM08399) and ataxia telengiectasia (AT, GM05849) patient fibroblasts treated with H 2 O 2 for 6h, and immunostained with antibody. Scale bar, μm. (h) Quantification of puncta per cell was performed from Fig. S7g from n = 4 independent experiments, cells were analyzed in each experiment. All error bars represent s.d., (Student s t ) *** P < 0.001, NS= not significant. (i) Western analysis of AT (GM05849) fibroblasts transfected with Flag- WT or Flag- KD (kinase dead) mutant and treated with 0.4 mm H 2 O 2 for 6 h using anti-, anti-, anti-p, anti-flag and antibodies. (j) Western analysis of HEK293 cells transfected with Pex2/10/12 sirna for 72 h and treated with H 2 O 2 (0.4 mm) for 6 h using anti-, anti-, antip, and antibodies. Uncropped images of western blots are shown in Supplementary Fig. S9. Statistic source data for Supplementary Fig. S7 c, f, h can be found in Supplementary Table Macmillan Publishers Limited. All rights reserved
 d: H2O2 (6 hrs) Supplementary Figure S8")

 Vehicle 6 h, (b,c and d) H 2 O 2 6 h (0.4 mm). Scale bar, 0.")

8 0.µm a: Vehicle (6 hrs) b: H2O2 (6 hrs) 0.µm 0.µm c: H2O2 (6 hrs) d: H2O2 (6 hrs) Supplementary Figure S8 Pexophagy in HepG2 cells with H 2 O 2. Representative electron microscopy images of HepG2 cells treated with vehicle or H 2 O 2. (a) Vehicle 6 h, (b,c and d) H 2 O 2 6 h (0.4 mm). Scale bar, 0.5 μm. Autophagosomes containing peroxisome are represented by yellow arrows, and shown enlarged in the boxed area (Scale bar, 0. μm). 8 Macmillan Publishers Limited. All rights reserved


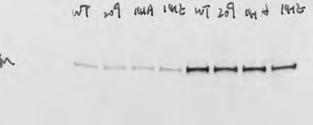
9 1a 2 1a LDH 1a Lamin A/C 1a β-integrin 1a Catalase 1a 2a p(s1981) 2a 2a 2a p(s1981) 2a 2a c 1b 1b Catalase 1b Flag- 2c Catalase 2d 2d Flag 2d 2d Flag 2d c p(s1981) 1c 1c 3d p(s1981) 3d 3d ps6k 3d S6K 3d ps6 3d S6 1c Catalase 3c p(s1981) 3c 3c 3c Catalase d p4ebp1 3d 4EBP1 3d Supplementary Figure S9 Uncropped images of all the western blots. 9 Macmillan Publishers Limited. All rights reserved
 3e")


 4a 4b p sub")


10 3e pampk 3e AMPK 3e 3e 3e pacc ACC pulk1(s7) 3e pulk1(s317) 3e ULK1 3e 4b p sub dark 4b b 1 4b p(s1981) 4b 2 1 3f 3f ps6k 3f S6K 3f 3f 3f 3f ps6 S6 p4ebp1 4EBP1 3f 4c 4c 4c 2 1 Supplementary Fig. S9 con?nued 2 1 p sub light p sub dark 3g light 3g 3g 3g dark LC3-II light LC3-II dark 3g 4a p sub light 4a p sub dark c 4c a 4a 4a p(s1981) 4a 4b p sub light p(s1981) 4c Supplementary Figure S9 continued 10 Macmillan Publishers Limited. All rights reserved


11 11 Supplementary Fig. S9 con?nued p(s1981) p(s141) d 4d 4d 4d 4d 4e 4e 4e 4e 4e p(s1981) p(s141) a 5a 5a 5a p(s1981) 5b 5b 5b 5b 5b d 5d 5d 5d 5d (light) (dark) p(s1981) 5e 5e 5e 5e 5e 5e 1 5b 2 1 5a p(s1981) 2 1 5a p(s1981) p(s141) 4f 4f 4f 4f 4f Supplementary Figure S9 continued Macmillan Publishers Limited. All rights reserved
")


 6f")
 6f")

")


12 6a 6e 6f 6a 6a 6a 6a p(s1981) 6a 6c 6c 6c Catalase e 6e 6e 6e Catalase p(s1981) (light) 6f (dark) 6f 6f 6f 6f p(s1981) 6f a 7a 7a SD 7a 7a VDAC 2 1 7a LC3 7a 7a p(s1981) 7a e 7e 7e p(s1981) 7e Supplementary Fig. S9 con?nued Supplementary Figure S9 continued 12 Macmillan Publishers Limited. All rights reserved


13 g 7g 7g 7g p(s1981) S1a S1a S1a S1a S1a p(s1981) LDH Lamin A/C β-integrin S1b S1b S1b p(s1981) p(s1981) S2c S2c S2c LC3 ACAA1 EHDH p(s1981) pampk(t172) AMPK pacc(s79) ACC ps6k S6K ps6 S6 7g 7e 7e 7e 7e p-p53(s) p-p53(s) S1c S1d Supplementary Figure S9 continued Macmillan Publishers Limited. All rights reserved


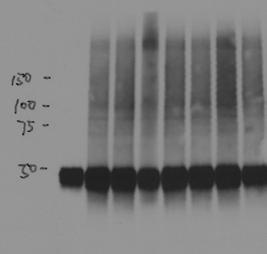


14 ps6 S6 TSC2 S2g S2g S2g S2g LC3 pulk1(s7) pulk1(s317) ULK1 p4ebp1 4EBP1 ps6k S6K ps6 S6 ACC pacc pampk AMPK p(s1981) light 10 S2h S2h S2h LC3 1 1 S4c S4c p sub S4c S4c S4c p(s1981) S5a S5a S5a S5a Supplementary Figure S9 continued Macmillan Publishers Limited. All rights reserved


15 p(s1981) Ub S5b S5b S5b S5b S5b Supplementary Fig. S9 con?nued S5c S5c S5c S5c S5c S5c p(s1981) p(s1981) Ub S5d S5d S5d p(s1981) S5e S5e S5e S5e S5e S5e S6b S6b S6b S6b p(s1981) S6b S6b S6c S6c S6c S6c Supplementary Figure S9 continued Macmillan Publishers Limited. All rights reserved
 S7b S7b 2 1 10 2 1 2 1 S7d S7d")
 S7e S7e 2 1 2 1 2 1 S7i S7i S7i")
 S7j 2 1 S7j 2 1 Supplementary")

16 S7b S7b S7b (light) S7b (dark) S7b LC3 S7b p(s1981) S7b S7b S7d S7d p(s141) S7d S7d Catalase S7d 2 1 S7e S7e S7e S7e p(s1981) S7e S7e S7i S7i S7i Flag S7i p(s1981) S7i S7j S7j 2 1 S7j p(s1981) S7j 2 1 S7j 2 1 Supplementary Figure S9 continued 16 Macmillan Publishers Limited. All rights reserved
17 STATISTICS CHECKLIST TO BE SUBMITTED WITH REVISION Figure Panel Test S.D or n value independent experiments or (optional) p (optional) if n<5, values provided? S.E.M technical replicates values provided and defined? yes Figure 2f Student's t- S.D. 3 independent independent experiments % cytosolic localization: experiments, WT control (10, 12, 12); cells analyzed in WT H2O2 (19, 19, 23); each experiment RQ control (8, 5, 4); RQ H2O2 (6, 7, 5) Figure 3b 2 independent experiemnts independent experiments Fold change in ROS: Control defined as 1; mm TBHP (6.52, 5.); 0. mm Clofibrate (2.09, 2.29); 0.5 mm Clofibrate (3.11, 3.02); 1 mm Clofibrate (4.41,4.49); Figure 7b Student's t- S.D. Figure 7d Student's t- S.D. 3 independent independent experiments yes Fold change of /: experiemnts Control (without H 2O 2) ratio defined as 1; H2O2 1h (0.64, 0.57, 0.63); H2O2 3h (0.55, 0.53, 0.61); H2O2 6h (0.41, 0.34, 0.52); CCCP 6h (1.09, 0.81, 0.94); Fold change of /: Control (without H2O2) ratio defined as 1; H2O2 1h (0.66, 0.44, 0.77); H2O2 3h (0.41, 0.46, 0.38); H2O2 6h (0.41, 0.29, 0.38); CCCP 6h (0.87, 0.97, 0.99); 4 independet independent experiments yes mrfp/egfp-skl Colocalization experiments, 10 (Pearon's correlation coefficient): cells were Control (0.9361, , , ); analyzed in each H2O2 6h (0.8239, , , ); experiemnt Figure 7f Student's t- S.D. Figure 7i Student's t- S.D. Supplementary Figure S1e Student's t- S.D. Supplementary Figure S1h Student's t- S.D. 4 independent independent experiments yes Fold change of /: experiments WT without H2O2 ratio defined as 1; WTH2O2 (0.57, 0.54, 0.54, 0.62); K9R without H2O2 (1.02, 1.08, 1.12, 0.78); K9RH2O2 (0.72, 1.05, 0.91, 0.91); S141A without H2O2 (1.01, 1.14, 0.98, 1.01); S141AH2O2 (0.66, 1., 0.84, 0.76); S141E without H2O2 (0.97, 0.97, 0.95, 0.83); S141EH2O2 (0.49, 0.26, 0.44, 0.57); Fold change of /: WT without H2O2 ratio defined as 1; WTH2O2 (0.57, 0.54, 0., 0.39); K9R without H2O2 (1.54, 1.03, 1.19, 0.86); K9RH2O2 (0.76, 0.88, 1.02, 0.78); S141A without H2O2 (1., 0.88, 1.0, 0.98); S141AH2O2 (0.57, 0.97, 0.92, 0.61); S141E without H2O2 (0.84, 0.95, 1.04, 0.98); S141EH2O2 (0.11, 0.33, 0.44, 0.35); 3 independent independent experiments yes mrfp/egfp-skl Colocalization experimenst, 10 (Pearon's correlation coefficient): cells were WT fibroblast Control (0.96, , ); analyzed in each WT fibroblast H2O2 6h (0.77, 0.88, ); experiment AT fibroblast Control (0.9480, , 0.95); AT fibroblast H2O2 6h (0.9366, , ); 3 independent independent experiments yes γ-h2ax foci per cell: experiments, AT5 0 min (4, 6, 5); cells were AT5 10 min (9, 14, 13); analyzed in each AT5 30 min (31, 38, 39); experiment AT5 1 min (35, 31, 33); AT5 240 min (28, 24, 26); AT5 0 min (4, 3, 2); AT5 10 min (34, 41, 36); AT5 30 min (55, 46, 49); AT5 1 min (24, 18, 21); AT5 240 min (8, 12, 10); AT5 R3047Q 0 min (6, 2, 4); AT5 R3047Q 10 min (32, 29, 38); AT5 R3047Q 30 min (42, 53, 46); AT5 R3047Q 1 min (26, 18, 22); AT5 R3047Q 240 min (11, 11, 14); HepG2 0 min (3, 4, 5); HepG2 10 min (35, 28, 33); HepG2 30 min (45, 51, 42); HepG2 1 min (18, 22, 26); HepG2 240 min (11,, 13); HepG2-siRNA 0 min (5, 6, 7); HepG2-siRNA 10 min (11, 13, 18); HepG2-siRNA 30 min (29, 35, 32); HepG2-siRNA 1 min (27, 31, 32); HepG2-siRNA 240 min (, 30, 26); HepG2-siRNA R3047Q 0 min (4, 5, 6); HepG2-siRNA R3047Q 10 min (28, 30, 35); HepG2-siRNA R3047Q 30 min (49, 56, 51); HepG2-siRNA R3047Q 1 min (, 29, 23); HepG2-siRNA R3047Q 240 min (9, 14, 13); 3 independent independent experiments yes Aberrations/metaphase: experiments, AT5 0 Gy (0.38, 0.42, 0.4); metaphase for AT5 3 Gy (3.9, 4.4, 4.3); analyzed in each AT5 0 Gy (0.1, 0.3, 0.2); experiment AT5 3 Gy (1.1, 1.5, 1.6); AT5 R3047Q 0 Gy (0.2, 0.26, 0.24); AT5 R3047Q 3 Gy (1.3, 1.7, 1.8); HepG2 0 Gy (0, 0.2, 0.1); HepG2 3 Gy (1.2, 1.5, 1.2); HepG2-siRNA 0 Gy (0.31, 0.36, 0.38); HepG2-siRNA 3 Gy (3., 3.8, 4.0); HepG2-siRNA R3047Q 0 Gy (0.1, 0.3, 0.1); HepG2-siRNA R3047Q 3 Gy (1.4, 1.52, 1.43); Supplementary Figure S2a 2 independent experiments, data shown is represntative independent experiments Fold change of EHDH mrna: Control (without Clofibrate) ratio defined as 1; Clofibrate 48h (19.97, 16.), Supplementary Figure S2b Student's t- S.D. 3 independent experiments independent experiments yes Fold change of ACAA1 mrna: Control (without Clofibrate) ratio defined as 1; Clofibrate 48h (1.71, 1.58, 1.13), Supplementary Figure S7c Student's t- S.D. Supplementary Figure S7f Student's t- S.D. Supplementary Figure S7h Student's t- S.D. 3 independent independent experiments yes Fold change of /: experiments Control (without H 2O 2) ratio defined as 1; H2O2 (0.61, 0.72, 0.56); Baf A1 (1., 1.23, 1.24); H2O2Baf A1 (1.73, 1.32, 1.19); Fold change of /: Control (without H2O2) ratio defined as 1; H2O2 (0.82, 0.62, 0.64); Baf A1 (1.12, 1.17, 1.); H2O2Baf A1 (1.31, 1.26, 1.23); 3 independent independent experiments yes Fold change of /: experiments SiControl (without H2O2) ratio defined as 1; SiControlH2O2 (0.36, 0.53, 0.39); Si (1.35, 0.92, 1.08); SiH2O2 (0.98, 0.91, 0.80); Fold change of /: SiControl (without H2O2) ratio defined as 1; SiControlH2O2 (0.59, 0.38, 0.34); Si (1.02, 0.9, 1.01); SiH2O2 (1.12, 0.88, 0.98); 4 independent independent experiments yes puncta per cell: experiments, WT fibroblast control (464, 580, 563, 569) cells were WT fibroblast H2O2 6h (3, 346, 410, 381) analyzed in each AT fibroblast control (665, 647, 5, 644) experiment AT fibroblast H2O2 6h (626, 807, 6, 676) Supplementary Table 1 Source data table. Details of all the quantitative raw data values, sample size and the statistical applied Macmillan Publishers Limited. All rights reserved
18 Supplementary video legends Supplementary Video 1 Formation of autophagosomes over peroxisome. RPE cells stably expressing GFP-LC3 and DsRed-SKL and treated with H 2 O 2 (0.4 mm, from 30min to 3hr) imaged by time-lapse microcopy. Supplementary Video 2: Induction of pexophagic flux with H 2 O 2. MCF7 cells transfected with mrfp-egfp-skl and treated with H 2 O 2 (0.4 mm, from 30min to 3hr) imaged by time-lapse microcopy Macmillan Publishers Limited. All rights reserved