Supplementary Figure 1. Electron microscopy of gb-698glyco/1g2 Fab complex. a)
|
|
|
- Marilyn Jacobs
- 5 years ago
- Views:
Transcription
 2D class averages of redissolved crystals of Subtilisin E-treated gb-698glyco/1g2.")
1 Supplementary Figure 1. Electron microscopy of gb-698glyco/1g2 Fab complex. a) Representative images of 2D class averages of gb-698glyc bound to 1G2 Fab. Top views of the complex were underrepresented compared to the side views. b) 2D class averages of redissolved crystals of Subtilisin E-treated gb-698glyco/1g2. Crystals of deglycosylated gb-698glyco/1g2 grown in the presence of a 1:1000 ratio of Subtilisin E were looped out of the crystal solution, washed three consecutive times in reservoir buffer (0.1M MMT ph 8.4, 12% PEG-1500, 5% glycerol) and dissolved in 25 mm Tris ph 7.5, 150 mm NaCl for visualization through EM as described in Materials and Methods. 2D class averages of side and top view of the complex are shown.
2 Contd.
 domain III helix αc; b) Asn208 and its linked N-acetyleglucosamine; c) the three-fold")
 and f) Stereo images of 2 Fo - Fc electron density maps contoured to 2σ.")
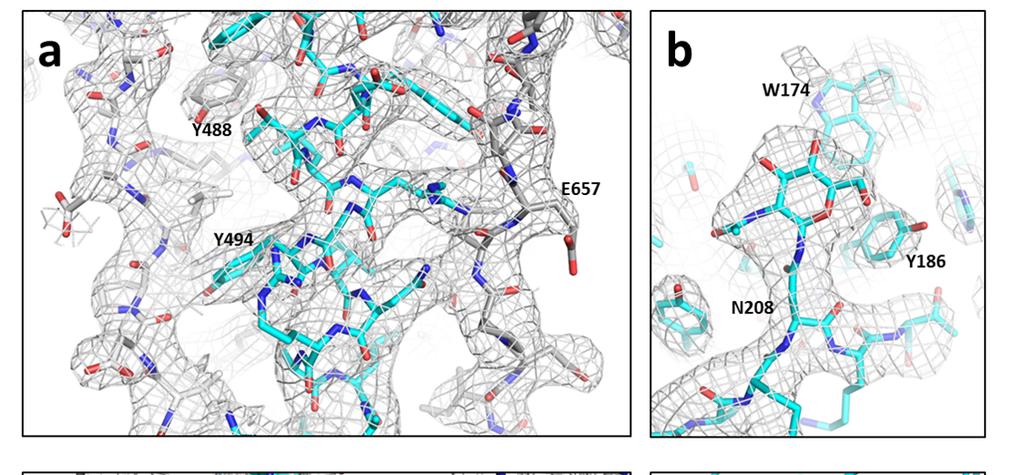
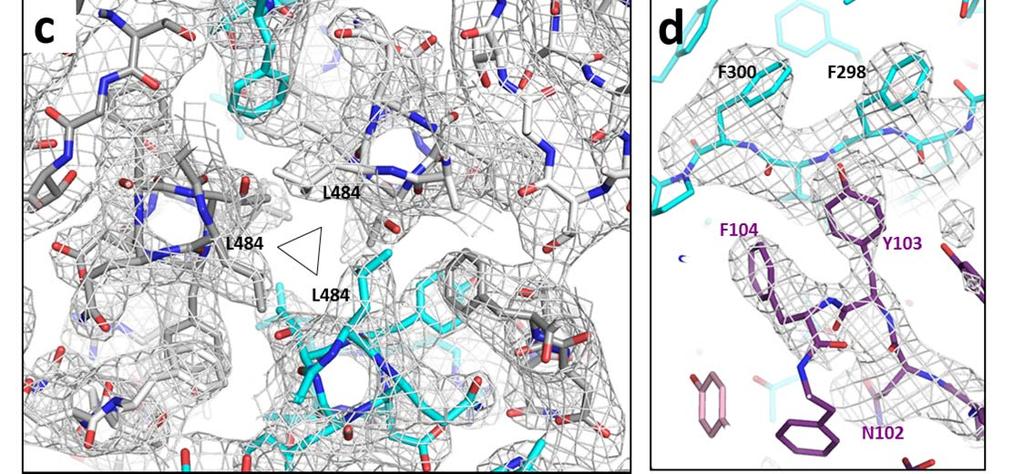
3 Supplementary Figure 2. Electron density maps for the ΔNgB-glyco/1G2 structure. 2 Fo - Fc electron density map contoured to 2σ along: a) domain III helix αc; b) Asn208 and its linked N-acetyleglucosamine; c) the three-fold axis with a top view around Leu484; d) Fo - Fc kicked omit map for gb residues Phe297-Phe300 and 1G2 heavy chain residues Asn102-Phe104 contoured to 3σ; e) and f) Stereo images of 2 Fo - Fc electron density maps contoured to 2σ. Electron density maps are shown as a mesh around gb residues in stick representation. All images were created in Pymol.
 were superimposed on the corresponding domains in HSV (green) or EBV gb (pink) using LSQKAB in CCP4.")
4 Supplementary Figure 3. Comparison of individual domains of HCMV gb with HSV and EBV gb. Individual domains of HCMV gb (I-V) were superimposed on the corresponding domains in HSV (green) or EBV gb (pink) using LSQKAB in CCP4. The view in I-B is rotated 60 degrees away from the reader from the view in I-A, with the 1G2 epitope boxed in black.
, HSV (b) and EBV (c) gb generated using PyMol, contoured")

5 Supplementary Figure 4. Comparison of surface charge distribution of herpesvirus gb. Surface charge distribution of HCMV (a), HSV (b) and EBV (c) gb generated using PyMol, contoured to -2 to +2 kt/e. Blue represents positive charge and red represents negative. The top and bottom panels are views generated by rotating the view in the middle 90 o towards and away from the reader, respectively.
6 Contd.
7 Contd.

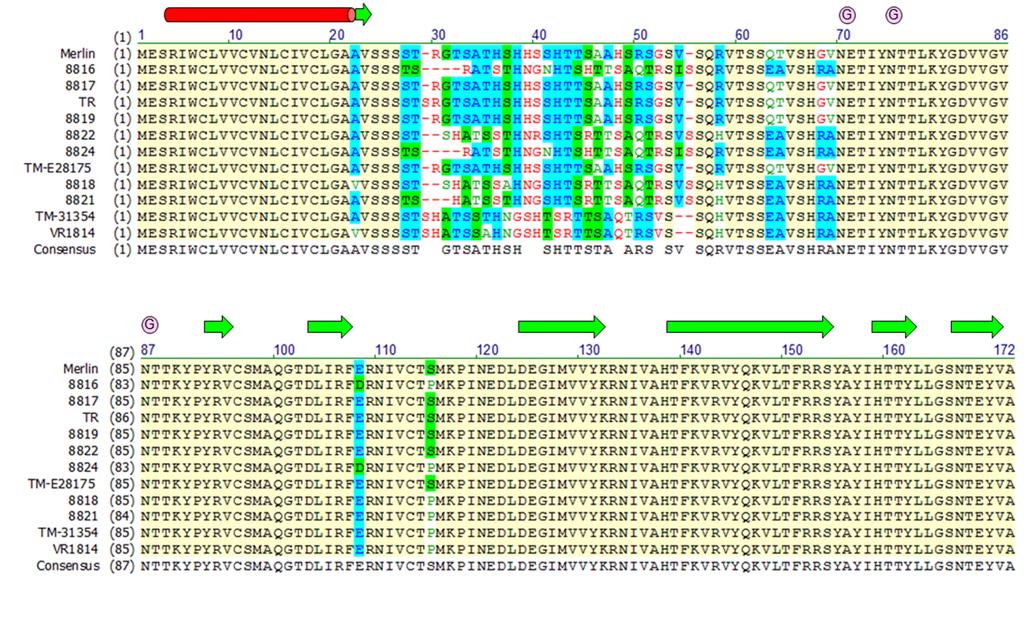
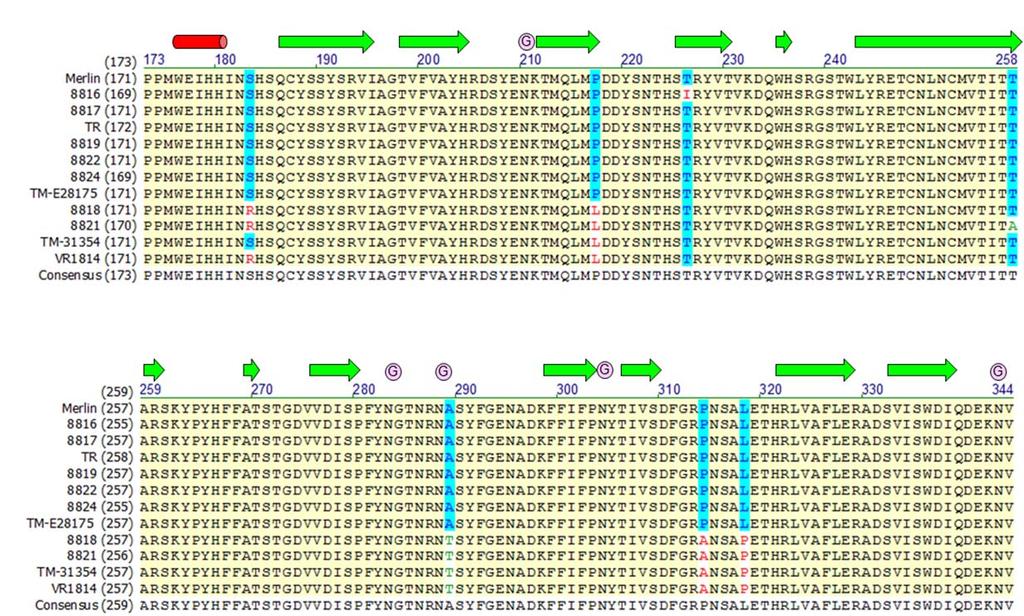
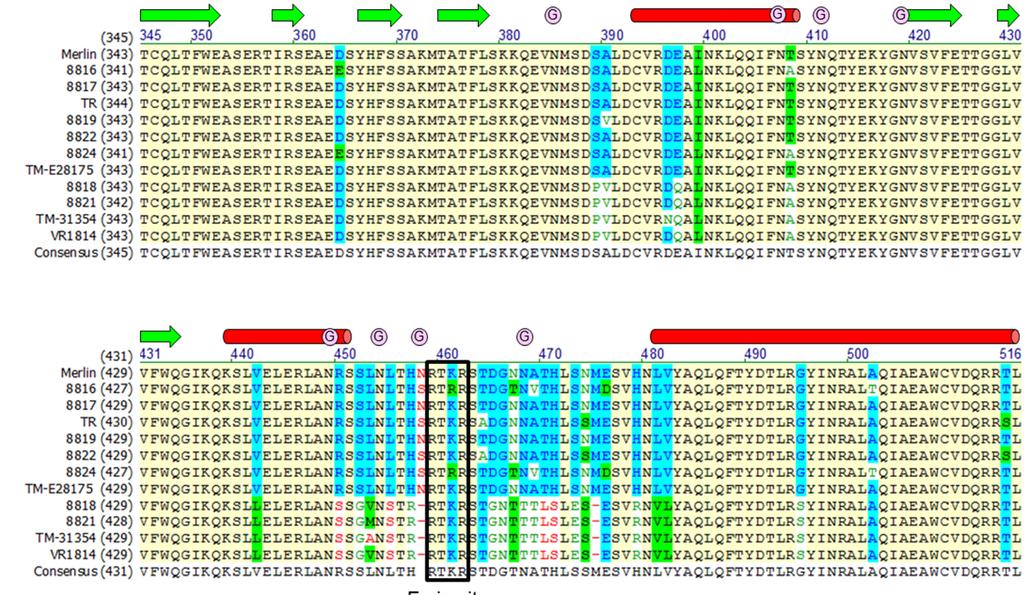
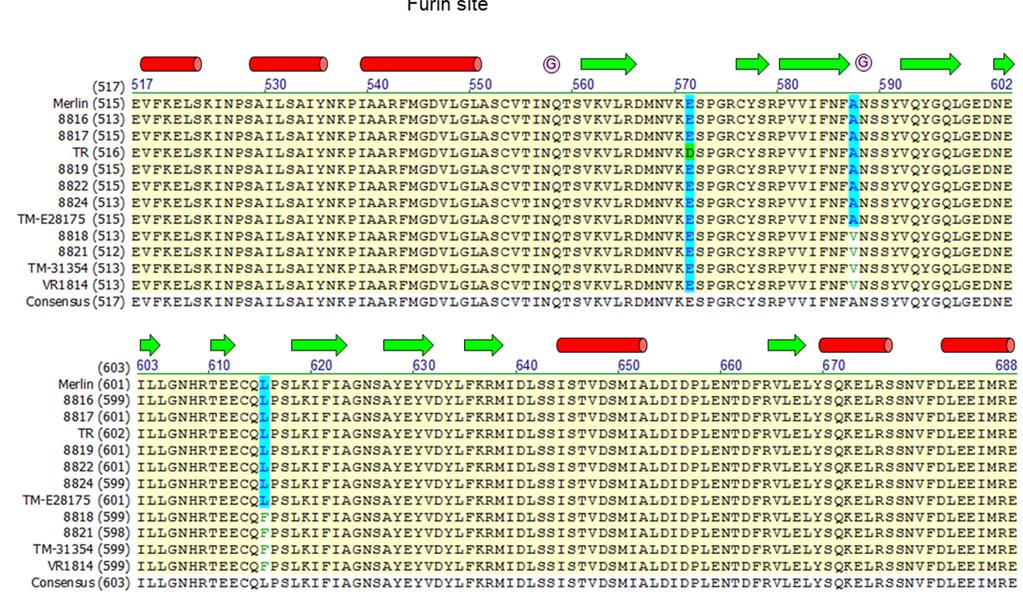
8 Supplementary Figure 5. Sequence alignment of gb from various HCMV strains. Full length gb sequences from 12 strains of HCMV were aligned using AlignX (Vector NTI, Invitrogen Inc.). Secondary structure elements are represented as red cylinders for helices and green arrows for beta sheets, as predicted for the Merlin strain sequence using the JPRED server (University of Dundee).
9 Supplementary Figure 6. Depletion efficiency and specificity of soluble gb, gh/gl and pentamer on human sera. Sera incubated with gb-698glyc, gh/gl or pentamer as described in Table 4 were tested for remaining reactivity to the respective proteins in an ELISA assay. Titers are expressed as a percentage of titers from mock-depleted sera. The x-axis represents the depleting protein. Error bars represent standard deviation across five individual serum samples.

10 Supplementary Figure 7. Western blot for gb immunoprecipitated from purified VR1814 virions. Uncropped gel image for western blot shown in Figure 5B.
11 Supplementary Table 1 RMSD among herpesviruses postfusion gbs gb Domain (residues in CMV gb) 2GUM (HSV gb) 3FVC (EBV gb) 4OSN (CMV gb AD-4 alone) 4OT1 (CMV gb AD-4 SM5 complex) I ( )* II ( ) III ( ) IV (88-103, ) V ( ) * Domain I was aligned defining residue ranges , and HCMV gb domains were individually superimposed onto corresponding domains from HSV or EBV gbs or to the isolated AD-4 domain structures using LSQKAB in the CCP4 suite. The boundaries of the domains are indicated in parentheses. Domain I was defined as residue ranges , and
12 Supplementary Table 2 Contact residues at the gb-1g2 interface Residue in gb Atom Residue in 1G2 Atom Distance (Å) Tyr 280 OH Tyr 103H N 3.28 Gly 282 O Asn 102H OD Tyr 103H O 2.59 Gly 282 C Tyr 103H O 3.39 Asn 102H CG 3.1 O Asn 102H OD Asn 102H ND Thr 283 CA Asn 102H OD C Asn 102H OD1 2.9 CG2 Phe 105H CZ 3.47 OG1 Tyr 50L OH 3.5 CB Trp 101H O 3.38 CG Trp 101H NE CD Trp 101H O 3 Arg 285 CZ Ser 32H OG 3.5 NH1 Ser 32H O 3.38 NH2 Ser 32H O 3.46 Ser 32H OG 2.66 Asn 286 CB Tyr 109H OH 3.05 CG Tyr 109H OH 3.31 Phe 290 CD2 Ser 32H OG 3.27 Gly 291 O Arg 31H NH Glu 292 O Ser 32H CB 3.24 N Arg 31H O 2.61 Ala 294 CA Arg 31H O 3.39 CB Arg 31H O 3.1 O Tyr 103H CE Phe 104H CE Ile 299 Tyr 103H CE N Tyr 103H CZ 3.4 Tyr 103H OH 3.49 CG1 Tyr 103H CD Table of contact residues within a 3.5 Å cutoff was generated using the CONTACT program within the CCP4 suite.
13 Supplementary Table 3. Details of SPR analysis of gb-1g2 interaction gb mutants Sample Rmax (RU) Chi² (RU²) Ligand Level (RU) Max binding (RU) Capture-adjusted max binding ΔNgB-glyco Y280A N281A T283A N284A R285A N286A NRN-AAA* F290A E292A N293A/D295A YND-AAA** F297A F298A I299A F298A/I299A G2 WT R31S S32A G2 N102A heavy Y103A chain F104A Y103A/F104A Y109A G2 Y50A light chain R51A *NRN-AAA = N284A/R285A/N286A **YND-AAA = Y280A/N293A/D295A Rmax, Chi 2, ligand level, max binding level and capture-adjusted max binding level for the single cycle kinetic runs reported in Table 3. While these values are reported for the 1G2 double mutant Tyr103Ala/Phe104Ala, we could not get a reliable fit for the curve for measuring the kinetic constants reported in Table 2.