Swaged Bulkhead Analysis and Verification
|
|
|
- Mitchell Short
- 5 years ago
- Views:
Transcription
1 Swaged Bulkhead Analysis and Verification SDMT Panel Meeting October 2014 Approved for public release; distribution is unlimited (including to foreign countries).

2 Swaged Bulkhead Overview Plate pressed to form bumps at spacing similar to traditional stiffeners Also called swedged, pilaster, or crimped Reduce overall cost of ship design, construction, and life cycle maintenance Reduced part count Decreased welding Improved paint application Better paint adherence Better accessibility 2
 Polish commercial vessel with house exterior swaged bulkheads")
3 Swages Today Mainly used in non-load bearing applications No commonly accepted way of performing analysis No class rules defining a design methodology (ABS, DNV, Lloyds, GL, NAVSEA DDS, or ABS NVR) Polish commercial vessel with house exterior swaged bulkheads 3
4 Project Objectives Provide a body of comprehensive data Comparing calculated and actual strength characteristics Shear, compressive, and out-of-plane loads Develop Finite Element Analysis method allowing for the design of swaged bulkheads High level of reliability achieved for stiffened bulkhead design Lead to use to wide range of applications Perform studies to provide real data on cost savings Comprehensive paint adhesion study Manufacturing cost comparison study 4
5 Project Plan - Phase I Compare stiffened and swaged bulkheads Structural behavior Manufacturing Life cycle costs Aluminum and Steel Swaged, bulb stiffeners, T stiffeners Paint adhesion study Manufacturing cost comparison study Develop finite element analysis methodologies Perform physical testing at Powell Structural Labs, UC San Diego Determine ultimate capacities Compare FEA predictions with testing results 5
6 Project Plan - Phase II Study the effects of geometric and material properties on swage bulkhead analysis Design and Manufacture multiple sets of swaged bulkheads with variations in geometry and material thickness and grade Review and apply FEA methodologies developed in Phase I Perform physical testing at Powell Structural Labs, UC San Diego Compare calculated and actual strength data for each combination of properties. 6

7 Project Plan - Phase III Study the effects of cutouts and penetrations on swage bulkhead analysis Design and Manufacture three sets of swaged bulkheads Cutouts and penetrations Attachments Combination of cutouts and attachments Review and apply FEA methodologies developed in Phase II Perform physical testing Compare calculated and actual strength data 7
8 Expected Benefits of Using Swaged Bulkheads Material Savings Life Cycle Cost Savings Labor Savings Reduced Ship Weight Less Environmental Impact Quantifiable Benefits SWAGED BULKHEADS Expected Benefits Non-Quantifiable Benefits Reduced Bulkhead Depth Improved Safety T-AKE Potential Cost Savings Total Savings of over $2.0 million Reduction in material costs close to $1.0 million Reduction in labor hours of +25,000 Reduction in ship weight by close to 80 MT (per ship) 8
9 Phase I Bulkhead Design and Fabrication 9

10 Phase I Bulkhead Design Bulkheads are designed at NASSCO using method to match section properties Start with stiffened section approved by Class for use on an existing ship Steel bulb stiffened plate from T-AKE Aluminum T stiffened plate from LCS Develop swage geometry with comparable moment of inertia in the x-direction Change size of straight length without changing radius size Ease of fabrication 10

11 Phase I Bulkhead Design Large bulkheads designed for paint adhesion testing at MMC Plates will be added to specimen edges to simulate a true ship environment, acting as decks and perpendicular bulkheads Next, separated into separate specimens for structural testing at UC San Diego Additional material available for measurement of residual stress induced from swaging process 11


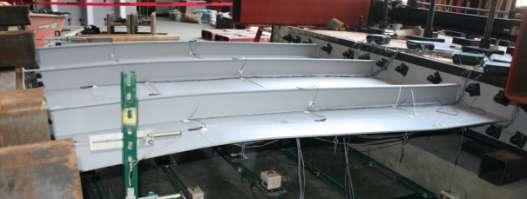
12 Phase I Bulkhead Fabrication at Marinette Marine Corp 12


13 Phase I Bulkhead Fabrication at Marinette Marine Corp 13


14 Phase I Finite Element Analysis Linear and non-linear analyses performed and compared to physical testing results Linear FEA is not reliable post-yield Non-linear FEA provides capability for post-buckling shape and stress comparison 14
15 Phase I Bulkhead Physical Testing 15
16 Phase I Bulkhead Load Profiles Compression Lateral Load/Shear Out-of-Plane/Pressure Loading Type Specimen Designation Compression ST-B-C ST-S-C AL-B-C A-S-C Lateral Loading AL-B-L AL-S-L Pressure ST-B-P ST-S-P AL-B-P AL-S-P 16
17 Phase I Physical Test Specimen Configuration 17

18 Phase I Instrumentation All specimens: Displacement transducers Strain gages 18
19 Swaged Bulkhead Swaged Bulkhead Phase I Material Properties Coupon Testing Material Grade Heat No. Coupon Young Modulus (ksi) Young Modulus (MPa) Yield Stress* (ksi) Yield Stress* (MPa) Tensile Strength (ksi) Tensile Strength (MPa) Elongation (%) Coupon 1 29, , Steel DH36 AISI999 Coupon 2 30, Average 30, Coupon 1 29, Coupon 2 29, Average 29, Aluminum A5083- H Coupon 1 10, Coupon
20 Phase I Physical Testing: Pressure Tests 20
21 Phase I Pressure Test Set-up: Plan View (a) Plan View 21
22 Phase I Pressure Test Set-up: Elevation View (a) Plan View (b) View A-A 22

23 Phase I Pressure Test Set-up Example: Aluminum Bulb 23
24 Pressure (psi) Phase I Comparison on Aluminum Bulb and Aluminum Swage under Pressure Loading Specimen ALBP Specimen ALSP Displacement (in.)
25 Pressure (psi) Phase I Comparison of Steel Bulb and Steel Swage under Pressure Loading Specimen STBP Specimen STSP Displacement (in.)
26 Phase I Physical Testing: Lateral Load/Shear Tests 26
27 Phase I Lateral Load/Shear Test Set-up: Plan View 27

28 Phase I Lateral Load/Shear Test Set-up: Plan View 28
29 Phase I Lateral Load/Shear Test Set-up: Elevation View View A-A View B-B 29

30 Phase I Lateral Load/Shear Test Set-up: Elevation View 30


31 Phase I Aluminum Swage Lateral Shear Test Result 31

32 Applied Load (kips) Phase I Comparison of Global Response (AL- S-L) Max. Load=236 kips Max. Max. Load=212 Load=236 kips Load=212 kips kips Test Results FEM Results 'ABAQUS' Displacement (in.) 32

33 Phase I Aluminum Bulb Lateral Shear Test Result 33
 400 350 300 Max.")

34 Applied Load (kips) Phase I Comparison of Global Response (AL- B-L) Max. Load= 303 kips 250 Max. Load= 240 kips Test Results FEM Results 'ABAQUS' Displacement (in.) 34
35 Phase I Physical Testing: Compression Tests 35
36 Phase I Compression Test Set-up: Plan View 36

37 Phase I Compression Test Set-up: Plan View 37
38 Phase I Compression Test Set-up: Elevation View 38

39 Phase I Compression Test Set-up: Elevation View 39

40 Phase I Steel Swage Compression Test Result 40
 1200 1400 1200 1000 Peak Load= 1230 kips 800 Test Result")
 400 200 0 0.0 0.5 1.0 1.5 2.0 2.5 Axial Displacement (in.) 41")
41 Applied Load (kips) Applied Load (kips) Phase I Comparison 1400 of Global Response (ST- S-C) Peak Load= 1230 kips 800 Test Result FEM Analysis (ABAQUS) Axial Displacement (in.) Axial Displacement (in.) 41


42 Phase I Steel Bulb Compression Test Result 42
43 Applied Load (kips) Phase I Comparison of Global Response (ST- B-C) Pre-test Prediction Displacement (in.) 43


44 Phase I Aluminum Swage Compression Test Result 44

45 Applied Load (kips) Phase I Comparison of Global Response (AL- S-C) Test Results FEM Results 'ABAQUS' Peak Load= 783 kips Peak Load= 676 kips Axial Displacement (in.) 45


46 Phase I Aluminum Bulb Compression Test 46
 800 700 600 500 400 300 200 100 Test")

47 Applied Load (kips) Phase I Comparison of Global Response (AL- B-C) Test Result FEM Analysis (ABAQUS) Peak Load= 702 kips Peak Load= 498 kips Axial Displacement (in.) 47
48 Phase I Completion Large benefit from testing bulkhead specimens to failure In testing, swaged specimens performed better overall than bulb stiffened specimens Non-linear Finite Element Analysis predicted peak load and failure shape with decent accuracy. Linear Finite Element Analysis also showed correlation with the physical test at the low load levels. Next: Phase II Further investigation into FEA methodologies Addition variations to test specimens: swage geometry/material properties 48
49 Phase II Bulkhead Design and Fabrication 49

50 Phase II: Two Swage Shapes Chosen Swage Shape 1: designed and tested in Phase I Swage Shape 2: from NASSCO s T-AKE and used for initial NSRP Panel project preceding current project Shape 2 has about half of Shape 1 s Moment of Inertia 50

51 Phase II: 3D Model of Swage Shapes 1 & 2 Swage Shape 1 Swage Shape 2 51
52 Phase II: Steel Material Grade/Thickness Ordinary strength steel (ABS Grade A) Theoretical yield strength of 34 ksi / 235 MPa High strength steel (ABS DH-36) Theoretical yield strength of 51 ksi / 355 MPa Coupon testing will be conducted to determine actual material properties These properties will be used in FEA Material thickness variations will be looked at numerically 52

53 Phase II Swaged Bulkhead Accuracy Control Shape 1 Specimens built with swage depth 5 mm greater than Phase I. No option to re-make Artifact of the manufacturing process Reference point issue Shape updated in test setup drawings Shape updated in FEA geometry, including a slight change in the originally calculated moment of inertia 53
54 Phase II Swaged Bulkhead Accuracy Control Comparison between Swage Shape 1 as designed (red) and as built (blue) 54
55 Phase II Physical Testing 55
56 Phase II Bulkhead Load Profiles Compression Lateral Load/Shear 56
57 Table 4: Descriptions of Test Items Phase II Description of Test Specimens ITEM SPECIMEN MATERIAL GRADE THICKNESS SHAPE LOAD 1 ST-B-L Steel DH36 8 Bulb Lateral 2 ST-S-L Steel DH36 8 Swage P1 Lateral 3 ST-S-C-G Steel A36 8 Swage 2 Compression 4 ST-S-L-G Steel A36 8 Swage 2 Lateral 5 ST-S-C-M Steel A36 8 Swage 1 Compression 6 ST-S-L-M Steel A36 8 Swage 1 Lateral 57
58 Phase II Compression Loading Test Set-up Plan View View A-A 58

59 Phase II Compression Loading Test Set-up Plan View View from North 59
60 Phase II Lateral (Shear) Loading Test Set-up Plan View View A-A 60
 Loading")

61 Phase II Lateral (Shear) Loading Test Set-up Plan View View from North 61
62 Phase II Steel Material Properties Based on Tensile Coupon Test Heat No. Young Modulus (ksi) Yield Stress* (ksi) Tensile Strength (ksi) Elongation** (%) A36 N.A N.A DH36 A1S *Based on 0.2% strain offset **Gage length 3 in
63 Phase II Loading Protocol - STSCG Phase of Loading Stage I before buckling (0.05 in. displacement increment) Axial Displacement Increment (in.) Stage II after buckling (0.1 in. displacement increment)
64 Phase II Instrumentation: Displacement Transducers Note: Displacement transducers in parentheses are placed beneath the specimen

65 Phase II Instrumentation: Strain Gages Note: Strain gages in parentheses are on the bottom face of the panel
66 Phase II Physical Test Instrumentation All specimens: Displacement transducers Strain gages Same lab setup as Phase I for consistency 66


67 Phase II Deformed Shape at 0.50 in Axial Displacement View from East View from North View from West 67 67
68 Phase II Global Response (Applied Load Vs. Axial Displacement Applied Load (kips) B C A D Displacement (in.) 68 68

69 Load (kips) Load (kips) Load (kips) Load (kips) Phase II Actuator Load Distribution East Actuator Middle Actuator West Actuator Event A Event B Event C Event D East MiddleWest 0 East MiddleWest 0 East MiddleWest 0 East MiddleWest 69 69
70 Phase II Finite Element Analysis 70
71 Phase II: Finite Element Analysis FEA models from Phase I reviewed and methodologies improved Linear and non-linear analyses performed and will be compared to physical testing results Linear FEA is not reliable post-yield Non-linear FEA provides capability for post-buckling shape and stress comparison Actual material properties used in all models based on coupon testing 71
72 Phase II Results: Test Data Analysis Item 5: Steel Swage Compressive Load Material (ST-S-C-M) Resulting stress from each strain gauge reading vs. actual displacement 72
73 Phase II Results: Test Data Analysis Item 5: Steel Swage Compressive Load Material (ST-S-C-M) Determined load = 424 kips at 3 mm displacement 73
")
74 Phase II Results: Linear FEA Item 5: Steel Swage Compressive Load Material (ST-S-C-M) 74
75 Results: Linear FEA vs. Test Data Item 5: Steel Swage Compressive Load Material (ST-S-C-M) Stress Comparison at each Strain Gauge Location S05 S Experimental Normal Stress (MPa) FEA Normal Stress (MPa) Difference (MPa) R04 S R03 S06 S09 S12 S S02 S S01 S07 S

76 Phase II Results: Linear FEA vs. Test Data Item 5: Steel Swage Compressive Load Material (ST-S-C-M) 76

")
77 Phase II Results: Item 3: Steel Swage Compressive Load Geometry (ST-S-C-G) 77


78 Phase II Results: Item 1: Steel Bulb Lateral Load (ST-B-L) 78


79 Phase II Results: Item 2: Steel Swage Lateral Load (ST-S-L) 79


80 Phase II Results: Item 4: Steel Swage Lateral Load-Geometry (ST-S-L-G) 80

81 Phase II Buckling Analysis: Steel Bulb Lateral Load (ST-B-L) Buckling Analysis performed to predict failure shapes Predicted Mode 1 Buckling Load = 205 kips Resulting Maximum Load = 283kips 81

82 Phase II Buckling Analysis: Steel Swage Lateral Load (ST-S-L) Predicted Mode 1 Buckling Load = 303 kips Resulting Maximum Load = 316 kips 82


83 Phase II Buckling Analysis: Steel Swage Compressive Load Geometry (ST-S-C-G) Predicted Mode 1 Buckling Load = 606 kips Resulting Maximum Load = 863kips 83


84 Phase II Buckling Analysis: Steel Swage Lateral Load-Geometry (ST-S-L-G) Predicted Mode 1 Buckling Load = 290 kips Resulting Maximum Load = 320 kip 84


85 Phase II Buckling Analysis: Steel Swage Compressive Load Material (ST-S-C-M) Predicted Mode 1 Buckling Load = 784 kips Resulting Maximum Load =1108kips 85

86 Phase II Buckling Analysis: Steel Swage Lateral Load-Material (ST-S-L-M) Predicted Mode 1 Buckling Load = 338 kips Resulting Maximum Load = 281 kips 86
87 Overall Stress Analysis Results for Phase II Item Number Test Type Specimen 3mm displace ment (kips) Phase II Results: Stress Experimental Strain Gauge FEA Strain Gauge Comparison Average (MPa) St. Dev. Average (MPa) St. Dev. FE - Exp. (MPa) (FE- Exp.)/(FE) (%) Compression 3 Compressi on ST-S-C-G % 5 Compressi on ST-S-C-M % Lateral 1 Lateral ST-B-L % 2 Lateral ST-S-L % 4 Lateral ST-S-L-G % 6 Lateral ST-S-L-M % Average % 23% * Only the strain gauges in the two center panels were used for the averages, the edges were ignored as they were not supported and had unusual stress patterns. 87
88 Overall Buckling Analysis Results for Phase II Item Number Test Type Specimen Phase II Results: Buckling Experimental FEA Comparison Maximum Load (kips) Compression Mode 1 Eigen Value Mode 1 Buckling Load (kips) FE - Exp. (kips) (FE-Exp.)/(FE) (%) 3 Compression ST-S-V-G % 5 Compression ST-S-V-M % Shear 1 Lateral ST-B-L % 2 Lateral ST-S-L % 4 Lateral ST-S-L-G % 6 Lateral ST-S-L-M % Average % 26% *Maximum experimental load taken by the panels was compared to the FE load required for the panel to buckle by Mode 1. The experimental load was taken from Tables 3.1 and Table 4.1 form UCSD s Report (see Appendix B) 88
89 Phase II Completion Test Results show strong correlation with FEA predictions FEA predictions are conservative compared to experimental capacities Improvement from Phase I due to: Increased accuracy in testing load application Detailed comparison analysis 89
90 Phase III Bulkheads with Cutouts and Attachments 90
91 Phase III: Bulkheads with Cutouts and Attachments 91
92 Phase III Physical Testing: Lateral Load/Shear Tests 92
93 Phase III Physical Test Layout 93


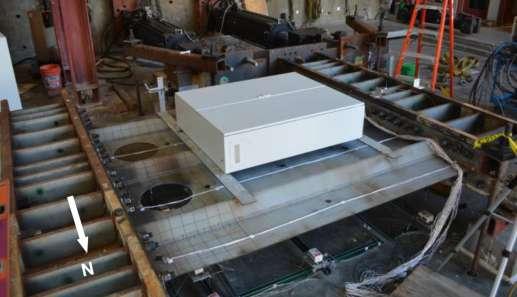
94 Phase III Physical Testing Set-up 94
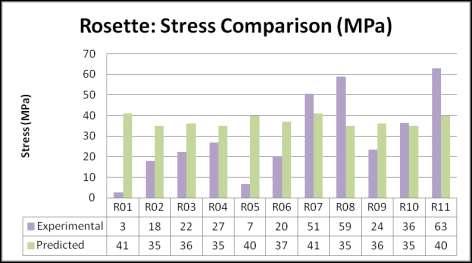
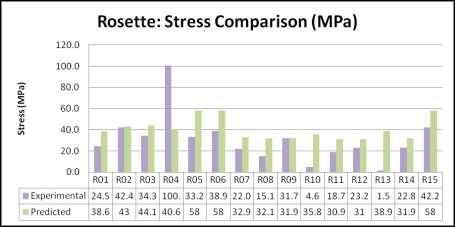
95 Phase III Instrumentation R13 R12 R11 R10 3" 1'-9" 2' R09 R08 R14 2' " 2' S04 S03 R07 S02 S01 S05 S06 S07 S08 2' 2' " R06 R05 R15 1'-9" 2' R04 R03 R02 R01 3" Blue 71 2 " Red 1' " 2'-8" 1' " " 71 2 " 1' " 2'-8" 1' " Yellow " Red Yellow Rosette Orientation Blue Rosette Orientation 95


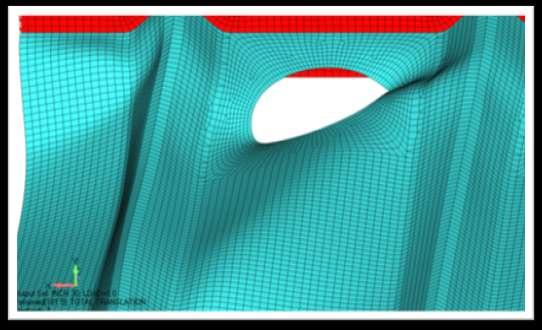
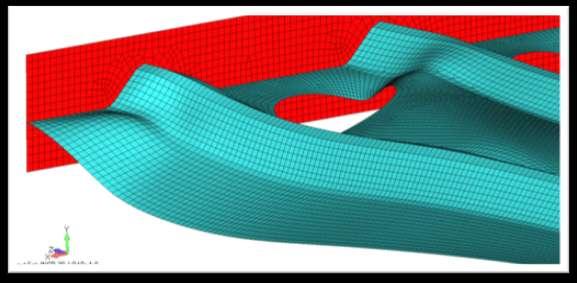
96 Phase III Physical Test Results Deformed Specimen 96
97 Phase III Physical Test Results Global Response Comparison of Bulkheads with cutouts (ST- S-L-H), with electrical cabinet (ST-S-L-C), and with both (ST-S- L-HC). 97
98 Phase III Linear Finite Element Analysis 98


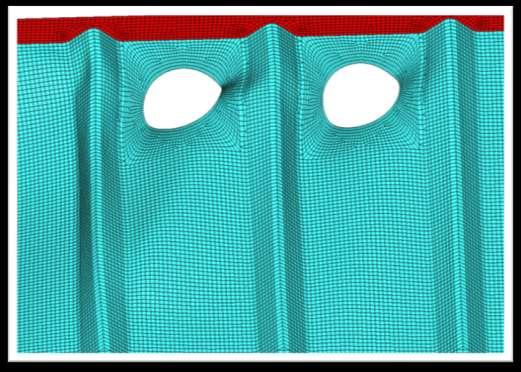
99 Phase III: Linear FEA Models 99


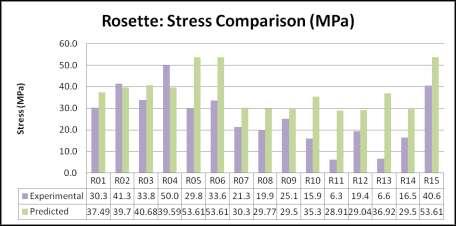
100 Phase III: STSS-H Comparison of Results 100


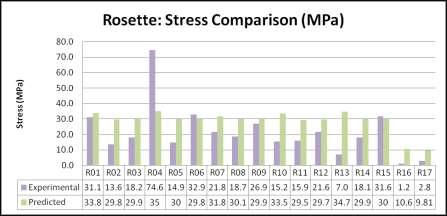
101 Phase III: STSS-HC Comparison of Results 101


102 Phase III: STSS-C Comparison of Results 102
103 Phase III Non-linear Finite Element Analysis 103

104 Phase III: Non-linear FEA Properties Isotropic Steel with Modulus Elasticity = MPa Plasticity Modulus (H) = Mpa (based on 10% of Modulus of Elasticity) Initial yield stress = 345 Mpa West Actuator Load defined as enforced displacement of mm East Actuator Load defined as enforced displacement of mm 104

105 Phase III: Non-linear FEA Properties 105
106 Applied Load (kips) Phase III: Non-linear FEA Results 250 Lateral Displacement vs. Applied Load FEA West Act FEA East Act Physical Test West Act Physical Test East Act Lateral Displacement (in) 106

107 Phase III: Non-linear FEA Results 107

108 Phase III: Non-linear FEA Results 108

109 Phase III: Non-linear FEA Results 109
110 Phase III: Conclusions In the FEA, loads required to achieve displacements did not match those measured in physical test. Boundary conditions during physical test did not allow for pure shear loading. Despite tests departure from intended pure shear loading, data collected still highly valuable. Comparisons made between swage and stiffened bulkheads earlier in the project remain valid because all were tested under identical conditions. Pure shear load application will be verified in follow-on project. 110
111 NEXT: Swage Panel SVR Rule Development Extends work done on Swaged Bulkhead Analysis and Verification End product: Design Guidance in ABS Steel Vessel Rules Team Lead: GD NASSCO ABS San Diego State University External Review: Shipyards Navy Huntington Ingalls Industries Bath Iron Works Marinette Marine Corporation Technical Domain Manager SEA05P (Structural Integrity-Surface Ships) 111
112 Thank You 112