Identification of cytokine-induced modulation of microrna expression and secretion as measured by a novel microrna specific qpcr assay
|
|
|
- Hugo Phillips
- 5 years ago
- Views:
Transcription
1
2
3
4
5
6
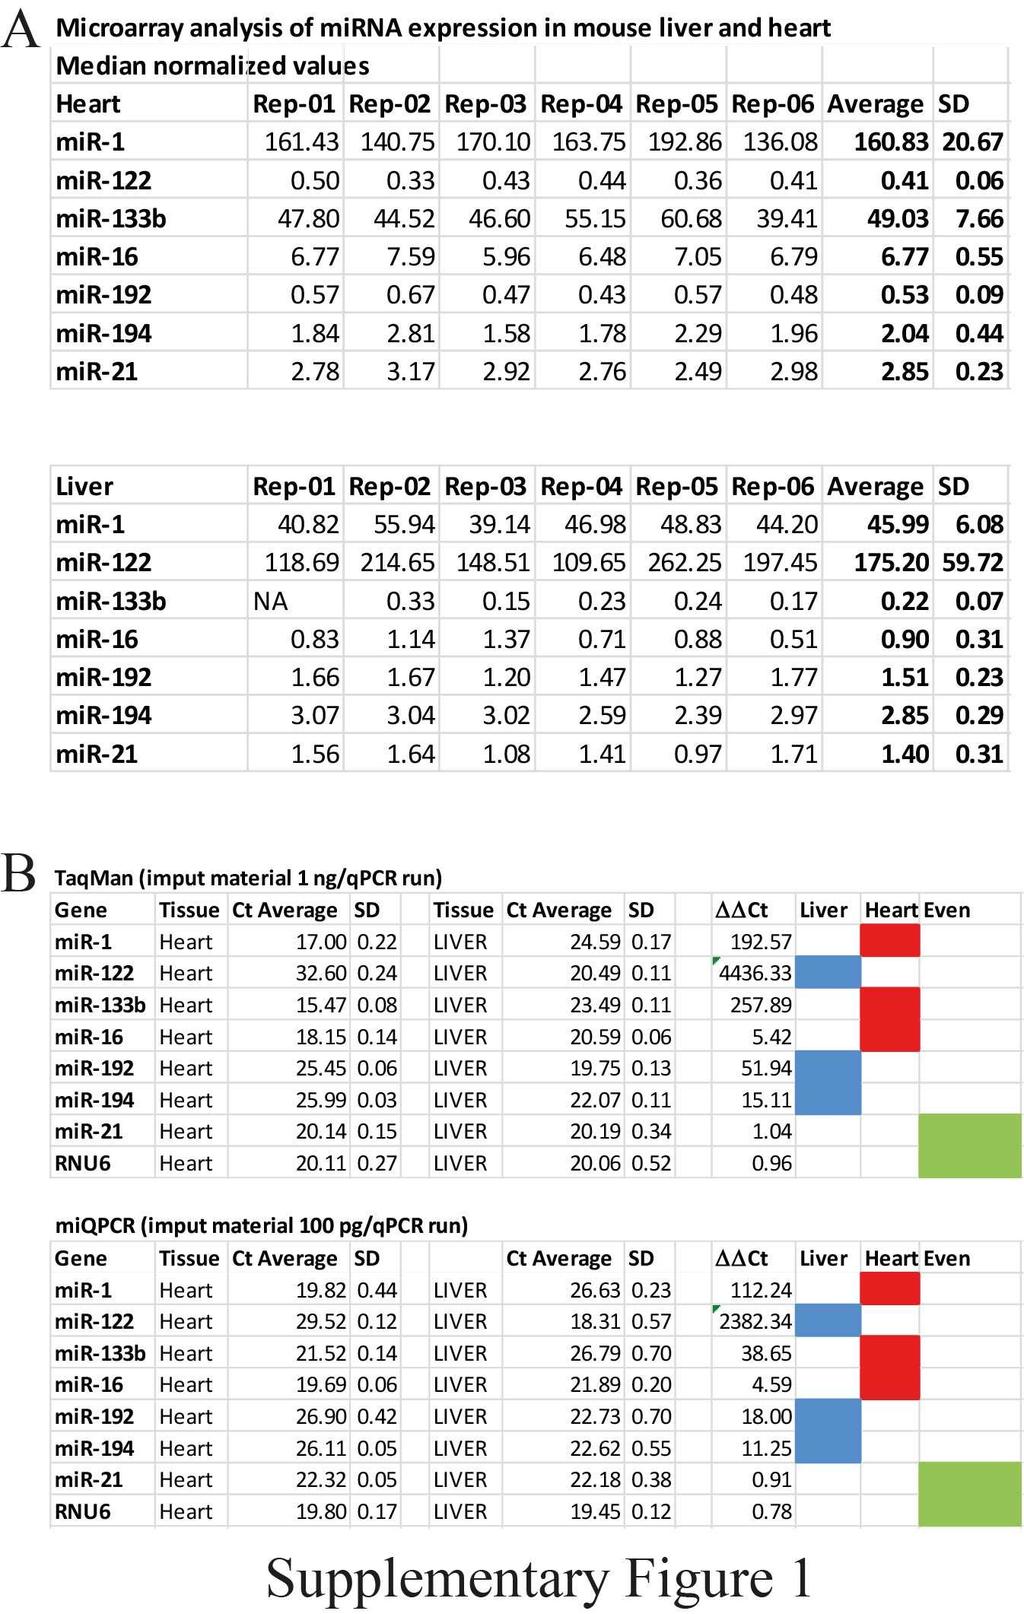
7 Supplementary Figure Legends Supplementary Figure 1: Detection, analysis and comparison of mirnas expression in mouse liver and heart by using miqpcr and TaqMan mirna assays. A) Microarray analysis of mirna expression in FirstChoice total RNA from mouse heart or liver. Following hybridization, array data were median normalized and the average of six independent experiments was calculated. Data are indicated as mean ± SD (n=6). B) cdna was synthesized using miqpcr from FirstChoice total RNA extracted mouse liver or heart. Expression profiling of mir-1, mir-122, mir-133b, mir-16, mir-192, mir-194, mir-21 and RNU6 was determined using miqpcr or TaqMan mirna assays. Data are indicated as mean ± SD (n=4). Four independent experiments were performed and the Ct of heart vs liver were calculated. Data with higher expression in the liver is represented in blue, in the heart is represented in red and invariant signal is represented in green. Supplementary Figure 2: miqpcr analysis of mirna expression in RNA extracted from human FFPE biopsies. A) Assessment of RNA integrity. RNA extracted from human FFPE biopsies was analyzed on an Agilent Pico Chip (Bioanaylzer). The presence of low molecular weight smears indicates complete RNAs degradation. B) miqpcr analysis of mirnas expression in RNA extracted from FFPE liver biopsies of patients and control groups. Only the expression levels of mir-122 are significantly reduced in the liver of patients compared to control group. Data are represented as mean ± SD (patient n=13; controls n=8). To determine whether the differences between two groups were significant we employed the unpaired T-test, **p < 0.01.
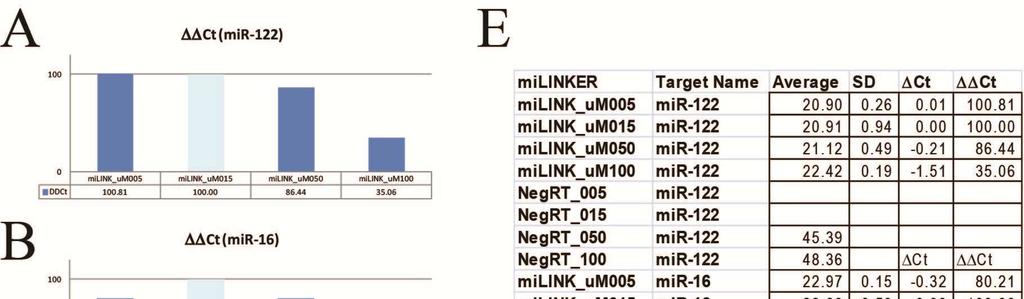
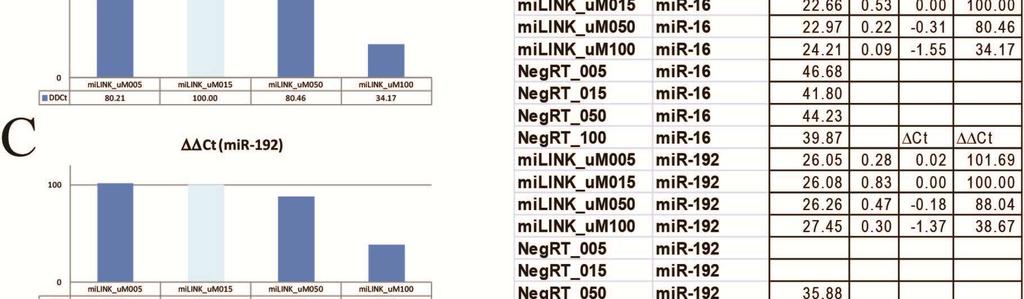
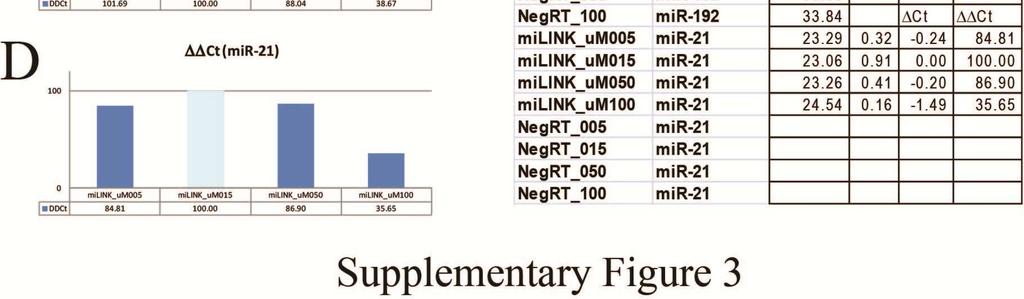
8 Supplementary Figure 3: Optimization of the miqpcr elongation protocol, identification of the milinker working concentrations. RNAs were elongate and reverse transcribed by using standard miqpcr approach by including different the amount of milinker used in the elongation step (0.5, 1.5, 5 and 10 µm), measurement for different mirnas A) mir-122, B) mir-16, C) mir-192 and D) mir-21. E) Indicates the average and standard deviation calculated from four independent experiments. Cts and Cts were calculated relative to measures performed with cdnas synthesized with 1.5 µm of milinker. Average and standard deviation from four (n=4) independent experiments are shown. Supplementary Figure 4: Calibration of the miqpcr elongation protocol, identification of the PEG working concentrations. RNAs were elongate and reverse transcribed by using standard miqpcr approach by including two different amounts of PEG (17% and 24%), measurement for different mirnas A) mir-122, B) mir-194, C) mir-16 and D) mir-21. E) Indicates the average and standard deviation calculated from six independent experiments. Cts and Cts were calculated relative to measures performed with cdnas synthesized with 17% PEG. Average and standard deviation from six (n=6) independent measurements are shown. Supplementary Figure 5: Amplification plots, melting curves and standard curves of hepatic mirnas. 10 ng of liver total RNA (FirstChoice) were reverse transcribed using the miqpcr protocol and 1:5 scalar dilutions prepared (100 pg, 20 pg, 4 pg, 800 fg, 160 fg, 32 fg and 6 fg) and the expression of 4 mirnas A); mir-122, B); mir-192, C); mir-21 and D)
9 mir-16) was analyzed by qpcr as described. Data are represented as Ct average ± standard deviation calculated from four (n=4) independent cdnas synthesis. Supplementary Table 1: Primers used in this study. A) linker-adaptor and RT primers used for miqpcr cdna synthesis and B and C) miqpcr primers used in the qpcr assays included in this study. Supplementary Table 2: Complete list of Tm adjusted primers included in the mirbase v19. The sequences for all mirnas were downloaded from mirbase (version 19) and their Tms were calculated before (Tm) and after (Tm2) adjustment. Predicted Tm for all the sequences were calculated by using Breslauer thermodynamic parameters.
10 SUPPLEMENTARY MATERIALS AND METHODS Design of miqpcr mirna-specific primers The specificity and sensitivity of qpcr assays rely on primer design. For the intrinsic nature of the mature mirna, design of mirna-specific primers is particularly challenging. An important aspect of the miqpcr approach is that milinker addition creates an amplicon of around 60 nts (it vary according to the initial mirna-length), which consents for the flexible design of mirna-specific primer allowing the achievement of a consistent Tm. To design mirna-specific primers follow the stepwise optimization of primer design for miqpcr: a. Download the full-length sequence of the mature mirnas from the mirbase database, as starting point the design for Tm adjusted primers of all mirnas contained in mirbase v19 is available in the supplementary Supplemental Table 2. b. Add a G to the 3 -end of the mirna sequence, which is the first nucleotide of the milinker sequence (Supplemental Table 1). c. Determine the predicted Tm of the duplex molecule (see web links at the end of On-line Material and Methods) d. If the predicted Tm is 55 C> Tm< 62 C, then the sequence is suitable to be used without further modification. e. If the predicted Tm is lower than 55 C, then elongate the 3 -end of the mirna-specific primer sequence by further adding up to two additional nucleotides from the milinker 5 -end (Supplemental Table 1). f. If the predicted Tm is higher than 62 C, then shorten the 5 -end of the mirna sequence successively until a Tm between 55 Cand 62 C is reached. g. As the shortening of the sequence may result in a loss of specificity, we strongly recommend blasting the obtained primer sequence against the mirbase: ( Parameters critical for the success of the miqpcr 1) RNA quality control: to obtain accurate and reproducible qpcr data it is essential to use total RNA with an RNA Integrity Number (RIN) above 7 1,2.
11 2) Starting amount of total RNA: experimental conditions have been optimized for of small RNAs contained within 10 ng of total RNA; for exosomal mirnas extracted from Serum or tissue culture medium uses four µl (see RNA extraction for detailed RNA isolation protocol). 3) milinker sequence features: To allow the ligation by the truncated T4-RNA ligase 2 the linker adaptor must contain one adenyl group at its 5 -end to ensure efficient ligation by the RNA ligase. 4) Amount of milinker: For 10 ng of total RNA (or 4 µl of exosomal RNA) the optimal final concentration of milinker is between 0.5 and 1.5 µm (data not shown). In the current protocol, we employ 1.5 µm of milinker. 5) Reverse transcription must be carried out at 46ºC. During cdna synthesis, it is important to avoid cooling the mix below 46ºC following the denaturation step. 6) The presented data were generated with the Power SYBR Green master Mix (Life Technologies, Cat: ) and PrimeScript (Takara-Clontech, Cat: 2680A) as reverse transcriptase. In addition to the reagent described in the manuscript, we have tested with positive results the following vendors for SYBR Green: Clontech (Cat: and Cat: ), Takara (Cat: RR820W), Promega (Cat: A6002) and Bioline (Cat: QT650-05) as well as the following reverse transcriptases: Superscript II (Invitrogen, Cat: ) and Superscript III (Invitrogen, Cat: ). T4 RNA ligases from other vendors were also tested, though none of the tried enzymes did offer results comparable to the Rnl2tr. 7) miqpcr have been successfully run on the following cyclers: ABI-ViiA7, ABI-7500, ABI-7900, ABI-StepOne Plus, Roche-Light Cycler, Illumina ECO, Analytik Jena qtower 2 and Fluidigm-BioMark-HD. 8) Cycler program is composed of a two-step qpcr with incubation at 95ºC for 10 minutes hot start to activate the polymerase (IMPORTANT: the length of the hot-start step may differs among SYBR Green I sold by diverse vendors), 50 cycles at 95ºC for 10 seconds and 60ºC for 35 seconds, followed by the melting curve.
12 9) The presented miqpcr protocol is not compatible for fast cycling chemistry. We have tested with negative results fast cycling chemistry on the ABI-StepOne Plus, ABI-7500 Fast and Fluidigm-BioMark-HD. References 1 Becker, C., Hammerle-Fickinger, A., Riedmaier, I. & Pfaffl, M. W. mrna and microrna quality control for RT-qPCR analysis. Methods, doi:s (10) (2010). 2 Ibberson, D., Benes, V., Muckenthaler, M. U. & Castoldi, M. RNA degradation compromises the reliability of microrna expression profiling. BMC Biotechnol 9, 102, doi: (2009)