Supporting Online Material for
|
|
|
- Francine Brown
- 5 years ago
- Views:
Transcription

1 Supporting Online Material for A Gene Regulatory Network Subcircuit Drives a Dynamic Pattern of Gene Expression Joel Smith, Christina Theodoris, Eric H. Davidson* *To whom correspondence should be addressed. davidson@caltech.edu Published 2 November 2007, Science 318, 794 (2007) DOI: /science This PDF file includes: Materials and Methods Figs. S1 to S3 Table S1 References
2 Supplementary Online Materials Materials and methods Microinjection and quantitative real-time PCR Standard PCR and fusion PCR techniques using the High Fidelity PCR Kit (Roche, Indianapolis, IN) were used to build constructs. The minimal cis-regulatory sequences controlling blimp1b expression were determined. A cdna clone encoding blimp1b was previously isolated by A. Ransick from a 15 h cdna Strongylocentrotus purpuratus library. PCR products for all significant reporter constructs were subsequently cloned using the EPICENTRE (Madison, WI) Copy Control Cloning System in the case of large inserts (>5 kb) or the pgem-t Easy Vector System from Promega, and were confirmed by sequencing. The following Blimp1 sequences were used to identify putative transcription factor binding sites: 5 -G(A/)AA(C/G)(G/T)GAAA, 5 -G(A/G)AA(C/G)(G/T)AAA, or 5 -(A/G)(G/T)AGAAATT (1, 2). Binding site sequences were mutated by PCR, preserving the partially overlapping Tcf binding sites, and the resulting constructs checked by sequencing. The PCR primers were designed with tailed non-priming sequences including the mutant form of the candidate transcription factor binding sites. Mutations were designed by swapping A to C, T to G, and vice versa. PCR products or linearized BAC cloned constructs were purified with the Qiagen Qiaquick PCR purification kit and microinjected into fertilized S. purpuratus eggs as described. Approximately 1500 molecules of the desired construct were injected along with a 6-fold molar excess of HindIII-digested carrier sea urchin DNA per egg in a 4 pl volume of 0.12 M KCl. Embryos were collected at different stages for observation by fluorescence microscopy for qualitative assessment of spatial activity; or for quantitative analysis of transcript prevalence by real-time PCR (QPCR). For high-density cdna timecourse experiments, gametes were harvested from three females and three males, pooled and cultured at 14.5 C. Three separate samples were removed at 20 min intervals for independent processing and QPCR analysis. Data points represent the average of the three samples smoothened over a three-time point window. Data were curve-fitted using the SigmaPlot software package (Systat, San Jose, CA). All experimental and control constructs were tested in multiple batches of eggs. Microinjection and measurement of GFP mrna by QPCR was performed as described (3). Briefly, embryos were harvested and pelleted in an Eppendorf 5415 D microcentrifuge for 4 min at 4000 rpm and lysed in 700 µl RLT buffer (Qiagen) with β-mercaptoethanol added. Total RNA was prepared using the Qiagen RNeasy Micro kit, including on column DNase I digestion, and eluted in 16 µl RNase-free water. Two µl of the eluate were set aside for later QPCR analysis as a reverse transcriptase-negative control, while the remainder was processed by the iscript cdna Synthesis kit from BioRad in a 20 µl reaction volume according to the following reaction protocol: 5 min at 25ºC; 30 min at 42ºC; 5 min at 85ºC. Samples were then analyzed by QPCR using the itaq SYBR Green Supermix with ROX from BioRad. In general, 2 embryo equivalents of cdna solution were analyzed per well and reactions were run in quadruplicate wells in a 384-well plate at a final volume of 10 µl; primers
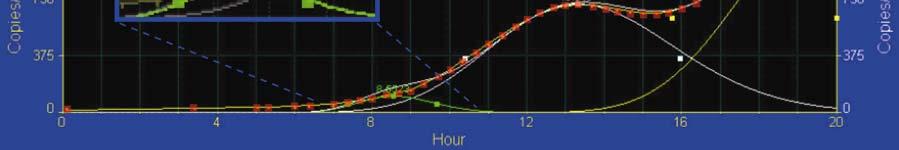
3 were at a final concentration of 250 nm. Samples were analyzed using an Applied Biosystems 7900 HT Fast Real-Time PCR System. Whole-mount in situ hybridization (WMISH) The WMISH protocol used here is based on the method of (4), with minor modifications. Embryos were incubated with antibody overnight at 4 C and transferred into 50% glycerol in a stepwise manner and mounted on slides sealed with clear nail polish. Fig. S1. Effect of wnt8 MASO on blimp1b mrna. Six independent experiments where fertilized eggs were injected with morpholino antisense oligonucleotides (MASO) directed against wnt8. Embryos were harvested at either 12 h or 16 h post-fertilization. Total RNA was prepared using the Qiagen RNeasy Micro kit, including on column DNase I digestion, and cdna was prepared by the iscript cdna Synthesis kit from BioRad. Samples were analyzed by QPCR using the itaq SYBR Green Supermix with ROX from BioRad on an Applied Biosystems 7900 HT Fast Real-Time PCR System. Data are given as cycle difference from control MASO injected sample. Dashed lines indicate ± 1.6 cycles difference (~3 fold), our threshold for assigning significance. Fig. S2. Expression profiles of wnt8 and blimp1b. (A) High-resolution quantitative data show blimp1b message is present at low levels maternally, while wnt8 is not. Around 6 hpf (between 4 th and 5 th cleavages) wnt8 message becomes detectable and increases rapidly. By comparison, blimp1b transcripts appear to increase not before 7 to 8 hpf (5 th to 6 th cleavage. (B) High-density cdna time course tracking blimp1b message by QPCR. Data (red squares) represent the average of three separate samples processed independently. Curve deconvolution reveals three peaks of blimp1b transcript levels corresponding to the different domains of expression as indicated by high-density time course WMISH for blimp1b (1): one corresponding to blimp1b expression in the micromeres (green); presumptive mesoderm (white); and in the endoderm (yellow). Taking the mesoderm curve as an example, blimp1b is expressed in 32 cells per embryo at 13.3 hpf at 717 transcripts per embryo, or 22.4 transcripts per cell at peak expression, i. e., the point where the balance between blimp1b activation and autorepression tips in favor of autorepression. This is therefore rough indicator of the concentration threshold of Blimp1b protein driving autorepression. Though the peak for mesoderm blimp1b expression is likely to be most accurate for estimating this level, the other peaks (135 copies in 8 micromere descendents at 8.7 hpf, or 135/8 = 16.9 copies per cell; and 1310 copies in 64 endoderm cells at 20 hpf, or 1276/64 = 19.9) indicate a similar plateau of blimp1 expression before autorepression takes over. cdna was prepared from embryos taken at 20 min intervals and the absolute level of blimp1b transcripts assessed by QPCR. (Inset) Expanded view of 7-11 h interval showing peak of blimp1b transcription in micromeres (green line; red data boxes omitted for clarity). Fig. S3. Quantitation of effects of introducing mutexoblimp construct. (A) Tabulation of effects of mutexoblimp on Wnt8 BAC-GFP expression. No control embryos express GFP in the mesoderm at this stage but 80% of interpretable embryos bearing mutexoblimp do so. (B) Quantitation of Wnt8 BAC-GFP expression in this experiment, by measurement of GFP mrna. Message contents were measured by QPCR, as below.
4 Bars represent copies of GFP transcripts per embryo in ExoBlimp control embryos and in embryos injected with the mutexoblimp construct. (C) Tabulation of results from expression of coinjected blimp1b-gfp reporter construct with mutated Blimp1 target sites and mutexoblimp. No control embryos failed to clear GFP from the vegetal mesodermal domain but such failure was observed in 87% of interpretable embryos bearing mutexoblimp. Table S1. Requirement for blimp1 expression for both Otx and β-catenin/tcf inputs: QPCR data. Condition Relative expression Control 100 Οtx input only (Δ-cadherin mrna over-expression) 1.2 Tcf input only (Mutation of both active cis-regulatory Otx sites) 6.0 Since neither input alone generates more than a very small fraction of the level of expression occurring when both are present, the cis-regulatory module operates as an AND processor. References 1. T. C. Kuo, K. L. Calame, J. Immunol. 173, 5556 (2004). 2. C. H. Yuh, E. R. Dorman, M. L. Howard, E. H. Davidson, Dev. Biol. 269, 536 (2004). 3. R. Revilla-i-Domingo, T. Minokawa, E. H. Davidson, Dev. Biol. 274, 438 (2004). 4. T. Minokawa, A. H. Wikramanayake, E. H. Davidson, Dev. Biol. 288, 545 (2005).
5

6


7