Apoptosis assay: Apoptotic cells were identified by Annexin V-Alexa Fluor 488 and Propidium
|
|
|
- Anissa Austin
- 5 years ago
- Views:
Transcription
1 Apoptosis assay: Apoptotic cells were identified by Annexin V-Alexa Fluor 488 and Propidium Iodide (Invitrogen, Carlsbad, CA) staining. Briefly, 2x10 5 cells were washed once in cold PBS and resuspended in 200 µl of binding buffer (10 mm HEPES, 140 mm NaCl, 2.5 mm CaCl 2, ph=7.4). Five µl of Annexin V-Alexa Fluor 488 and Propidium Iodide (PI, final concentration 2.5 µg/ml) was added to 100 µl of cell suspension and incubated in the dark at room temperature for 15 min. After incubation, 300 µl of PI solution (2.5 µg/ml) were added to each sample. Stained cells were then analyzed by flow cytometry (FACScan; Becton Dickinson Immunocytometry Systems [BDIS], San Jose, CA). Apoptosis was quantitated by the FlowJo program; 15,000 cells were analyzed in each sample. Quantitative Real time Polymerase Chain Reaction (RT-PCR): RNA was extracted from cells using TRIzol (Invitrogen, Carlsbad, CA) and the manufacturer s protocol. cdna was prepared using Superscript III First Strand cdna Synthesis kit (Invitrogen, Carlsbad, CA) and detected by SybrGreen (Applied Biosystems, Foster City, CA) on an Opticon2 thermal cycler (MJ Research, Waltham, MA). Gene expression was normalized to hypoxanthine phosphoribosyltransferase (HPRT) and expressed relative to untreated control using the CT method. Thermal cycler conditions were: initial step of 10 min at 95 C followed by 40 cycles of 15 sec at 95 C (denature) and 1 min at 60 C (anneal/extend). For primers, see Table S9. Western blot analysis: Cells were lysed in modified RIPA buffer containing 50 mm Tris-HCl (ph=8.0), 300 mm NaCl, 10% NP-40, 1% s2odium deoxycholate, and 0.1% SDS, and a protease inhibitor cocktail tablet (Roche Applied Science, Indianapolis, IN). Protein extracts were resolved by SDS-PAGE followed by immunoblotting with PCDH8 antibody (JK-19, mouse monoclonal
2 antibody, Santa Cruz Biotechnologies, Santa Cruz, CA), HDAC1 (C-19, goat polyclonal, Santa Cruz Biotechnologies, Santa Cruz, CA), NOTCH1 (5B5, rabbit polyclonal, Cell Signaling Technology, Danvers, MA) and actin antibody (C-11, HRP, goat polyclonal antibody, Santa Cruz Biotechnologies, Santa Cruz, CA), and detected by enhanced chemiluminescence (ECL; Santa Cruz Biotechnology, Santa Cruz, CA).
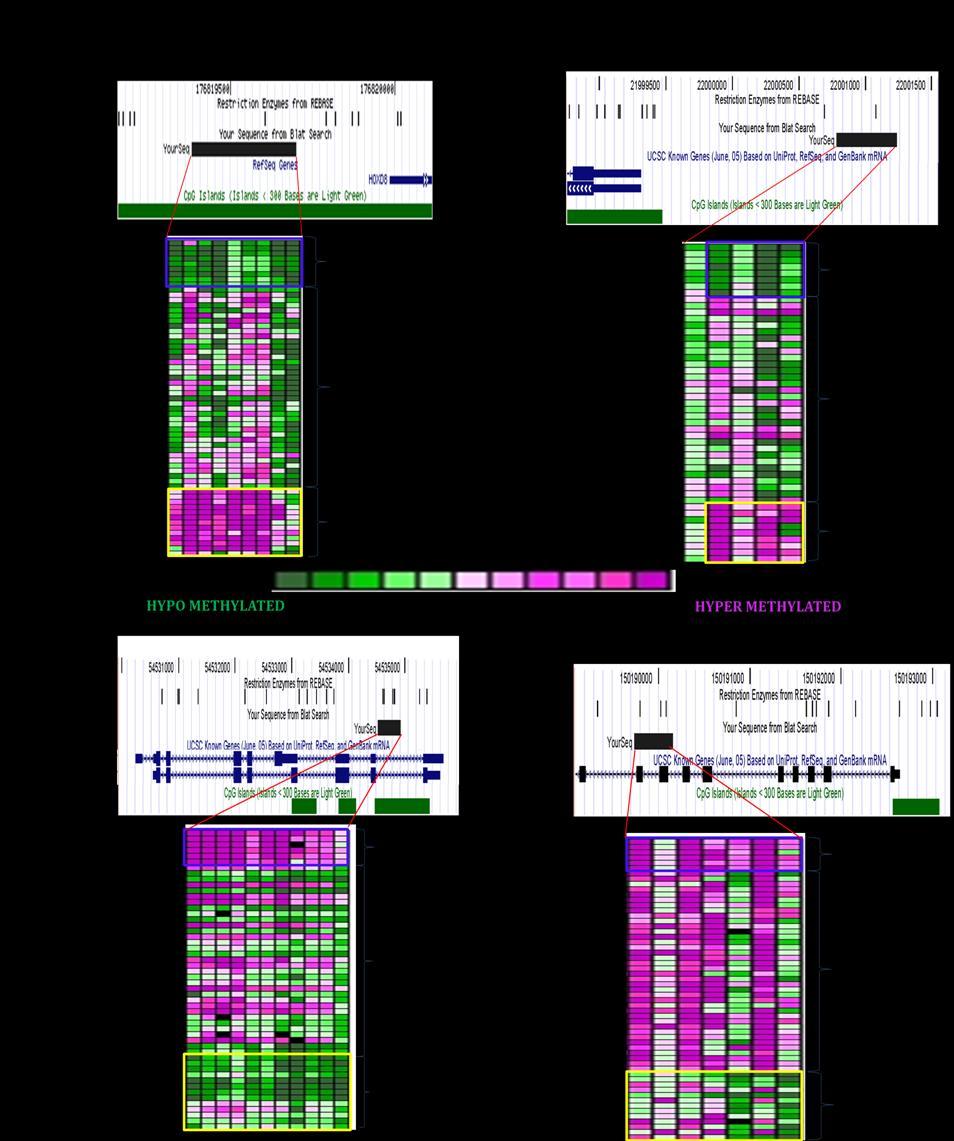
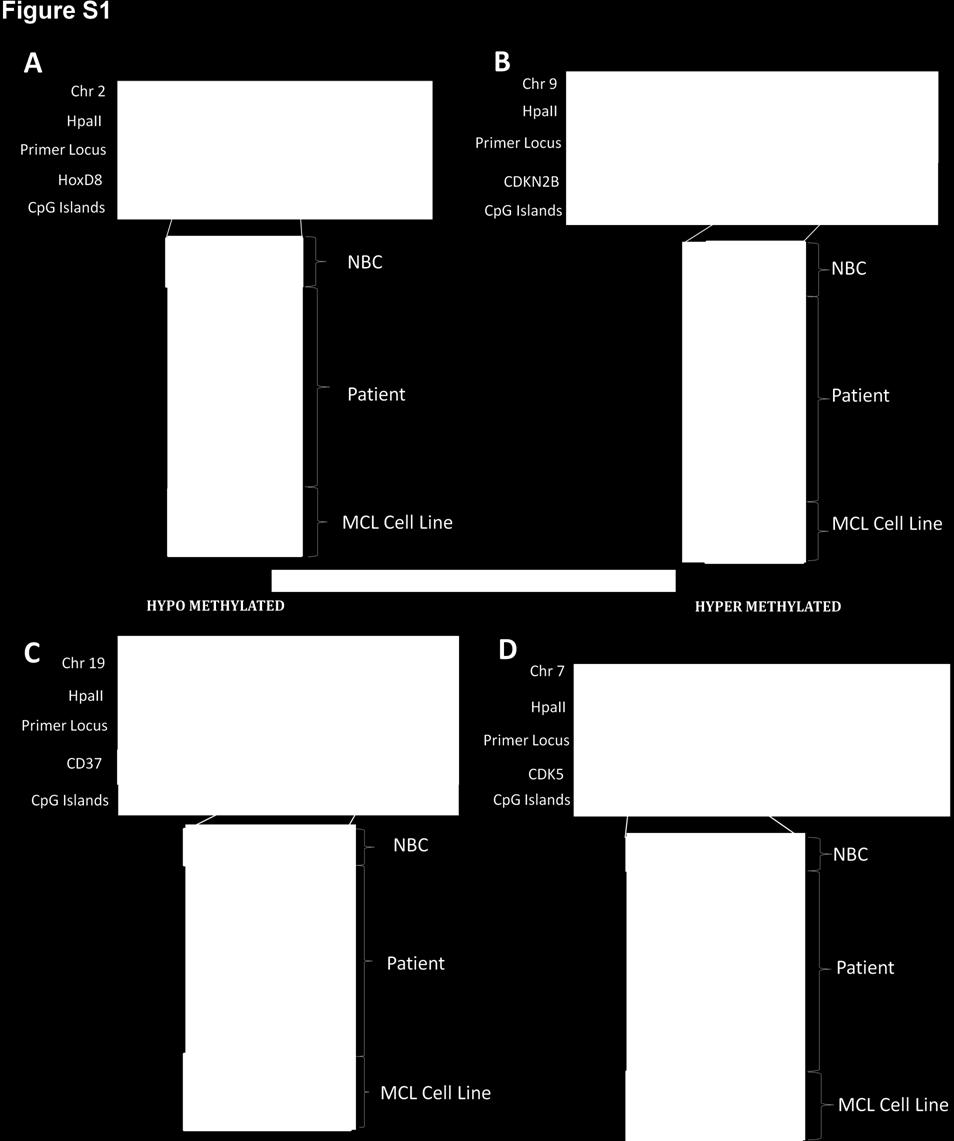
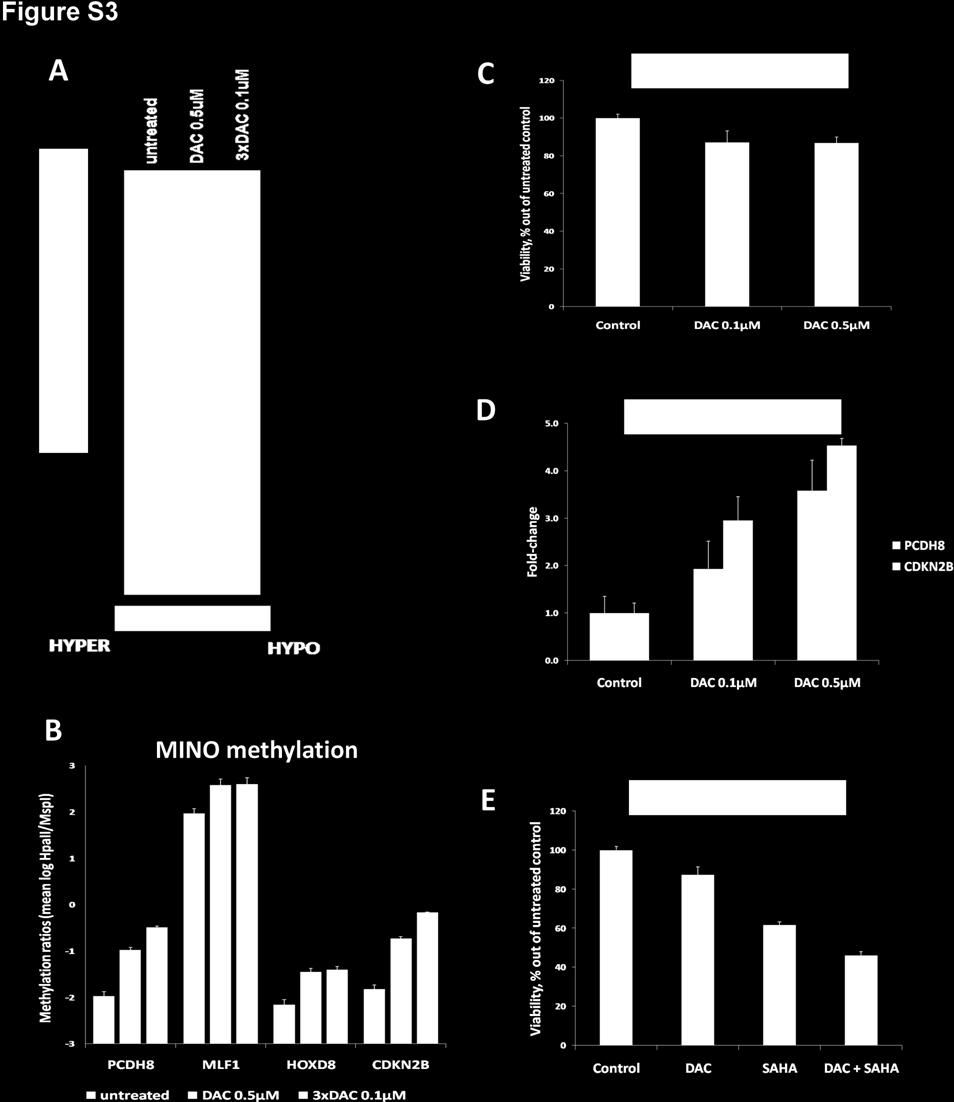
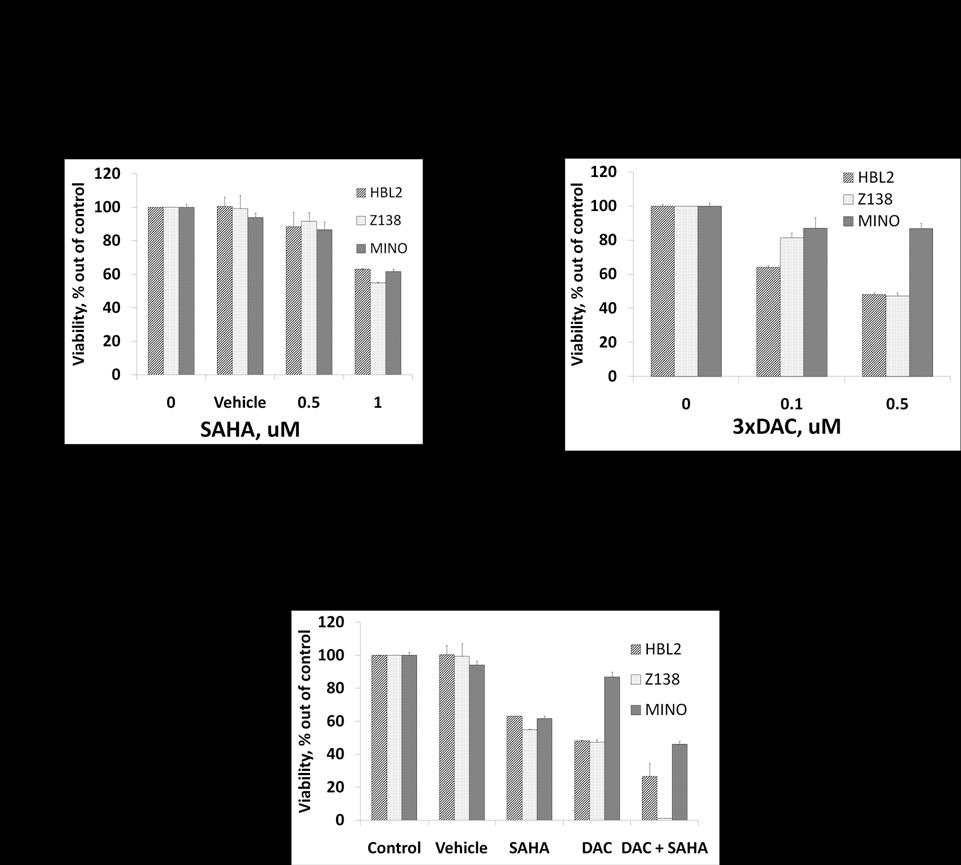
3 Figure S1. MassArray confirms differential methylation in MCL patients and cell lines as compared to NBC controls. Panels A-D show heatmaps of MassArray data comparing methylation in MCL patients, cell lines and NBC controls at individual CPGs for hypermethylated genes: HOXD8, CDKN2B and hypomethylated genes: NOTCH1 and CDK5. Rows correspond to individual samples and columns correspond to individual CpGs. The area covered by the primer, HPAII sites, CpG islands, direction of transcription and gene start are all indicated as tracks in the UCSC Browser. Scale shows relative methylation (green indicates hypomethylation and purple indicates hypermethylation). Figure S2. Decitabine and SAHA cause apoptosis in Z138 cells at low doses. (A) Cell cycle analysis before and after treatment with Decitabine and SAHA at different doses. Percentages of cells in each phase of the cell cycle are given on the top right corner of each figure. (B) Annexin V/PI staining for apoptosis before and after treatment with Decitabine and SAHA at different doses. Percent of cells present in each quadrant indicated on the top right corner. Figure S3. Decitabine synergizes with SAHA in gene induction and cytotoxicity in MINO cells. (A) Methylation (HELP log(hpaii/mspi) ratios) at all 258 differentially hypermethylated loci before and after treatment with Decitabine 0.5 µm for one day and 0.1 µm for three days in MINO cells. Negative ratios (Blue) indicate hypermethylation and positive ratios (Red) indicate hypomethylation. (B) Methylation (Y axis: log(hpaii/mspi)) at 5 differentially hypermethylated loci before and after treatment with Decitabine 0.5 µm for one day and 0.1 µm for three days in MINO cells. (C) Viability of MINO cells with two different dosing schedules of Decitabine. (D) RT- PCR for mrna expression of CDKN2B and PCDH8 in MINO cells before and after treatment with
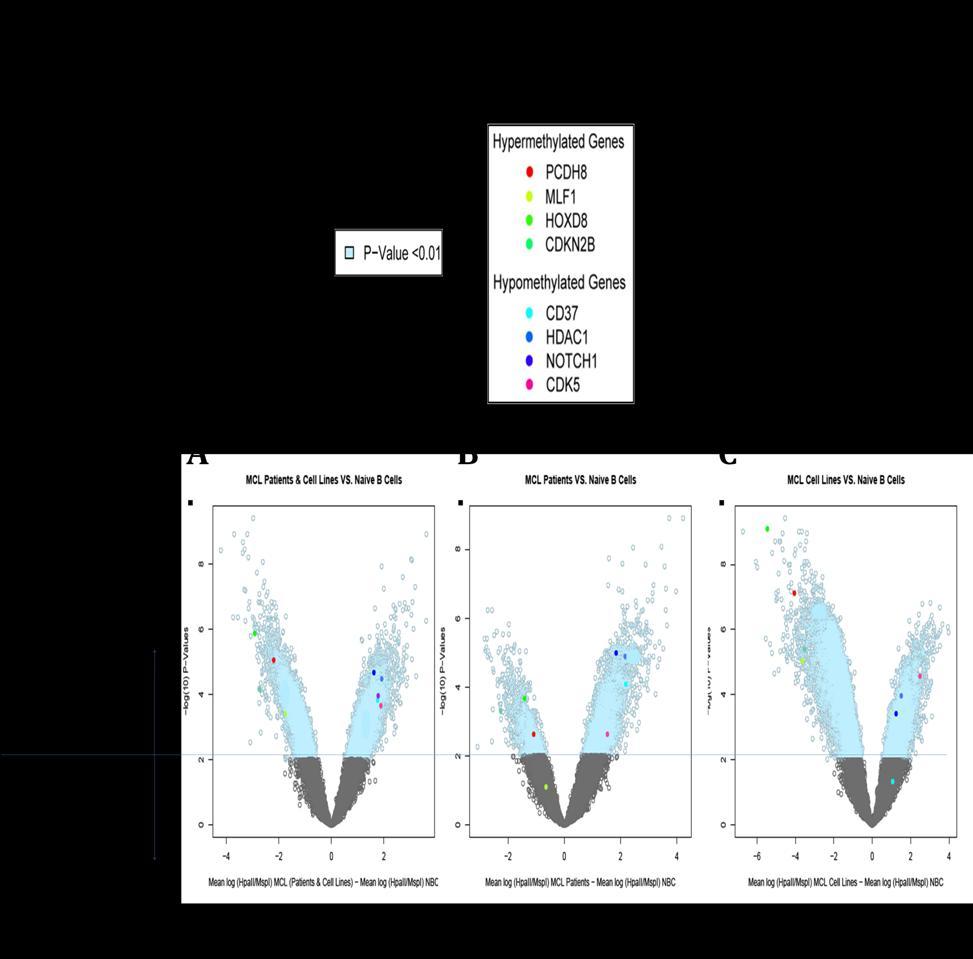
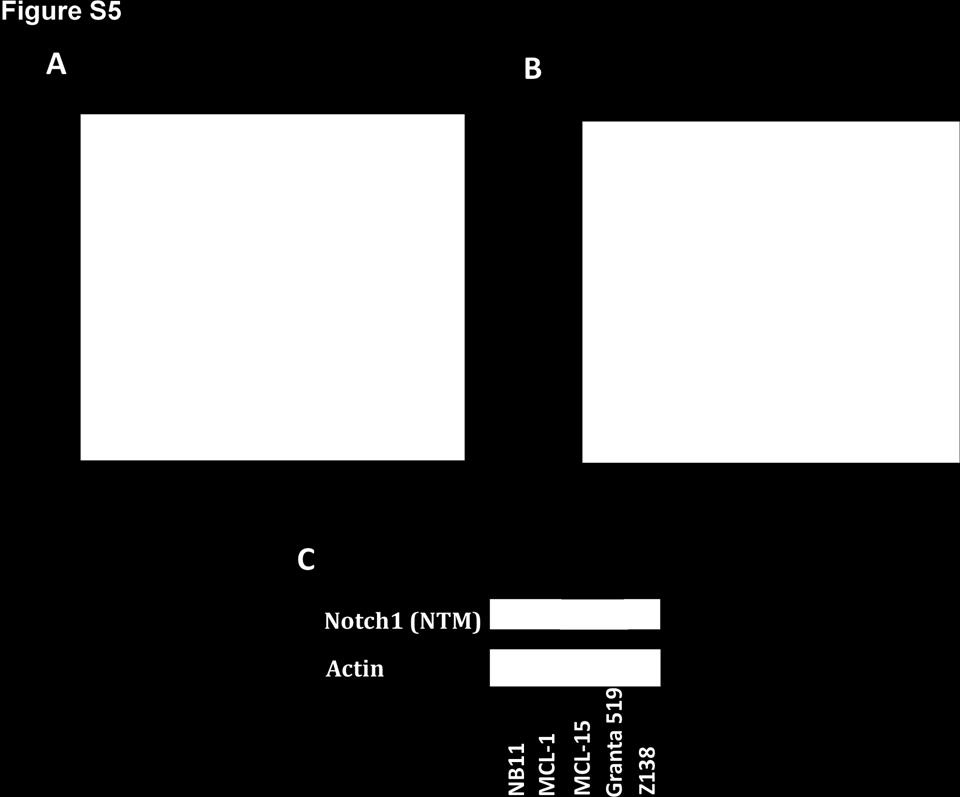
4 Decitabine 0.5 µm x 3 days, SAHA 1 µm and their combination. (E) MINO cells were treated with Decitabine 0.5 µm x 3 days and SAHA 1 µm alone and in combination. Cell viability (Y axis) as measured by reduction of resazaurin 48 hours after drug treatment (performed in 8 replicates). Figure S4. Subset analysis of methylation differences in MCL patients and MCL cell lines. (A) Plot of methylation difference (X axis) vs. Significance (on Y axis) showing selected differentially methylated loci between MCL patients and cell lines as compared to NBCs. Probe sets that were differentially methylated are marked in blue (p<0.01). (B) Plot of methylation difference (X axis) vs. Significance (on Y axis) showing selected differentially methylated loci between MCL patients as compared to NBCs. Probe sets that were differentially methylated are marked in blue (p<0.01). (C) Plot of methylation difference (X axis) vs. Significance (on Y axis) showing selected differentially methylated loci between MCL cell lines as compared to NBCs. Probe sets that were differentially methylated are marked in blue (p<0.01). Six genes: PCDH8, HOXD8, CDKN2B, CDK5, HDAC1, NOTCH1 met the threshold for differential methylation (p<0.01) in both patients and cell lines (Figure S4A) while CD37 and MLF1 were exceptions. Cell lines seemed to be more hypermethylated as compared to patient samples, consistent with previous reports 1. Figure S5. Gene and Protein Expression in MCL patients and cell lines compared to NBCs. RT- PCR for mrna expression of MLF1 (A) and HOXD8 (B) in NBC samples compared to MCL patients and cell lines samples. Three NBC, three MCL patients and four MCL cell lines samples were used for the assay. Data is representative of two separate experiments. Error bars indicate SD. (C)
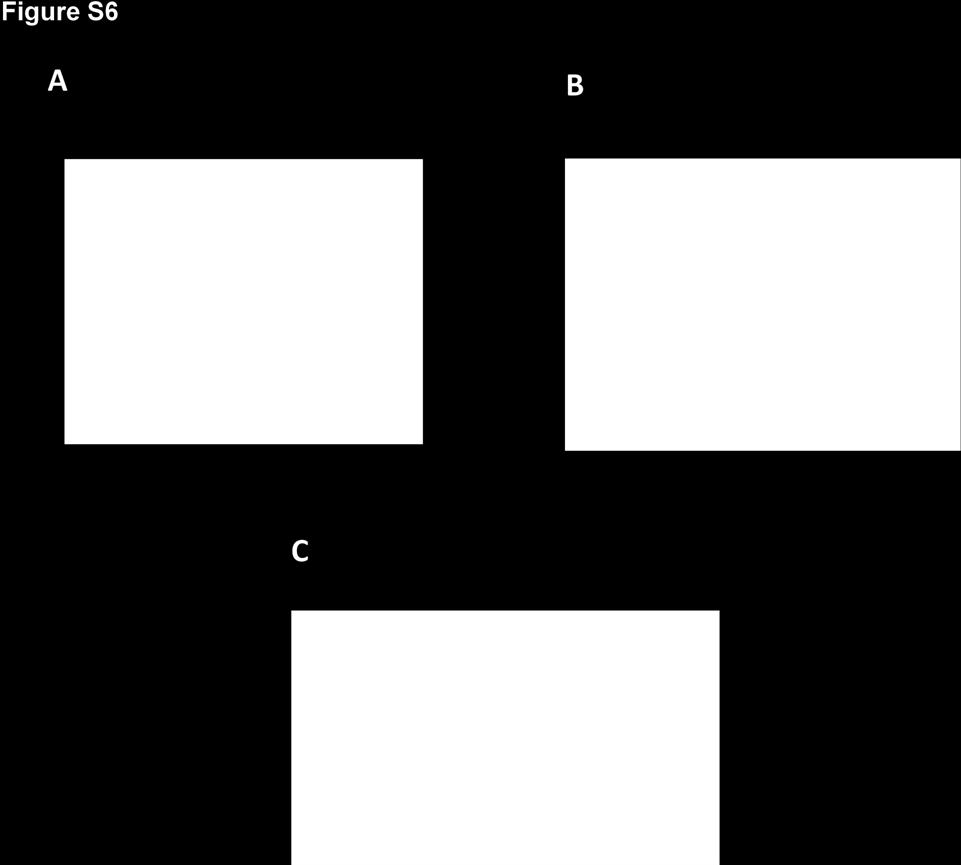
5 Western blot for protein expression of Notch1 transmembrane / intracellular region (NTM) in 1 NBC, 2 Patients and 2 cell lines (Granta 519 and Z138) along with actin as a loading control. Figure S6. Cytotoxicity assays for three MCL lines treated with DAC and SAHA alone and in combination. HBL2, MINO and Z138 cells were treated with SAHA (single dose on day 0) (A) and DAC daily during 3 days (B) alone and in combination. (C) Cell viability (Y axis) as measured by reduction of resazurin 48 hours after drug treatment (performed in 8 replicates). REFERENCE: 1. Paz MF, Fraga MF, Avila S, et al. A systematic profile of DNA methylation in human cancer cell lines. Cancer Res. 2003;63(5):
6
7
8
9
10
11