Next Generation Genetics: Using deep sequencing to connect phenotype to genotype
|
|
|
- Steven Cameron
- 5 years ago
- Views:
Transcription

1 Next Generation Genetics: Using deep sequencing to connect phenotype to genotype Korbinian Schneeberger


2 Connecting Genotype and Phenotype Genotyping SNPs small Resequencing SVs* (1001genomes.org) CNVs* indels* epialleles Genetic GWAS Mutant sequencing QTL and QTL-seq mapping mapping Phenotyping stress resistance growth disease resistance metabolites expression levels plasticity *indel = insertion or deletion; SV = structural variant; CNV = copy number variant


3 Arabidopsis thaliana 1001 Genomes Project Well studied model organism Homozygous 120 Mb genome Wide range of phenotypic differences High levels of polymorphisms Koornneef et al., Plant Biology 2004


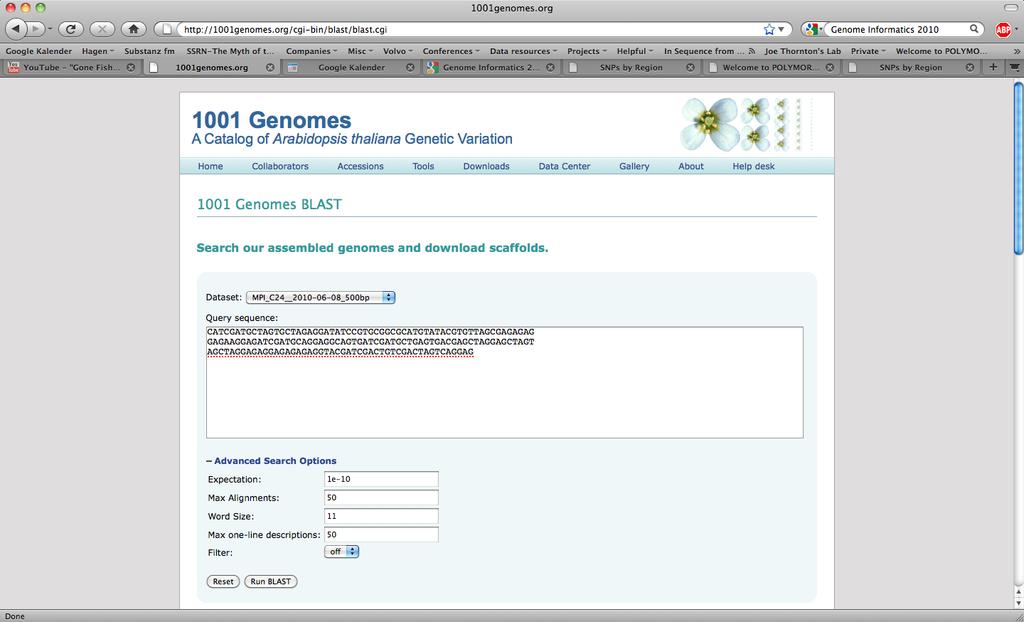
4 1001 Genomes Project: Survey of Existing DNA Variants Goal: To discover the whole-genome sequence variation in 1001 strains of the reference plant Arabidopsis thaliana. Main contributors: Joe Ecker September 2010: 100+ genomes done Magnus Nordborg Todd Michael Richard Mott Detlef Weigel


5 SHORE: Short Read Analysis Pipeline Ossowski, Schneeberger et al. Genome Research 2008 Schneeberger, Ossowski et al. Nat. Methods 2009


6 Whole genome assembly pipeline Reference Blocks Superblocks Superblock assemblies Contig assembly Remapping: Correcting errors and bridge contigs Scaffold assembly
7 Whole genome assembly of common lab strains Homology-guided assembly of 4 genomes * : Bur-0, C24, Kro-0, Ler-1 Bur-0 C24 Kro-0 Ler-1 Scaffolds N L kb 273 kb 163 kb 272 kb Longest scaffold 1.12 Mb 2.18 Mb 1.48 Mb 1.09 Mb Coverage 83x 75x 73x 322x * Excluding centromeres
8 Whole genome assembly of common lab strains Homology-guided assembly of 4 genomes * : Bur-0, C24, Kro-0, Ler-1 Bur-0 C24 Kro-0 Ler-1 Scaffolds N L kb 273 kb 163 kb 272 kb Longest scaffold 1.12 Mb 2.18 Mb 1.48 Mb 1.09 Mb Coverage 83x 75x 73x 322x * Excluding centromeres
9 Whole genome assembly of common lab strains Homology-guided assembly of 4 genomes * : Bur-0, C24, Kro-0, Ler-1 Bur-0 C24 Kro-0 Ler-1 Scaffolds N L kb 273 kb 163 kb 272 kb Longest scaffold 1.12 Mb 2.18 Mb 1.48 Mb 1.09 Mb Coverage 83x 75x 73x 322x 2 Mb of Sanger sequencing: Error rate less than 1 in 10,000 bases * Excluding centromeres


10


11 Background correction pinpoints mutation Mb Differences to reference sequence Number of changes: 5691 total 4023 High quality 531 Within genes 1 Not in 1001 genomes Wild type Mutant Laitinen et al, Plant Phys, 2010


12 Conventional genetic mapping F 0 F 1 F 2 Schneeberger, Ossowski et al. Nat. Methods 2009

13 Conventional genetic mapping F 2 Individuals Parent 1 Final Mapping Interval Parent 2 Schneeberger, Ossowski et al. Nat. Methods 2009
14 Conventional mapping vs. bulk segregant F 2 -Pool Marker positions Schneeberger, Ossowski et al. Nat. Methods 2009
15 Map-seq: Simultaneous Mapping and Mutant ID Marker position Marker position reference genome Schneeberger, Ossowski et al. Nat. Methods 2009
16 Conventional mapping vs. bulk segregant F 2 -Pool Parent Parent Schneeberger, Ossowski et al. Nat. Methods 2009


 10 15 18.")
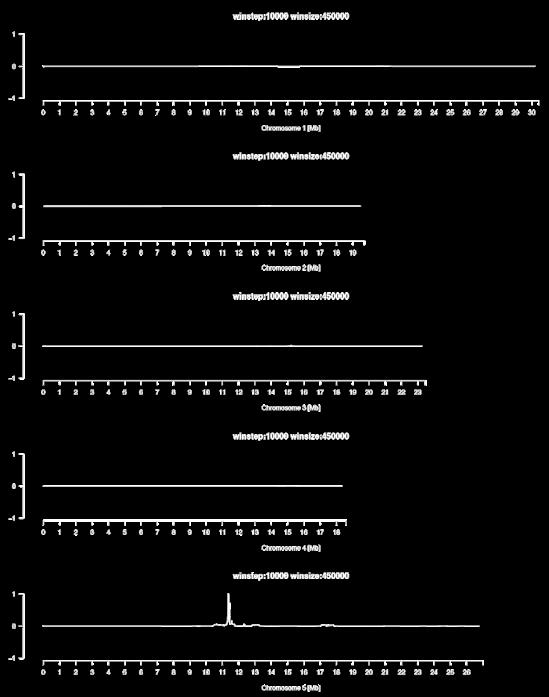
17 SHOREmap: Visualizing the allele ratio Chr 1 Chr 2 Chr 3 Chr 5 Chr kb sliding window 500 recombinants pooled ~20x coverage ~2000 independently sampled chromosomes per window Peak estimation Allele ratio: R = 1 / ( 1 obs / exp) Mb Schneeberger, Ossowski et al. Nat. Methods 2009
18 Map-seq: Simultaneous Mapping and Mutant ID Marker position Marker position reference genome Schneeberger, Ossowski et al. Nat. Methods 2009

19 Map-seq: Simultaneous Mapping and Mutant ID Marker position Marker position reference genome Schneeberger, Ossowski et al. Nat. Methods 2009

20 EMS-induced Point Mutations Near Peak bp to peak Mutation Reads Gene ID Effect 410,887 C > T 16 intergenic 410,885 C > T 15 intergenic -4,035 This C > project T only 16 took 8 working AT4G35090 days AA change -242,211 C > T after DNA 17 was extracted... intergenic -306,904 C > T 5 AT4G35900 AA change -430,814 and would now cost less than 2,500 Euro. C > T 10 AT4G36195 intron But still F2s need to be generated. W>STOP S>N A>T W>STOP W>STOP 16,703 Mb 16,702 Mb 16,701 Mb Schneeberger, Ossowski et al. Nat. Methods 2009


 X X F1 DM1 DM2")
")
21 SHOREmapping in more complex scenarios Er-0 DM1/- ; DM2/- Col (Col-0 bkg.) X X F1 DM1 DM2 suppressor DM1/- ; DM2/- ; sup (Er-0) Rowan et al., in preparation BC1


22 Map-seq background: 3:1 suppressor: 1:1 Col:Er-0


23 QTL-seq: Chlorosis phenotype Number of Individuals Extreme population (Here: 153 plants pooled) Expression of chlorosis Parents F2: Laitinen et al., in preparation


24 QTL-seq: Chlorosis phenotype Laitinen et al., in preparation