Introduction to. BD FACSAria TM Cell Sorter. Flow = Fluid Cyto = Cell Metry = Measurement
|
|
|
- Aldous Preston
- 5 years ago
- Views:
Transcription

1 What is Flow Cytometry? Introduction to BD FACSAria TM Cell Sorter Flow = Fluid Cyto = Cell Metry = Measurement BD Biosciences Application Specialist 產品應用專員 Daisy Kuo 郭正佼 A variety of measurements are made on cells, cell organelles, and other objects suspended in a liquid and flowing at rates of several thousands per second through a flow chamber. Particle Size Detection range: 0.5~40 m What Can a Flow Cytometer Tell Us About a Cell? Its relative size (Forward Scatter FSC) Its relative granularity or internal complexity (Side Scatter SSC) Its relative fluorescence intensity


2 Scatter Light Lysed Whole Blood Laser FSC Sensor Side Scatter Neutrophils SSC Sensor Forward Scatter Monocytes Lymphocytes Fluorescence Light Fluorescence
")


 Principle of FACS BD FACSAria")
3 Applications FACS: Fluorescence-Activated Cell Sorter Phenotype Analysis (Cell Surface Antigens/Markers) Intracellular Analysis -- Eg. Cytokines, Signal Transduction molecules etc. Developed by Prof. Leonard Herzenberg, Stanford University, 1974 DNA Analysis -- Eg. Viability, Cell cycle, Apoptosis etc. Cell Fuction Analysis -- Eg. Free radicals, Ca 2+, Reporter genes etc. CBA (Cytometric Bead Array) Principle of FACS BD FACSAria Cell Sorter The combination of 3 technologies: 1. Hydrodynamic focusing 2. Fluorescence detection 3. Ink-jet technology Drop Drop generation Charging


4 FACSAria II Upgrade Subsystems Feature Benefit Simplified fluidics Easier and efficient aseptic sort setup Integrated nozzle Faster workflow because of increased ease of use New nozzle design Reproducible drop profile after every nozzle exchange New Sort Block Plate design offers more efficient and reproducible deflection Redesigned tube holders Easier to maintain aseptic conditions when handling sort tubes Automated Accudrop Makes drop delay determination even easier and more accurate Field upgradeable option Enables customers with preconfigured BD FACSAria sorters to upgrade to the latest technology to meet their current and future application needs 375-nm laser Enables the side population application on preconfigured BD FACSAria and BD FACSAria II 13 Fluidics To introduce and focus the cells for interrogation. Optics To generate and collect the light signals. Electronics To convert the optical signals to proportional digital signals, process the signals, and communicate with the computer. Fluidics Cart: Upgraded Sample Input: Upgraded Pressurized sheath tank (10L) Level sensor allows use of 95% of tank volume Pressurized ethanol shutdown tank (5L)


5 Sample Input Sample Path Automatic cleaning Temperature control (4, 20, 37, 42 C) Software-controlled agitation Sample Flow: Hydrodynamic Focusing Optics sheath flow sample flow sheath flow Excitation optics Lasers Lenses to shape and focus the laser beam laser beams Collection optics A collection lens to collect light emitted from the article-laser beam interaction A system of optical mirrors and filters to route specified wavelengths of emitted light to designated optical detectors


6 Excitation Optics Collection Optics Laser Wavelength Commonly Used Fluorochromes (nm) or Dyes Blue 488 nm FITC, PE, PE-TxRed, PE-Cy7, PerCP, PerCP-Cy5.5, PI Red 633 nm APC, APC-Cy7, APC-H7 Near UV 375 nm Hoechst, DAPI Upgraded Collection Optics Octagon and Trigons Collection Optics Optical Filters
 Interfaces with the computer for data transfer Performs sorting")
7 Collection Optics Octagon and Trigons Configuration NUV (375-nm NUV laser) LP Electronics Creation of a Voltage Pulse Converts analog signals to proportional digital signals Computes area and height for each pulse Performs compensation, calculates ratios, and calculates width Laser Volts Pulse Height Pulse Width Time (µs) Interfaces with the computer for data transfer Performs sorting decisions, including gating, conflict resolution, and drop charging


8 Quantification of a Voltage Pulse Data Storage Histogram (1 parameter) Event 1 Event 2 Event 3 List-Mode Data Time FSC SSC FITC PE , , ,271 30, ,688 6,189 Dot Plot (2 parameters) 39,271 FITC FITC 89 PE ,621 PE Data Display Linear v.s Log Linear Scaling Log Scaling Volts Voltage Pulses 0.1 V Time Volts 0.4 V Time Volts 1.2 V Time Volts 4 V Time Volts 8 V Time

9 Linear v. Log Amplification Compensation Theory Emission Spectra: Spectral Overlap 100% Pacific Blue AmCyan FITC PE PI APC PerCP PerCP-Cy5.5 PE-Cy7 Linear amplification is usually used for light scatter parameters and DNA analysis. Log amplification is used for fluorescence signals with a large dynamic range. Normalized Intensity 0% Wavelength (nm) 800 Spillover FITC Spillover FITC 530/30 PE 585/42 PerCP-Cy /40 PE-Cy7 780/60 FITC 530/30 PE 585/42 PerCP-Cy /40 Relative Intensity Relative Intensity Wavelength (nm) FITC PE PerCP-Cy5.5 PE-Cy7 36 Wavelength (nm)
10 FITC Compensation FITC Compensation FITC 530/30 PE 585/42 PerCP-Cy /40 To lower cluster, increase value. Relative Intensity FITC 530/30 PE 585/42 PerCP-Cy / Wavelength (nm) Relative Intensity Increase values Wavelength (nm) FITC Compensation Compensation Examples To lower cluster, increase value. Incorrect Compensation Correct Compensation Undercompensation Overcompensation FITC 530/30 PE 585/42 PerCP-Cy /40 Relative Intensity Wavelength (nm) 39 40


 Use different setting to generate drops 5.")
11 Data Analysis: Sort Gates Sorting Theory Sorting Nozzles 3. Charged droplets break off. 2. Charge is applied via the stream-charging wire. 1. Sample generates light scatter and fluorescent signals; signals are analyzed. 4. Deflection plates attract or repel charged droplet. 70, 85, 100 or 130 m for different cell sizes (Cell size <= 1/6 Nozzle Size) Use different setting to generate drops 5. Uncharged droplets pass to waste. 6. Charged drops containing particles of interest are collected. Upgraded


12 New Nozzle Design and Sizes Drop Formation Features 4 sizes: 70, 85, 100, and 130 micron Integrated O-ring New nozzle and flow cell fitting Benefits A larger variety of cell sizes can be sorted Increased application flexibility No need for user installation Very easy to install a nozzle reduced need for user expertise Consistent drop profile interrogation point breakoff Drop Charging Drop Delay drop delay interrogation point breakoff BD FACS Accudrop technology Diode laser Camera Optical filter Accudrop beads + + Time Waste


13 Sweet Spot Automatic amplitude adjustment to keep the stability of drop formation -- Stream monitoring -- Clog detection Sort Layout Devices 2 or 4 way Multiwell Plates Upgraded Slides Custom Devices Precision mode Yield Purity Single cells 4-Way Purity Custom Purpose for Cell Sorting Applications


14 Sorting by Morphology Live or Dead Sorting Viable White Cells 10 to 14 m Neutrophil 8 to 10 m Lymphocyte 15 to 20 m Monocyte Sorting Viable Monocytes Sorting for GFP + Cell Line Before Sorting After Sorting 6% 94%

 Sorting CD4 + CD25 dim/+ CD127")
15 Phenotype Analysis Lymphocyte Subset Peripheral White Blood Cells CD45 + Monocytes Monocytes Lymphocytes Granulocytes Neutrophils Ligand Receptor Adhesion molecule etc T Helper T T Cytotoxic CD3 + CD4 + CD3 + CD8 + B CD3 + CD3 - CD19 + N K CD3 - CD16 + CD56 + Basophils Eosinophils Regulatory T Cells (Treg) Sorting CD4 + CD25 dim/+ CD127 -/dim


16 Sorting for Treg Three Color-staining for Defining and Sorting Mouse LSK Bone Marrow Stem Cell Before Sorting After Sorting Lin - C-Kit LSK 0.7% LSK 97% C-Kit Sca-1 Side Population (SP) Method Background of SP First published by Goodell MA., 1996
 membrane pump Shows like an hook when")

17 Hoechst Phenotype of SP Cells Excite best by UV laser Supravital minor groove-binding DNA stain with AT selectivity Uptake by live cells As DNA indicator on Flow Cytometry Efflux Hoechst dye via ABC (ATP-Binding Cassette) membrane pump Shows like an hook when displayed simultaneously at 2 emission wavelengths (Hoechst Blue/Red) + Verapamil (ABC inhibitor) Phenotype of Murine SP Cells Cancer Stem Cells Hoechst Blue 0.05% IgG-PE Hoechst Red IgG-FITC 9.9 c-kit FLT Sca-1 Sca-1


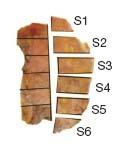
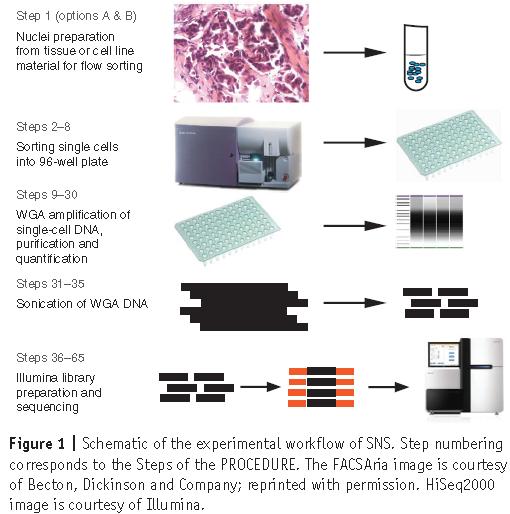
18 Tumor Tissue Analysis Single cell omics Very rapidly moving Single Cell Sorting Single Cell qpcr, PCR or WGS 1. Reveals intracellular differences in a heterogeneous population 2. Cell of interest are very difficult to obtain/isolate 3. Averaging effects of a pooled population Tumor macrodissected into 12 sectors, and nuclei were isolated from six sectors and flow-sorted by ploidy. FACS profiles show four distributions of ploidy), which were gated to isolate 100 single cells. Navin et al 2011 Nature Single cell workflow Thank you!