The Facts Of Friction In The Supply Chain And How To Effectively Remove It
|
|
|
- Amberlynn Horton
- 5 years ago
- Views:
Transcription


1 November 12-14, 2017 Bellagio Resort, Las Vegas The Facts Of Friction In The Supply Chain And How To Effectively Remove It Mark Brousseau Editor of Special Projects Institute of Finance & Management (IOFM) Olaf Weidhaas Vice President, Strategic Account Relations Tungsten Network

2 What is Friction?


3 Manual paper-based invoice processes create friction that: Friction Numerous processes in the financial world remain tedious and time consuming when they needn t be. It is surprising that in this day and age businesses are still spending so many hours per week managing a process that could be automated. Richard Hurwitz CEO, Tungsten Network Wastes time Wastes money Creates risk Limits ability to be strategic

4 Every business has friction in its P2P cycle
5 Significant Percentage of Companies Anticipate Increased P2P Complexity Significantly less complex 14.6% Slightly less complex 31.8% Unchanged 8.3% Slightly more complex 37.6% Significantly more complex 7.6% Source: IOFM Future of Accounts Payable Survey

6
7 Eliminating P2P Friction HIGH PROPORTION OF PAPER INVOICES RECEIVED
8 How P2P Staff Spend their Time Analysis work 16% [CATEGORY NAME] [PERCENTAGE] Best-in-class finance organizations spend 20% more time on analysis work than their peers, PwC finds Source: IOFM
9 PAPER and Lack of Digitization What percentage of your annual invoice volume is in the form of paper documents, fax or attachments that require manual handling? <10%, 1.2% 10-25% 11% 26-50%, 4.9% %, 62.2% 51-75%, 20.7% Source: IOFM
10 Annual Number of Invoices Per FTE 19,889 22,756 8,600 10,938 1,350 3,600 Low Level of Automation High Limited Automation Moderate Automation Significant Automation Source: IOFM 2017 Benchmark Study
11 Cost Per Invoice $8.78 $6.92 $5.81 $4.76 $3.41 $2.87 $2.44 $1.77 Low Limited Automation Level of Automation Average Cost Per Invoice Moderate Automation High Significant Automation Source: IOFM 2017 Benchmark Study


12


13 Source: IOFM


14 Cost Reduction & Productivity Obstacles
15 P2P Departments are Investing in Process Standardization & Automation No investments 13.1% Compliance and security 45.7% Finance talent 20.0% Process standardization 61.1% Innovation 24.0% Automation 59.4% Source: IOFM Future of Accounts Payable Survey
16 ELIMINATING P2P FRICTION TOO MANY NON-PO BASED INVOICES

17

18 Aligning AP & Procurement "Strong" Collaboration With Budget Holders 47% With Suppliers 60% With Accounts Payable 62% Between the CPO and the CFO 71% Source: Ardent Partners


19 The High Cost of Poor Alignment Best-in-Class Companies are Reducing Purchasing Costs (Per Order) Peer Top Performer $16.71 $15.98 $18.00 $10.04 $6.45 $ Source: The Hackett Group

20 Procurement Priorities 42% 39% 33% 28% 27% Savings Processes Compliance Innovation People Source: Ardent Partners
 technology 53% Earlier engagement of sourcing opportunities 66% Source: Ardent")
21 Procurement Priorities Better team execution 44% Better communication plan 48% Larger and/or more talented staff 53% New (or improved) technology 53% Earlier engagement of sourcing opportunities 66% Source: Ardent Partners
22 Eliminating P2P Friction HIGH VOLUME OF SUPPLIER INQUIRIES
23 AP Will Become More Collaborative with Enterprise Functions None of the respondents believe that AP will be less collaborate with other functions. Unchanged 19% Significantly more collaborative 29% Slightly more collaborative 52% Source: IOFM Future of Accounts Payable Survey

24 Suppliers See Collaboration as Critical Suppliers Are Already Betting On Improved Technology 74% of suppliers expect to increase their level of investment in billing technology 21% by more than 10% 53% of suppliers say increasing their use of electronic invoicing is a priority in managing their customers over the next 12 months Their highest-ranked customer priority A Forrester Consulting Thought Leadership Paper Commissioned By Tungsten Network. March Supplier Networks Enable Innovative And Streamlined Supply Chains

25


26 Nationwide Insurance: A case study


27 Mohawk Industries: A case study
28 Eliminating P2P Friction LACK OF AUTOMATED EXCEPTIONS
 Number of invoices processed per FTE per month Duplicate/erroneous payments Percentage of invoices processed straight through")
29 Most Important P2P Metrics Discounts not taken (lost discounts) Number of invoices past due (backlog) Reducing monthly accrual amount Compliance and audit preparedness Forecasting payables working capital Cost per invoice % Invoices requiring problem solving (re-work) Number of invoices processed per FTE per month Duplicate/erroneous payments Percentage of invoices processed straight through Staying within the AP budget Paid on time percentage Days Payables Outstanding (DPO) 3.8% 3.8% 3.8% 3.8% 5.0% 6.3% 6.3% 7.5% 7.5% 8.8% 12.5% 13.8% 17.5% Source: IFO

30 17% OF THE TYPICAL COMPANY S INVOICES CAUSE EXCEPTIONS. Source: Ardent Partners
31 Reasons for Invoice Exceptions Missing tax amount, ID number, PO number or zip code Wrong price and/or quantity No requestor name, contact data, contract and/or PO No matching invoice and purchase order data Incorrect spelling of company name No order confirmation, or shipping notice Net amount exceeds sub-total or invoice total exceeds contract amount
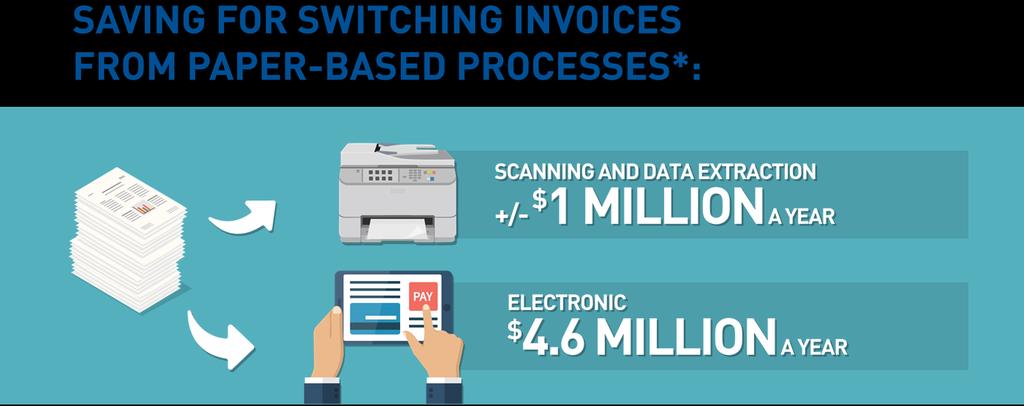
32 Invoice Exceptions & Errors Eliminating paper-based processes: Slow, error-prone, paper-based processes are being phased out in favor of electronic and web-based solutions, which enable more efficient workflows throughout the purchase-to-pay lifecycle. For example, 70% of top performers use e-invoices, compared to just 19% of peers.


33
34 Eliminating P2P Friction LACK OF AUTOMATED APPROVAL
35 Best-in-Class Versus The Rest Efficiency Metrics Pay on Time Rate: >90% Process nearly 23,000 invoices annually per FTE At an internal cost of $1.77/per invoice Effectiveness Metrics PO First-Pass Match: 90% Share of Invoices Requiring Correction: 1% Frequency of Duplicate Payment: <1% Capture 97% of earlypayment discounts Source: IOFM 2017 Benchmark Study
36 Organizations That Pay > 90% of Their Invoices On Time 46% 46% 53% 55% 37% 35% PO Non-PO Limited Automation Moderate Automation Significant Automation Source: IOFM 2017 Benchmark Study
37 Time to Process a Single Invoice 46% 28% 14% Under 5 days 10 to 15 days 15 to 30 days 30 days or more 6% Source: Ardent Partners
38 Best-in-class performers will process a single invoice within 3.5 days while the majority of companies will take 12 days to process a single invoice. Source: Ardent Partners 2017


39 The Problem with Long Cycle Times 40


40 Agnico Eagle strikes gold and accounting visibility Enters 20,000 more invoices per year without adding any headcount Achieved 80% invoice throughput rate Validation time of 1 minute per invoices What s next? Implementing solution in Finland, United States and Vancouver Rolling out Invoice Staus Service
41 How To Remove The Friction

42 A complete product solution Eliminates paper from the invoicing process Increases the efficiency and accuracy of accounts payable Improved Supplier communications and reduced Supplier inquiries through Invoice Status Offers cross-border payments in local currency at competitive rates Currency Conversion Invoicing Services Invoice Data Capture Tungsten Network receives all invoices (electronic, paper, ) and captures data Lower cost per invoice Little to no impact on invoice submission methods Eliminate the energy and materials wasted in sending paper invoices Reduce your Day Sales Outstanding Reduce the time and cost of your invoicing process E-billing \\\ Invoice Financing Workflow Purchase Order Services Facilitates the delivery, acceptance, variation and conversion of Purchase Orders into invoices Automates accounts payable processes Allows suppliers to decide when to get paid Maximizes working capital Analytics Provides an audit of purchasing from the point of order to payment Optimizes procure-to-pay to achieve business goals Provides visibility into purchases, leading to better informed spending Improves procurement controls Ensures compliance with contracts and reduces costs

43 Strategic contribution Reducing friction in your P2P process is transformational Transparent spend Agility and scalability for business enablement Efficiency improvement Cash and working capital management AP cost reduction Provider capability in driving network effect

44 Find more information and opportunities to begin your journey!
45 THANK YOU!