UW-IT Metrics. Fiscal Year July 2013
|
|
|
- Duane Francis Brown
- 5 years ago
- Views:
Transcription
1 UW-IT Metrics Fiscal Year 2013 July 2013
2 Table of Contents OVERVIEW 1 UW-IT SERVICE AREAS 2 1. FINANCES 3 INTRODUCTION... 3 METRICS... 3 UW-IT ANNUAL BUDGET BY SERVICE COSTS... 3 UW-IT FY 2013 FUNDING BY SOURCE SUPPORT FOR STRATEGIC GOALS 5 INTRODUCTION... 5 UW-IT STRATEGIC PLAN: KEY GOALS... 5 STRATEGY MAP... 6 METRICS... 7 PROJECT ALIGNMENT WITH UW-IT STRATEGIC GOALS... 7 SPECIFIC PROJECTS THAT SUPPORT UW-IT S STRATEGIC GOALS CUSTOMER SATISFACTION 10 INTRODUCTION METRICS CUSTOMER SATISFACTION SURVEY: OVERVIEW OF RESULTS CUSTOMER SATISFACTION RATING BY SERVICE AREA PROJECTS SUPPORTING SERVICE UPGRADES OR ENHANCEMENTS TEN HIGHEST AND TEN LOWEST ACTION PLAN EMPLOYEE SATISFACTION 20 INTRODUCTION METRICS EMPLOYEE ORGANIZATIONAL PULSE SATISFACTION SURVEY ACTION PLAN PEER BENCHMARKING 23 INTRODUCTION METRICS AND 2012 EDUCAUSE CORE DATA PEER COMPARISONS IT FUNDING, BUDGET AND COSTS THE IT ORGANIZATION IT IN SUPPORT OF TEACHING AND LEARNING IT OPERATIONS AND INFRASTRUCTURE INFORMATION SECURITY
3 Overview This report provides FY 2013 metrics for UW Information Technology (UW-IT) that measure our organization s performance in five key areas: 1. Finances 2. Support for Strategic Goals 3. Customer Satisfaction 4. Employee Satisfaction 5. Peer Benchmarking The report is part of UW-IT s commitment to measuring and improving performance as an essential way of ensuring that we are fulfilling our mission to: Enable UW students, faculty and staff to be more effective Help the UW manage risks and resources Foster a community of innovation A further goal of this report is to ensure transparency and accountability. This report represents an initial step toward providing metrics for UW-IT. We will continue to enhance and refine these metrics over time to provide a meaningful measure of UW-IT s performance. These metrics are also available on UW-IT s Web site at uw.edu/uwit/metrics/index.html For more information on UW-IT see: UW-IT s Web site: uw.edu/uwit UW-IT s 2012 Annual Report: uw.edu/uwit/reports/uwit_annual.report_2012.pdf 1
4 UW-IT Service Areas Accessible Technologies Administrative Systems Backups and Mass Storage Cable Television Campus Software Licensing Data Centers and Facilities Data Networks , Calendaring, and Collaboration Tools Emergency Preparedness and Business Continuity Enterprise Portal Identity and Access Management Information Security and Privacy IT Consulting Managed Servers and Workstations Office of the Vice President and CIO Student Technology Fee Funded Initiatives Teaching and Learning Tools Technology Spaces and Labs Telecommunications Services UW Support for UWTV and KEXP Web Publishing 2
, the Technology Recharge Fee, allocations from the Student Technology Fee and from UW-IT s")
5 1. Finances Introduction UW-IT manages an annual budget of approximately $80 million to provide support to the University community through the service areas listed below. Funding comes from centrally allocated General Operating Fund and Designated Operating Fund (GOF/DOF), the Technology Recharge Fee, allocations from the Student Technology Fee and from UW-IT s self-sustaining services. UW-IT is committed to using our resources efficiently and effectively to meet the present and future needs of the UW community, and to providing transparency and accountability in our use of resources. Metrics UW-IT Annual Budget by Service Costs UW Information Technology Fiscal Year 2013 annual budget: $82,619,076. The following table shows UW-IT s FY 2013 annual budget allocated to service areas (listed by cost).* 3

6 UW-IT FY 2013 Funding by Source 4
7 2. Support for Strategic Goals Introduction UW-IT s strategic plan, IT Strategies for Discovery, identifies seven key goals to support UW-IT s mission and meet the University s current and future information technology needs. Connecting UW-IT s priority projects to our strategic goals is key to ensuring that our organization is focused on the right priorities in support of the University. This section shows how current UW-IT projects support our strategic goals. UW-IT Strategic Plan: Key Goals 1. Excellent infrastructure and foundation services: Deliver highly functional, reliable and invisible infrastructure that just works and doesn t get in the way 2. Advanced productivity and collaboration tools: Enable easy, secure collaboration with partners at the UW and beyond 3. Improved global research support: Support UW research with up-to-date tools and resources 4. Improved student experience: Provide technology to support and improve the learning experience 5. Modern information management and business systems: Provide modern, flexible and integrated business information systems; access to better business information for planning and analysis 6. Business continuity, security and privacy: Support UW s risk management and compliance objectives 7. An exemplary organization: Strive for operational and organizational excellence via best practice methodologies (e.g., ITIL, LEAN, Agile), and a culture of service 8. Strong strategic partnerships: Nurture deep partnerships with key vendors, regulators, stakeholders, and national collaborators 9. A culture of exploration and sharing: Demonstrate that curiosity, innovation, and giving back to the community are valued by the organization For details see: IT Strategies for Discovery: UW-IT Strategic Plan FY

8 Strategy Map This strategy map shows how UW-IT s vision, mission and strategic goals support the mission of the University. 6


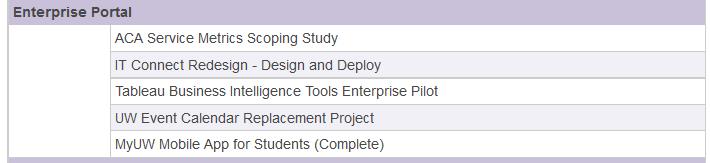
9 Metrics Project Alignment With UW-IT Strategic Goals The graph below shows the percent of UW-IT priority projects that support each key strategic goal. The projects included are active, approved or completed projects for Fiscal Year 2013, as of January Specific Projects That Support UW-IT s Strategic Goals The table below shows the specific UW-IT priority projects that support each key strategic goal. The projects included are active, approved or completed projects for Fiscal Year 2013, as of January

10 8

11 9
12 3. Customer Satisfaction Introduction Measuring and improving customer satisfaction is critical to ensuring that UW-IT is meeting our mission to enable students, faculty and staff to be more effective. UW-IT strives to be the partner and provider of choice for the UW community. Toward that goal, UW-IT engaged an external consultant to conduct a customer satisfaction survey in May The full report is available on UW-IT s Web site: The survey of 2,100 randomly selected students, faculty and staff was conducted by MOR Associates, an external consultant with expertise in developing satisfaction surveys for IT organizations in higher education. The following provides: An overview of the 2011 survey results Customer satisfaction ratings by service area FY 2013 active, approved, or completed priority projects focused on service upgrades or enhancements, by service area (for FY 2012 upgrades and enhancements, see the archive) Graphs that show the ten highest and ten lowest customer satisfaction ratings Our action plan: key FY 2013 projects that address the lower-scoring areas Metrics 2011 Customer Satisfaction Survey: Overview of Results The response rate to the customer satisfaction survey was high: 35 percent (745 responses). Scoring was on a satisfaction scale of 1 to 6, with 6 being the highest. UW-IT overall ratings: UW-IT s overall quality of services was rated 4.88 (mean score), with 94 percent of all respondents at least somewhat satisfied. UW-IT s responsiveness to customer needs was rated 4.86, with 91 percent of respondents at least somewhat satisfied. Areas rated highly: The reliability and availability of the wired network had the highest ratings for a major service, at 5.20 and 5.18, respectively. Also highly rated were UW-IT s main help service (help@uw.edu), with scores in three key areas ranging from ; and telephone customer service, with two services rated 5.00 and Areas receiving lower scores: Lower-scoring areas included wireless network reliability rated at 4.69; UW (Alpine deskmail) at 4.50; wireless network (Wi-Fi) coverage at 4.47; and cellular coverage at More info: UW-IT Customer Satisfaction Survey Report 10
13 Customer Satisfaction Rating by Service Area This table shows UW-IT customer satisfaction ratings by service area.* The data is from a May 2011 Customer Satisfaction Survey of 2,100 randomly selected students, faculty and staff conducted by MOR Associates, an external consultant. Ratings are on a six-point satisfaction scale with six being the highest. For more details, see Section 3. Customer Satisfaction. To read the full report, see: UW-IT Customer Satisfaction Survey Report. Service Area Service Item Rating Accessible Technologies & Resources Administrative Business Systems Data Networks Collaboration Tools Enterprise Portal Mary Gates Hall Access Technology Center (ATC) 5.00 HR/Payroll 4.69 Finance 4.40 Enterprise Data Warehouse Reporting 4.39 Student Administrative 4.38 UW Data Network Overall 4.92 Wired Network Reliability 5.20 Wired Network Availability 5.18 Wired Network Speed 5.10 Wi-Fi Network Speed 4.79 Wi-Fi Network Reliability 4.69 Wi-Fi Coverage Area 4.47 UW Google Apps for UW Windows Live for UW Exchange 4.77 UW (Alpine, Deskmail) 4.50 UW Google Apps for Collaboration 4.95 Catalyst Web Tools for Collaboration 4.63 UW Windows Live for Collaboration 4.56 MyUW Portal Reliability
14 IT Consulting & Training Technology Spaces and Labs Telecommunications Services Web Publishing MyUW Portal Features 4.88 MyUW Portal Quality of Content 4.85 MyUW Portal Ease of Use 4.67 Overall 4.93 NOC Overall 4.89 Nebula Overall 4.28 Catalyst Help Overall 4.77 Odegaard Learning Commons Help Desk Overall 5.16 Telephone Customer Service Overall 4.93 Videoconference Studios 5.21 Odegaard Technology Studios 5.12 Suzzallo Collaboration Studio 4.89 Odegaard Learning Commons 4.38 UW Desktop Telephone Services Overall 4.83 UW Cellular Coverage Overall 4.20 students.washington.edu 5.23 staff.washington.edu 5.03 faculty.washington.edu 5.00 courses.washington.edu depts.washington.edu 4.86 Google Sites 4.74 Catalyst Tools for Web Publishing 4.67 * Note that not all UW-IT service areas are represented by the customer satisfaction survey. 12

15 Projects Supporting Service Upgrades or Enhancements This table shows active, approved or completed priority projects for FY 2013 that are focused on service upgrades or enhancements, by service area. 13

16 14

17 15

18 Ten Highest and Ten Lowest The tables below show the services with the ten highest and ten lowest customer service ratings. Reading the Charts The following example shows how to read the charts for the UW-IT services. 16

19 Services With the Ten Highest Customer Satisfaction Ratings 17

20 Services With the Ten Lowest Customer Satisfaction Ratings 18
21 Action Plan This table shows key UW-IT projects and other efforts underway, as of February 2013, to improve services in the lower-scoring areas. Customer Satisfaction Area UW Cellular Coverage (overall) Projects and Other Efforts Underway to Improve Satisfaction Improved cellular coverage (working with AT&T, T-Mobile, and Verizon) Mobile Web Framework IT Connect Web Site (ability to find what you need, with a mobile device) Wi-Fi Coverage Area UW (Alpine, Deskmail) IT Connect Redesign UW Medicine Wi-Fi Capacity & Coverage Enhancements (Phase II) Wi-Fi Technology Refresh for FY 2013 Google Apps Microsoft Office 365 Catalyst Web Tools (for collaboration, Web publishing) Canvas Learning Management System Implementation SpaceScout Technology Learning Spaces 19
22 4. Employee Satisfaction Introduction The essence of any good technology organization is good people. Measuring employee satisfaction and then taking steps to enhance it is essential to attracting and retaining the caliber of staff needed to deliver highquality IT services to the UW community. Toward that goal, UW-IT measures employee satisfaction on an annual basis. The latest survey, conducted in December 2012, asked staff to provide feedback on how well UW Information Technology is doing in 16 aspects of an exemplary organization. About 35% (201 full- and part-time staff, including students) completed the survey. On average, the results continued to be positive, with only slight variations between the 2011 and 2012 surveys. Here's what has changed for 2012: Six aspects went up slightly: Appreciated/Valued Staff; Effective Leadership; Empowered Staff; Open to Input/Ideas; Experimentation, Risk-taking; and Opportunities for Development Two aspects remained the same: Pride in Work and Informed Staff Three aspects went down slightly: Clear Vision, Mission, Goals; Collaboration With Colleagues; and Challenging, Rewarding Work Also, five aspects were added to the 2012 survey: Proactive Thinking, Progressive Action; Effective, High- Quality Tools; Work-Life Balance, and Financially Stable Organization. (Comparable data is not available, but these will become the baseline for comparison in future years.) Metrics Employee Organizational Pulse Satisfaction Survey The graph on the next page shows the survey results. 20
23 Employee Organizational Pulse Satisfaction Survey,
24 Action Plan In response to the survey, UW-IT s senior leadership team developed a plan to achieve continuous improvement. Actions include: Continue to offer and improve the leadership development program launched in June 2012 Enhance UW-IT s intranet to make it a better and more useful resource for staff Develop a portal for UW-IT staff to learn about existing communities or special interest groups (SIGs) internally or across campus Host succession planning workshops for managers to help identify risks, increase bench strength, and transfer knowledge Create more tools and training for onboarding new staff Seek staff input on ways to encourage and support increased collaboration Continue to improve internal communications, including cascading of information throughout the organization 22

25 5. Peer Benchmarking Introduction UW Information Technology engages in peer benchmarking through the EDUCAUSE Core Data Service. EDUCAUSE, a nonprofit association with the mission of advancing higher education by promoting the intelligent use of information technology, conducts an annual survey with participation from more than 800 higher education institutions. This section shows key peer comparisons from the 2011 and 2012 EDUCAUSE surveys. Metrics 2011 and 2012 EDUCAUSE Core Data Peer Comparisons The following tables represent data from the October 2011 and 2012 EDUCAUSE Core Data Service Almanac Doctorate/Research Institutions (DR EXT and DR INT) reports.* The tables also show UW-IT-specific information based upon UW-IT s responses to the 2011 and 2012 surveys. The EDUCAUSE Doctoral/Research (EDUCAUSE DR) report provides data from the doctorate/research institutions that responded to the 2011 and 2012 surveys and reflects data from FY 2010 and FY The EDUCAUSE Doctoral/Research institution statistics are either an estimated proportion of the population or an estimated median (rather than a mean). IT Funding, Budget and Costs *EDUCAUSE uses the 2000 Carnegie Classification, with DR EXT referring to Doctoral/Research Universities Extensive, and DR INT referring to Doctoral/Research Universities Intensive. For more information about these classifications see 23


26 The IT Organization IT in Support of Teaching and Learning 24


27 IT Operations and Infrastructure Information Security 25