The Industry Issue: 1
|
|
|
- Mercy Montgomery
- 5 years ago
- Views:
Transcription


1 1 The Industry Issue:

2 The Business Case: From the SPE 2010 Digital Energy Workshop, Houston, TX Published by Real-Time Optimization Technical Interest Group 2
3 Impact to the Industry: Root cause failure analysis Improving system reliability Optimization & availability Maintenance data collection system Optimization of facility efficiency & energy consumption Maintaining equipment within defined operating envelopes Identify pending equipment wear-out or failure Justification for extending period between overhauls OEM machinery fleet management Capacity enhancement & capacity performance reviews 3
4 Solution: Connect Data to Experts Subject Matter Experts Reports Calls Procedures Raw data + Process Dashboard Predicative Analytic Software Data Historian Platform Systems Offshore: Production platform 4


5 The linked image cannot be displayed. The file may have been moved, renamed, or deleted. Verify that the link points to the correct file and location. New & existing sensors How it Works: Data collection & filtering Communication Uplink END TO END SERVICE: Rapid information from the sensor to the desktop Predictive Analytic Software Global view for SME 5


6 Case Study: Electric Submersible Pumps Historical SCADA tag data Shut down event Goal: Extend ESP run life from 180 to 720 days, decrease workover costs by 4% = USD$20M / year (ESP Reliability Information and Failure Tracking System 2009 Joint Industry Project) 6


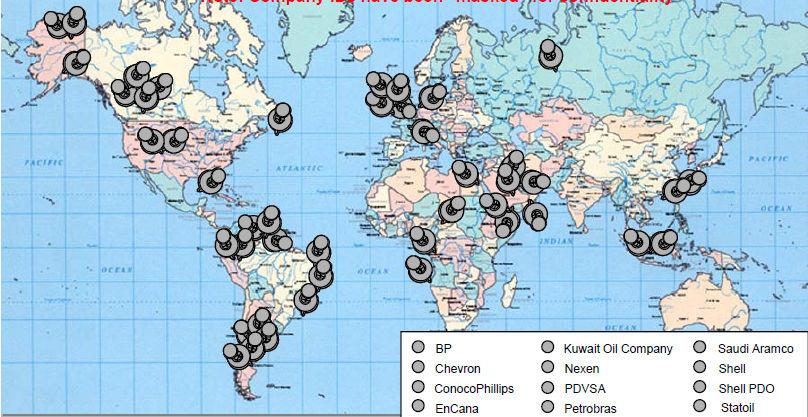
7 Industry Interest: Participants in the Project Failure Mode Analysis 7


8 Input to the Neural Network Voltage, temperature and current readings for 3 months prior to the shut down event 8


9 Training the Neural Network Cascade-forward back propagation model with three hidden layers in MatLab fourth level polynomial functions 9

10 Diagnostic Precursor Events Intervention here would have saved 8 days of downtime Pattern recognition by the neural network identified a complex series of events that did not exceed operator thresholds. Two excursions above the cubic trend line, and one below, over two months before the event. (None of the single events would have triggered a threshold alarm) 10


11 Case Study: Power Generation and Emissions High-frequency kw output and non-continuous NOX sampling time-synchronized for input to ANN Objective: Run generators at maximum efficiency without exceeding EPA NOX emission levels, predict new optimum performance parameters when rigs move to new locales. 11
 vs.")

12 Initial Predictions: Training the Neural Network First order approximation of predicted (green) vs. actual (blue) emissions over 1 week from input data. Trend and character correct but not usable for performance optimization 12

13 Avoiding a regulatory event: Operator Initiated Event: Increase in generator power Training the neural network to identify nonlinear relationships between multiple data streams to predict an event Undesired Operational Event: NOX emissions exceed EPA allowances 13
14 Refined Neural Net Output: Predictable NOX Emission Levels Input: Generator Performance Temperature Pump Performance Battery Voltage Actual vs. Predicted NOX emissions 6214 Training Sets: Mean Standard Deviation =.27 14
15 Can the behavior be predicted? Achieved Goal: Avoid NOX emission peaks above EPA tolerances by proactively adjusting engine performance Output: Predicted NOX emisions 15

16 Conclusion of the Case Study: Timeframes for this dataset: Hours to Days With historical data predictive times could be extended to weeks and months Downtime Events can be predicted from disparate input SCADA tag streams and used for operational planning and alarming before the event 16


17 17 From anywhere in the world
18 Conclusions Advantages of the new system More robust and fault tolerant operations Optimized maintenance based on predictive analytics Ease of reconfiguration with simple parameter changes Broader fault and alarm diagnostics Easy to change or add functionality at user level Graphic user interface Facilities for system supervision Avoid waiting for a crisis to make a decision 18
19 SPE Three Necessary Conditions Technology Measuring Telemetry Data handling & Access Analysis Visualization Control & Optimization Integration Training Cultural Change Management Other People Issues People Process Business Mission Integration Collaboration Other Process Issues Problem definition In adopting any new technology, it is unlikely to succeed without corresponding changes in the way we work with others and in the processes or workflow in which we perform tasks. SPE Real Time Optimization: Classification and Assessment 19
20 SPE Optimization objectives and technology application Before Integration & Automation for Optimization Control System & Actuation After Measuring Telemetry Data Well Field Before Visualization Integration & Automation for Optimization After Measuring Analysis Telemetry Discounted Cash Flow Greater NPV Accelerated Cash Flow Enhanced Production Control System & Actuation 0 Data Time Visualization Analysis Less CAPEX Break Even Time Asset Before After Measuring 3 Integration & Automation for Optimization 2 1 Telemetry Control System & actuation 0 Data SPE Real Time Optimization: Classification and Assessment Visualization Analysis 20
21 Circle s radial = Value Created for the Pilot Implementation Slotted Circle s Radial = Further Implementation Forecasted Value Arrow = Project Direction on X Magnitude of Deployment Benchmarking technology projects, which are developed in phased stages. Complexity of Solutio Organizational/Enterprise Adoption (People, Process, Ownership) SPE Real Time Optimization: Classification and 21 Assessment
22 Lessons Learned: Value calculation example 1. - Case Scenario Units Base Case RTO WCS 1 RTO MLC 2 RTO BCS Economic Assumptions Units Value No. of wells No Oil price: $/STB 25 Well Costs (Drlng, Comp. w/o WH) $/WELL 2,000,000 2,000,000 2,000,000 2,000,000 Discount Rate: %/year 8% Well Intervention Costs $/WELL 500, , , ,000 Decline Rate: %/year 10% Average Initial Production per well STB/D Tax: %/year 34% Well-head w/ monitor and control) $/WELL 150, , , ,000 Production Uptime % 80.0% 75.0% 85.0% 95.0% 3. - Benefits of Real Time Optimization (RTO) - Facility Operating Costs MM$/yr Increase monitoring and field surveilance - Payroll MM$/yr Reduce power and other utility costs - Utilities MM$/yr Increase personnel use efficiency - Transport MM$/yr Reduce deferred production with less dowtime - Technical Support MM$/yr Avoid well failures --> proactive operations - Operating Budget MM$/yr Operate at optimum field economics - Production MMSTB/yr Reduce transportation costs Variable Production Operating Cost $/STB SPE Real Time Optimization Economic Value Calculation: 20,000 STB/D from 100 Offshore Wells 4. -Economic Analysis for Base Case 5. - Economic Analysis for RTO Most Likely Case Year Production Revenue Expenses Taxes Cash Flow 4 Disc. Cash Production Revenue Expenses Taxes Cash Flow 4 Disc. Cash Year (MMSTB) (MM$) Base Case (MM$) (MM$) Flow Base (MMSTB) (MM$) MLC (MM$) (MM$) Flow MLC Economic Analysis for RTO - Worst case Sceneario 7. - Economic Analysis for RTO - Best Case Scenario Year Production Revenue Expenses Taxes Cash Flow 4 Disc. Cash Production Revenue Expenses Taxes Cash Flow 4 Disc. Cash Year (MMSTB) (MM$) WCS (MM$) (MM$) Flow WCS (MMSTB) (MM$) BCS (MM$) (MM$) Flow BCS Discounted Cash Flow (MM$) Scenario Summary Units Base Case RTO WCS 1 RTO MLC 2 RTO BCS 3 Notes: Cummulative Oil Produced (Reserves) MMSTB Net Development Costs 5 Internal Rate of Retun (IRR) Capital Investment Net Present Value (NPV) Capital Investment Efficiency Risk Analysis 8. - Discounted Cash Flow vs Time Disc. Cash Flow Base Disc. Cash Flow WCS Disc. Cash Flow MLC Disc. Cash Flow BCS Statistics Summary: Value Trials 5000 Mean 88.4 Standard Deviation 32.4 Skewness Kurtosis 2.78 Coeff. of Variability 0.37 Range Minimum Range Maximum Expenses (MM$) Expenses vs Time 20 Expenses Base Case Expenses WCS 10 Expenses MLC Expenses BCS $/STB % 12% 4.6% 14.8% 24.4% MM$ MM$ $/$ ,000 Trials FrequencyChart 29 Outliers NPV Forecast: Prob. NPV Distribution NPV, MM$ SPE Real Time Optimization: Classification and Assessment Relative Gain Base 1 WCS = Worst Case Scenario 2 MLC = Most likely Case 3 BCS = Best case Scenario 4 Includes 5 years straight Line depreciation costs 5 Drilling, Completions and Operations Relative Gains for Different Cases MMSTB $/STB % MM$ MM$ $/$ Cummulative Oil Produced RTO WCS RTO Case RTO BCS Net Operating Internal Rate of Retun Capital Investment 6 Drilling, Completions and Automation Infrastruture Cum. Dist. Function NPV Cum. Distribution Function p-10 = 44.8 p-50 = 90.6 p-90 = Net Present Value (NPV) Capital Investment NPV, MM$ All possible outcomes, from the least likely case scenario (p-10 or 10% probability of occurrence) to the most likely case scenario (p-90 or 90% probability of occurrence), are considered. Variables such as maintenance and intervention costs, wellhead costs including monitoring and control, and lumped-operating costs were considered to be independent (table 1). Assuming a normal distribution for each independent variable, Monte Carlo simulations encompassing 5,000 trials yielded the cumulative distribution function. From this experiment, it was difficult to make this project uneconomic. See Appendix B
23 Change Readiness I have access to check the results and see progress I am aware of the success criteria (metrics) for Samarang IO project I am aware of the milestones for the Samarang IO project and how my job directly impacts them I feel that my contribution and efforts in supporting this change will be recognised by management People on our team share a common sense of purpose or mission related to Samarang IO project I am encouraged and enabled by my direct supervisor to participate in IO training. Observat tional Characteristics with incre easing Maturity Level I have received Integrated Operations (IO) training so far I understand what training I will require when IO is implemented in Samarang I am aware of a Training Plan for the Samarang IO project - courses, timimg, locations etc. I have been able to discuss my concerns and ideas with management about Samarang IO I have received sufficient communication regarding the change to my role and responsibilities when A process is in place for upward communication from the workforce to IO project management. IO communication within my functional area is sufficient and informative. Management has communicated the reason for and benefits of Samarang IO projectimplemented Management recognizes what I require in order to make the change easier when IO is implemented I understand the benefits of the Samarang IO project to the organization This change will overall benefit me in performing my job I understand the changes in my role and responsibilities when Samarang IO is implemented I am aware of sufficient Resources being made avaialble to support the implementation of Senior management has visibly demonstrated its support for Samarang IO project. The strategy/vision for the future operation of Samarang has been clearly described when IO is The business reasons for the Samarang IO project have been explained. Max Readiness =.67 (Tactical) Max Resistance = 2.23 (Strategic) Strongly Disagree Disagree Neutral Agree Strongly Agree 23 0% 10% 20% 30% 40% 50% 60% 70% 80% 90% 100%
24 Change Management Phases Building a Common Vision: Strategic Initiating Change: Tactical Sustaining Change: Tactical 0% 20% 40% 60% 80% 100% Source: Kotter, 2011
25 Change Capability Maturity I (Base), Individual workflows, manual processes Current Self-Ranking = 1.42 Level II Emerging V (Optimized), Expert decision support systems, data mining II (Emerging), Decentralized, non-integrated point solutions Desired Future Ranking = 1.88 Level II Emerging IV (Proactive), Centralized, automated, standardized III (Reactive), Integrated, collaborative, measured value Change Trajectory =.46 Tactical 25
26 Change Capability Maturity I (Base), Individual workflows, manual processes Current Self-Ranking = 2.47 Level II Emerging V (Optimized), Expert decision support systems, data mining II (Emerging), Decentralized, non-integrated point solutions Desired Future Ranking = 3.87 Level IV Proactive IV (Proactive), Centralized, automated, standardized III (Reactive), Integrated, collaborative, measured value Change Trajectory = 1.4 Strategic 26
27 Survey Results Mapped to Change Management Model Change Model Critical Dimensions Leadership Communication Plan Organizational Design Metrics Training & Solution Support Percentage from survey indicating challenges and risks have been met: 27