Month End Close Valuation of AR and Revenue Analysis
|
|
|
- Garry O’Neal’
- 5 years ago
- Views:
Transcription

1 Month End Close Valuation of AR and Revenue Analysis HFMA Annual Accounting Update Great Lakes Chapter Douglas C Banks CPA, CIA, FHFMA Director Revenue Excellence Reimbursement Trinity Health January 25, 2019
2 Month End Close Valuation of AR and Revenue Analysis Introductions How many here are involved with AR Valuation at month end? Purpose Provide participants with a high-level overview of the Trinity Health models that value monthly Accounts Receivable and produce revenue analytics. Goal is to provide: Attendees not involved with AR valuation and revenue analysis basic understanding of the month end process. Attendees involved with AR valuation and revenue analysis some tips to reassess their models. 2
3 Valuation of AR and Revenue Analysis Outline of Discussion Accounts Receivable Valuation Contractual Allowances Bad Debt, Charity, and Operational Allowances Control Processes to promote accuracy. Revenue Analysis Net Revenue Budgeting Revenue Variance Analysis and other analytics 3
4 Accounts Receivable Valuation Key Considerations Risks in Valuation Approach P&L vs Balance Sheet Importance of Control Processes GL Reconciliation to Billing System and Valuation Models 5-Day Close Dependency on Billing Adjudication Process Common Valuation Issues Relationship to Revenue 4

5 Trinity Health Administrative Functions at System Office as well as regional hospitals. Strong standardization of General Ledger, reimbursement, and other financial functions. 5
6 Accounts Receivable Valuation Risks Ask an External Auditor to list the highest-risk areas when auditing the balance sheet, it will include Net Value of AR. Reasons include: Growth in fixed payments, ever changing regulatory environment, insurance contracts growing in complexity, billing errors, retrospective claims audits, etc. Overvalue AR one month, income takes a hit next month. Temptation to base revenue on budgeted rates variances are easier to explain to leadership. In a 5-day crunch, may miss issues and make mistakes. 6
7 Conversations of the Past CEO to CFO "Wow, 6 months in a row our revenue is spot on with our budget; you and your team have been doing a great job! Reimbursement Director to CFO "Hey Tom, I think we have an issue with our AR valuation being too high: AR is aging and there are some significant accounts that will likely not get paid. CFO to Reimbursement Director "No worries, we will true it up at year end, it all comes out in the wash. Audit Partner to CFO "Hey Tom, our audit revealed the AR is overvalued by $29 million, an audit adjustment is required." 7
8 Accounts Receivable Contractual Valuation Some Challenges 8
9 Accounts Receivable Contractual Valuation Some Challenges BCBSM - vouchered vs. settlement rates, pass-through pmts. Medicaid value of MACI and other pass-through. Medicare DSH, Bad Debt, outliers, and transfer cases. PFS accuracy e.g. registration & posting errors, credit balances. Capitation contracts Global payments for professional and facility services. Incentives and disincentives for contract performance. Retroactive claim reviews and denials. Population Health contracts. Increasing high deductible plans causing increasing bad debts. 9
10 Accounts Receivable Contractual Valuation Automation The Trinity Health AR Valuation models are highly automated Estimates for primary/secondary contractual, bad debt, charity and operational write offs are made at an account level Account detail summarized to create Journal Entries GL is reconciled to patient account reports By adjusting individual accounts provides ability for robust analytics of AR as well as revenue - DEMO report examples 10

11 AR Valuation Trinity Health ARWD Model: Break Down AR into Segments Allowances are estimated based on AR segment to net value for individual accounts. 11

12 AR Valuation Trinity Health ARWD Model: Break Down AR into Segments 12
13 AR Contractual Valuation Trinity Health ARWD Model: In House & DNFB Historical Percentages are used to value AR that is booked for patients still in a bed (in house), discharged and not final billed, or not run through a contract management valuation system. Using ratios that are current is critical to accuracy. Trinity Health uses 3-6 months of history at a patient type level, tiered based on minimal volumes. In aggregate, valuation using average historical % is accurate, but not at an individual account level. Examples of Risks & Need for Manual Adjustments: Rate or Price changes in past three months. Jumping tiers from one month end to another. Large dollar accounts incorrectly valued. 13

14 AR Contractual Valuation Trinity Health ARWD Model : Tiers of Historical Contractual Percentages 14
15 AR Contractual Valuation: Accounts Billed Pending Payment Contract management valuation system (CMVS) will base an account s valuation based on contract terms. Most Accurate method to value AR More than half of AR is typically valued via CMVS. Examples of valuation risks: Contract terms not loaded correctly. Patients registered under wrong contract. Subsequent denial. Flips between IP and OP (e.g. 72 hour rule, or observation criteria not met). 15
16 AR Contractual Valuation: Accounts Paid Pending Secondary and/or Patient Payment Based on experience we have learned that even though accounts have been paid, there is typically more contractual allowances booked until accounts are closed. A secondary contractual estimate is booked. Examples of causes: Flips between primary and secondary insurances. Flips between IP and OP on subsequent reviews. Secondary contractual applied by secondary payer. Secondary Contractual adjustments are automated based on historical AR and individual accounts are adjusted. 16
17 AR Contractual Valuation: Accounts Paid Pending Secondary and/or Patient Payment Question from Reimbursement team to PFS: We have a list of 20 accounts that were identified as uninsured that ended up with insurance this month. Can you explain why; are there issues with registration? Reply: No, we registered these patients with the correct insurance; however, after numerous requests via phone calls and mailings for information so insurance can be billed, we change their status to uninsured. All charges are then billed to the patient. They typically will then call back and provide the needed information. 17
18 AR Contractual Valuation: Credit Balances Majority of patient accounts with credit balances are a result of incorrect posting. Once corrected, it typically result in booking contractual. Automated Adjustment: Apply historical % is creating a positive secondary contractual adjustment. 18
19 AR Contractual Valuation: Medicaid Pending Uninsured patients that may qualify for Medicaid are labeled as Medicaid Pending. Automated Adjustment: Using history to determine a percentage, apply to Medicaid Pending AR creating secondary contractual adjustment. 19

20 AR Contractual Valuation: Accounts Paid Pending Secondary and/or Patient Payment The following report excerpt shows summary of individual account adjustments rolled up by payer and patient type: 20
21 AR Contractual Valuation: Non Patients Non Patient AR defined: clinical services provided such as physicals, drug screening, but the patient is not billed. These services are billed to an employer or institution that contracted for the services. Risks: Not typically programmable in CMVS and historical % is not developed as only one bill a month sent, typically requires manual review and adjustment. 21
22 AR Contractual Valuation: Series/Recurring Patients Definition: Patients that may come in several times a week for oncology or other services and typically billed monthly. CMVS systems may not accurately value and thus historical percentages are used in the Trinity Health automated model. However, given complexity and diversity of services, manual reviews are performed resulting in adjustments. 22
23 AR Valuation Trinity Health Model: Bad Debt, Charity and Operational Write Off Allowances Bad Debt, Charity. and Operational allowance ratios are updated monthly using a rolling 12 months of closed cases. Ratios developed are at the payer, patient type Allowances applied to each patient account and limited in total do not cause a negative account balance. Operational Write Offs are based on historic ratio to charges 23
24 AR Valuation: Bad Debt, Charity and Operational Write Off Allowances Bad Debt and Charity allowance ratios are determined based actual write-offs/ Patient Payment Obligation (PPO) PPO = Total Charges (Contractual + Payments + Refunds + Operational + other adjustments) Patient Payment Obligation Ratio = PPO / (Total Charges Actual Contractual - Actual Operational) See Example of Report -- 24
25 AR Valuation: Bad Debt, Charity and Operational Write Off Allowances Key Considerations: Determine ratios with most current data Evaluate monthly changes in allowances to identify trends, potential valuation risks Watch for inventory build-up of unreported denials Large Manual Adjustments Contractual and BCO allowances have an inverse relationship 25

26 Accounts Receivable Valuation Control Processes 26
27 Accounts Receivable Valuation Control Processes Strong control processes will help avoid mistakes and protect integrity of the AR valuation. In the 14 year history of using Trinity Health standard AR valuation models, has never been an external audit adjustment or management letter comment related to the valuation of AR. 27
28 Accounts Receivable Valuation Control Processes Examples Twelve Month Trend showing Valuation % s Twelve Month BCO Trend Analysis with reasons for changes High Dollar Claims Review Review of AR Exception Detail accounts under 10% contractual, over 90% contractual Review and investigate Re-Evaluations accounts paid differently than the prior month estimate. 28
29 Accounts Receivable Valuation Control Processes Examples Pre-close meetings with PFS to identify issues Reconcile AR in General Ledger to Billing System Reconcile Balance Sheet and Income Statements to Models (including patient detail) Secondary Reviews Checklists Revenue Analysis 29

30 AR Valuation Control Processes: 12 Month AR Trend of Allowance % 30
31 AR Valuation Control Processes: 12 Month AR Trend of Allowance % Use trend reports to identify significant changes that should be investigated further. Consistency provides confidence that models are working. Reports and analysis based on automated adjustments to patient detail, should also review trending of manual adjustments, i.e., for pass-through settlement accruals. 31

32 AR Valuation Control Processes: 12 Month BCO Trend of % 32
33 AR Valuation Control Processes: High Dollar Claim Review Set a threshold of claims over, e.g. $100K. Summarize claims detail in report by highest to lowest, by payer and patient type to review each account or category of accounts for reasonable valuation. Patient accounts with questionable valuation can be investigated further using billing details including PFS notes and transactions posted. 33
34 AR Valuation Control Processes: Account Re-Evaluations Re-Evaluations = patient accounts that are paid differently from the prior month estimated value. Investigate and determine root causes for reevaluations is a Control Process, i.e., identifying incorrect contract terms loaded in CMVS. Determine adjustments to AR valuation Revenue variance to budget explanations. 34
35 AR Valuation Control Processes: Account Re-Evaluations Re-evaluations are accounts paid at a different amount than prior month estimate. BCBS Commercial Domestic M edicare P ublic Aid ublic Aid P endin Uninsured Gross Charges - w/o Re-eval. Less: Contractual Current Month $1,470,017 $2,656,452 $210,062 $11,067,734 $931,427 $204,972 $334,940 $16,875,604 -$789,127 -$1,225,286 -$62,089 -$7,709,932 -$554,843 -$3,363 -$20,264 -$10,364,904 Less: Total Contractual - Re-evaluation -$43,420 -$8,579 -$22,680 -$30,822 -$57,714 $3,740 -$159,475 Net Revenue $637,470 $1,422,587 $125,293 $3,326,979 $318,870 $201,609 $318,416 $6,351,225 Examples causing re-evaluations: Flipping from one primary payer to another, or from inpatient to outpatient. Contract Management Valuation System not programmed correctly. Changes in DRG / APC assignment when paid. Medicaid Pending accounts that are approved for Medicaid. Accounts that use history instead of a contract management system. Patient Accounting changes or process issues, e.g. a double posting of a contractual on the last day of the month that reverses the next month. 35

36 AR Valuation Control Processes: Use of Checklists Monthly Checklists are used and reviewed by managers. External auditors will request copies as proof control procedures are being followed. 36
37 AR Valuation Control Processes: PFS Pre-Close Review PFS Pre-Close Meetings: Discuss current issues with accounts and month end activities. Example of a Pre-close meeting agenda: Level of Payer Denials assessment of any growth Audit Notifications from CMS or Third Party Payers Cash Report and Remittance Issues Large & At Risk Accounts Aging Profile Bad Debt and Charity e.g. clean-up efforts, hold backs Payer Issues Changes in Business Operations, e.g. lack of resources to work accounts 37
38 AR Valuation Control Processes: Reconciliations Billing system AR = AR in the general ledger AR patient detail reports = summary AR reports used for making JEs. Billing transactions summarized and reconciled to GL balance sheet and income statement (AR-GL Report). After all JEs are booked, reconciliation of AR and revenue performed to ensure entries have been made properly and agree to SMC Template (Trinity Health Model). 38
39 AR Valuation Control Processes: Revenue Variances to Budget Understanding revenue variances to budget can shed light to AR valuation issues. When there is a month that revenue is down compared to budget avoid the witch hunt to create revenue when AR is properly valued Focus analysis on root causes and business intelligence that decisions can be based and revenue forecasts can be adjusted. 39
40 AR Valuation Control Processes: Minimize Risk of Errors caused by 5-Day Crunch Automate where ever possible Keep General Ledger simple Minimal GL accounts e.g. payers. Use billing system data to build reports for revenue analysis. GL accounts segregated between journal entries and billing system transactions for easier reconciliation process. Determine accruals and adjustments before Month End: Create one-month lag for pass-through estimates Late Charge accruals updated twice a year not monthly Avoid completing unnecessary schedules: Assess what is needed at month end; determine schedules to eliminate or the can be done after month end 40
41 Revenue Analysis Key Considerations Revenue in the income statement is primarily based on: 1) billing and charge transactions, and 2) the valuation of AR. Once the AR is properly valued and billing & charge transactions are reconciled, that is most of the revenue. Create analysis to determine root causes and business intelligence. Explain revenue variances to budget in a meaningful way that leadership can understand and base decisions: Starts with creating a revenue budget based on billing history. Variance Metrics = Volume, Payer Mix, Case Mix, and Rate. 41
42 Revenue Analysis Key Considerations (continued) Revenue analytics include identifying: Trends leading to adjusting forecasts, e.g. Surgical Group that opens new surgery center and takes higher paying patient population to their surgery center. Hospital is faced with diminishing revenue due to decreasing commercial payer population and higher proportion of Medicaid and indigent care. Potential coding issues Payer contracting issues Charge capture issues 42
43 Revenue Analysis Starts with Revenue Budget Trinity Health Approach Build a revenue budget based on historical billing detail: Comparing actual to budget can be: Analyzed at a detailed level by account, service line, and insurance contract. Done to improve understanding of trends and changes that are occurring in operations. Trended/Forecasted for case mix, payer mix and other details. Provides robust analytics that lead to more accurate revenue forecasts. 43
44 Revenue Analysis Starts with Revenue Budget Trinity Health Approach The NRB Application was developed with the following goals: Provide a flexible tool based on claims history. Be user friendly and time efficient. Top down (by payer, service line, DRG) or bottom up using patient detail. Support multiple budget iterations for what if scenarios with real time change impacts. Ability to download data at any level to excel spreadsheets. Net revenue not gross charges is used to create revenue budget. Create robust analytics to understand revenue. Strong controls (consistent, reliable, predictable results). Use Standards for all hospitals including service lines. 44
45 Revenue Analysis Starts with Revenue Budget Trinity Health Approach Step #1 Most current claims (paid and valued) Step #2 - Project current year net revenue Step #3 Develop next fiscal year budget Step #4 Analyze variances Hospital Selects historical period of patient claims Reconciliation of valued claims to the general ledger Annualize most current claims (paid and valued) Adjust rates, volumes, payer mix, severity Hospital decides at what level to project (payer, service line, DRG level, etc ) Adjust rates, volumes, payer mix, severity Hospital decides at what level to budget (payer, service line, DRG level, etc ) Generate standard reports to analyze actual versus budget variances Utilize drill down capability to review detail level variances 45
46 Revenue Analysis Starts with Revenue Budget Trinity Health Approach The model can accommodate a large number of assumptions for forecasting and sensitivity analysis. Primarily a case based tool providing expected net revenue by each discharge. Assumption Input Level Price Rate Payor mix Case mix / severity Volume / patient activity Patient type, service line Patient type, service line, DRG Functions at payor ICO groups Change mix of volume at DRG level Change mix of volume by service line Inpatient DRG level Outpatient patient types 46

47 Revenue Analysis Starts with Revenue Budget Trinity Health Approach Service line Level of Input 47

48 Revenue Analysis Starts with Revenue Budget Trinity Health Approach Input at DRG Level 48
49 Revenue Analysis Trinity Health Approach Because revenue budgets are based on billing detail, revenue analytic applications can be more robust and provide insights to various levels, including service line and payer contracts. Revenue variances are first determined at a high level by payer class into the following categories: Volume Payer Mix Case Mix Rate (hardest one to explain) 49
50 Revenue Analysis Trinity Health Approach Excel Model by Payer and Patient Type Revenue 12-Month Trend by Payer Payer Mix & Net Revenue Revenue Business Intelligence (RBI) Dashboard Benchmarking hospital revenue performance Service Line & Payer Levels Revenue Variance Analysis (RVA) Report Detailed analysis of Variances to Budgets, Prior Periods to contract, and DRG level. Provides a Discharge View based on whole cases, and Posted view based on posting date to GL. 50

51 Revenue Analysis Excel Model 51


52 Revenue Analysis Revenue 12 Month Trend Due to limited space on slide, does not show that the rest of report that has charges, contractual provisions, net revenue, discharges, case mix, and payer mix. It is produced based on revenue posted as well as whole discharge cases (minimize distortion caused by re-evaluations and in house variances) 52

53 Revenue Analysis Revenue 12 Month Trend in RBI 53

54 Revenue Analysis RBI 54

55 Revenue Analysis RBI 55

56 Revenue Analysis RBI 56

57 Revenue Analysis RVA Volume Analysis 57

58 Revenue Analysis RVA CMI Analysis 58

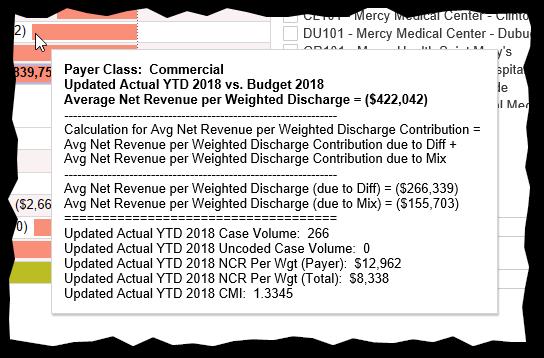
59 Revenue Analysis RVA Rate Analysis by Service Line 59
60 Revenue Analysis Summary Explaining revenue variances related to volume, case mix and payer mix can be easy. Determining net revenue per case variances can be much harder, and include some of following root causes: Volume of Outlier cases used in budget vs actual. Transfer Case volumes to reduce DRG payments. In house volume variances that are buried in Rate. Re-Evaluations of prior month cases. 60
61 Valuation of AR and Revenue Analysis: Summary and Tips Simplify General Ledger and align to Valuation Models for efficient reconciliations. Good Communication with PFS. Controls vital to ensure accuracy and No Surprises : Trust with Verification. Revenue Analytics provides business intelligence that aids management in understanding: 1) current and future revenue, and 2) needed course changes and/or operational changes. 61


62 Questions & Summary 62