Using GIS-aware EPM tools to Improve Asset Optimization
|
|
|
- Austen McCoy
- 5 years ago
- Views:
Transcription

1 Using GIS-aware EPM tools to Improve Asset Optimization Adam Tonkin Senior Consultant
2 Introduction Provide an understanding of:- Enterprise Performance Management (EPM) How utility systems integrated with a GIS better serve EPM Using an example focusing on the areas of distribution reliability and maintenance planning, to improve Asset Optimization
3 What is Enterprise Performance Management? EPM provides the ability to measure the performance of an enterprise by consolidating metrics from processes and their supporting systems A blending of business architecture and technical architecture Employs business processes Employs dashboards Employs integration technologies (EAI / ETL etc.) And combines all three
4

5

6
7 EPM - Overall Process Monitoring and Improvement EPM Display Ad-hoc Reports Batch Displays EPM Repository RDBMS Defines Workflow Rules Loads Integration Technology Process Engine Schedules EAI ETL Monitors Integrates Collects I & M Asset Information GIS Operational Systems Reliability/ Load Information OMS AMR Network Data OTHERS? ERP WMS MWM CIS IVR DPS GWD Field Inspection Engineering Design SCADA & Emergency Repair Remote Reading
8 How is this relevant to Utilities (Electric/Gas)? Utilities can make excellent use of EPM tools:- A large amount of process-intensive work Customer service / construction / emergency A large amount of labor-intensive work CSRs, Crews (Service, constructions, emergency) A large amount of technology-intensive work Operations-related systems (OMS,MWM,WMS,IVR)
9 Building an EPM Example We ll follow these steps: Establishing our vision What is our goal? Implementing the vision How do we get the data? Extracting value from the information How do we obtain benefit from our results?
10 Establishing our Vision How do we select our Key Performance Indicators (KPIs)? What types of benefits do we hope to achieve? Reliability improvement? Cost reduction? Customer satisfaction? Management visibility? What do we expect as a result? Who is looking? Immediate decisions? Strategic changes? Can we measure against a target? Past performance? Benchmarks? Compliance? Measuring against expected benefits of initiatives?
11 Establishing our Vision (Cont.) Example Utility focus areas:- Asset Performance - Managing the asset lifecycle for the lowest total cost of ownership KPIs:- Reliability, system utilization, Safety & Env. Incidents Operational Efficiency Reducing the time and cost that it takes to perform the work itself KPIs: Crew utilization, average operations & maintenance cost per circuit mile/customer
12 Establishing our Vision (Cont.) What other relationships to data add value? Time (Trends, historical value) Location (of assets, crews) In our example - Location (through integration with GIS) relates to: The serviceability of an asset The relationship to customer growth (and therefore load) Operating practices within that area Different network design, age and condition Physical geography and atmosphere (e.g. Sea salt corrosion, vegetation)
13 Establishing our Vision (Cont.) Using that relationship, we can identify potential relationships between our KPIs for service reliability (e.g.,saifi/caidi) versus: The types of maintenance being performed in that area The frequency of maintenance being performed in that area The load on assets in that area Weather and geography Number of crews (normalized by area) and location of service centers This type of information can be used to better position and plan maintenance Improving reliability and reducing cost and increasing Asset Optimization
14 Implementing the Vision Data is extracted using EAI,ETL tools. But which systems? For our Asset Effectiveness KPIs: SAIFI/CAIDI Monthly extracts from OMS (Location from GIS) System utilization - Weekly extracts from AMR, Substation Automation,TLM and SCADA (Location from GIS) Safety and environmental incidents Weekly extracts from WMS,OMS, I&M, MWM
15 Implementing the Vision For our Operational Efficiency KPIs: Crew utilization Weekly extracts from various systems (MWM, WMS, I&M, OMS) Average O&M cost per circuit mile (and/or customer) - - Monthly extract from I&M System for cost data, WMS for repair work and with GIS data providing mile summary and total customer number
16 Implementing the Vision Like any (and all) technical implementations, there are issues to consider and risks to mitigate What technology to use? Significant to this nature of project are the following:- Architecture of source systems Missing keys/links between data Mismatch of the freshness or currency of data Difference in data resolutions Separate operating companies Manual entry of data
17 Extracting Value from the Information How do we represent the information? What s the most important attribute regarding the KPI? The actual value? (Numeric amount with color code) Trend? (Graph, Gauge, Stock ticker ) Making up a whole? (Chart) We can also use a GIS to thematically map data
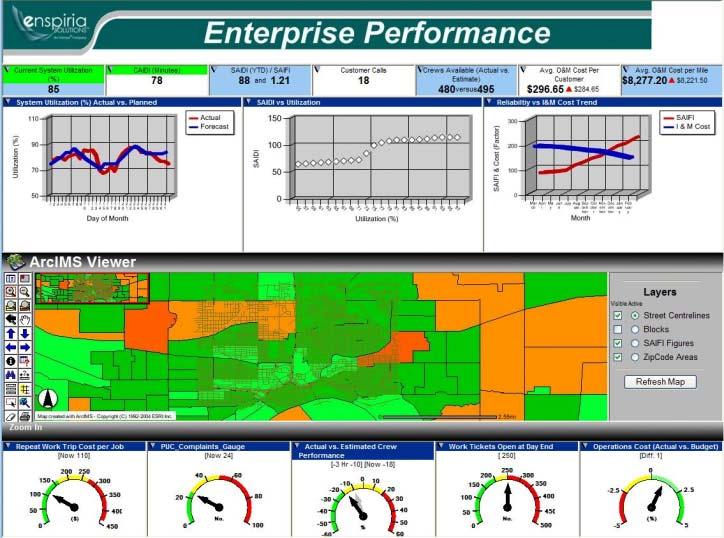
18
19 Extracting Value from the Information What other factors can impact the benefit of a EPM? Aligning the targets with responsibilities/accountability Ensure the correct people have access to data they have control over (In our case, Operations Manager) Define action plans or workflows to be invoked automatically What takes place when? Can we be proactive? ( /Page/IVR?)
20 Summary Warehouse/ Data marts and Dashboards have existed for some time Often application specific Do not necessarily take data from different systems or processes Within this presentation we ve discussed (at a very high-level) The purpose/architecture of EPM Used some traditional utility back-office systems as example source systems, and shown how data integrated with GIS can used to potentially improve Asset Optimization
21 Q & A Atonkin@enspiriasolutions.com