OSIS Users Guide WUSM OSIS USERS GUIDE. This guide is intended to help you begin using OSIS for monitoring and tracking space
|
|
|
- Violet Jacobs
- 5 years ago
- Views:
Transcription
1 OSIS Users Guide WUSM OSIS USERS GUIDE This guide is intended to help you begin using OSIS for monitoring and tracking space 0


. Also includes emergency contact information for departments and buildings. 3.")

2 Information in OSIS by the Systems of Record OSIS Online Spatial Information System The School of Medicine has been working diligently to enhance the space management process and supporting technology programs. In support of this initiative, a new Space Management application called Archibus was purchased and implementation has started. The Business Intelligence piece of the system is called OSIS. Archibus and OSIS will manage space, provide business intelligence and deliver critical information for emergency response. 1. Annual Space Survey: All information entered by departments during the annual space survey. This includes: Information at the room level that describes the type of room, type of work performed in the room, whose is in the room, grants performed in the room. 2. HR System: Employee name, title and work location (No salary information). Also includes emergency contact information for departments and buildings. 3. Financial System: Grant spending by grant fund number. 4. OSIS: Fields added which includes lab quality rating, year built, original building architect This new system is a central repository for facilities to track critical information associated with space from University systems of record. This is a web based system that you can access anytime, anywhere Information is pulled from the University systems of record and refreshed on a daily basis The system will be accessible using your WUSTL Key login Reports in development for Rent for Space & Bench Space Analysis OSIS Login 1. Open web browser Internet Explorer 7 or greater Firefox 3.5 or greater Safari Google Chrome 2. Navigate to 3. Enter your WUSTL Key ID and password, and click Login, or hit enter 1
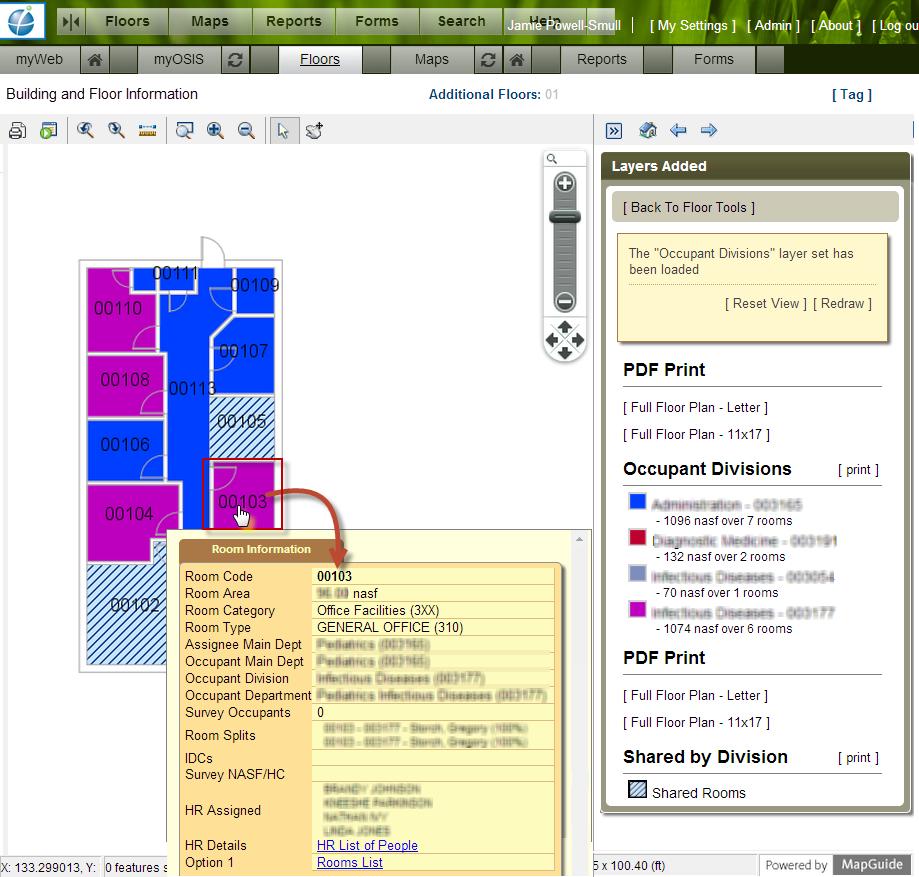
3 MyOSIS is your default dashboard giving you access to Pods and Widgets displaying selected grouped information with interactive links for additional drill down. Widgets are enabled with summary reports and charts for quick information analysis. Most include links to the supporting data. Floors Every floor within WUSM buildings for which an AutoCAD drawing exists is displayed in OSIS. Floor Tools Hover Reports When you move your mouse over a room on the floor plan, a dialogue box appears displaying specific room information, and links to additional reports. When you move your mouse away, the dialogue box disappears. Space survey that is performed annually is captured in the hover report as well in the Survey Occupants. HR Assigned displays who specifically is in the room. The list of people that have been assigned to the floor and entered into HRMS display when the HR details link is clicked. Option 1 provides the rooms list of each room listed on the floor with the room type, IDC code, square footage, etc. 2
4 3


5 Layer Sets Layer sets are pre-defined queries that give you the flexibility to view a floor plate from different perspectives. The below is an example of the layer set Rooms By Type note that the rooms are highlighted by type. Reports OSIS has a number of preset Space reports designed to present tabular data, summary bands, and charts. Reports can be accessed from myosis pods and widgets, floor plans and from the Report tab. The reports are designed so that data can be filtered, sorted, and exported. If there is a report that you would like but do not see please contact wusmspace@wusm.wustl.edu or myosis Pod The detail of the Pod display is available in report form. 1. From myosis click on the expand icon of a selected pod. 2. The selected report will open in a new window. 4
 Note: Everything in blue font is a hyperlink to drill down into more detail. 3. Depending on the complexity of the report detail OSIS will: a. Open the report in a new window. b. Report Quick Filter displays in a new window.")
6 myosis - Widget The detail of the widget information is available in report form. 1. Scroll to the bottom of selected widget 2. Click blue link (s) Note: Everything in blue font is a hyperlink to drill down into more detail. 3. Depending on the complexity of the report detail OSIS will: a. Open the report in a new window. b. Report Quick Filter displays in a new window. Reports - Tab 1. Click Reports from the main menu. 2. From the left navigation pane, click the expand icon to see the reports for each category 3. Click report name 4. Depending on the complexity of the report detail OSIS will: a. Open the report in the center viewing pane. b. Report Quick Filter in the center viewing pane. Quick Filter Some reports contain so much detail that it is best to filter down to the exact data points before creating the report. Depending on the type of report and data you will see filter choices such as, but not limited to: Allocated Main Department Room Type Category Building Main Department Building Code 5
7 Glossary Dashboard: User interface that, somewhat resembling an automobile's dashboard, organizes and presents information in a way that is easy to read. Pod: Displays one number for key indicators or metrixs. Widget: Displays selected grouped information. Interactive links for additional drill down. Enabled with summary reports and charts for quick information analysis. Main Department: High level of roll up for a department. Main Department Division Section Department 6