Investor Review. May 2017
|
|
|
- Mercy Arnold
- 5 years ago
- Views:
Transcription

1 Investor Review May 2017
2 Forward-Looking Statements This presentation contains forward-looking statements reflecting our current expectations that involve risks and uncertainties which are subject to safe harbors under the Securities Act of 1933, as amended, or the Securities Act, and the Securities Exchange Act of 1934, as amended, or the Exchange Act. These forward-looking statements may include, but are not limited to, statements concerning our plans, objectives, expectations and intentions, future financial position, future revenues, projected costs, expectations regarding demand and acceptance for our technologies, growth opportunities and trends in the market in which we operate, prospects and plans and objectives of management. The words anticipates, believes, estimates," expects, intends, may, plans, projects, will, would and similar expressions are intended to identify forward-looking statements, although not all forward-looking statements contain these identifying words. We may not actually achieve the plans, intentions or expectations disclosed in our forward-looking statements, and you should not place undue reliance on our forward-looking statements. These forward-looking statements involve risks and uncertainties that could cause our actual results to differ materially from those in the forward-looking statements, including, without limitation, the risks set forth in Part II, Item 1A, Risk Factors in our Quarterly Reports on Form 10-Q and in our other filings with the Securities and Exchange Commission. We do not assume any obligation to update any forward-looking statements. 2


3 Significant Value Creating Opportunity Large market shifting toward Vocera Market leader with compelling ROI Large wins validate sales strategy Software acquisition extends platform Accelerating toward target financial model *Earnings before interest, taxes, depreciation and amortization, and further excludes stock -based compensation and change in fair value of warrant and option liabilities. **Represents the high end of the company s guidance range 3

4 Healthcare Communication Challenges 69% of accidental deaths and serious injuries in hospitals are caused by communications breakdowns 1 92% of physicians use unsecured SMS text for patient care, leading to data breeches and HIPAA violations resulting in over $1.5M in fines per year $12 billion wasted annually In U.S. hospitals as a result of communication inefficiencies 2 Efficient communication is a primary component in driving patient engagement and satisfaction Nurses often only spend 20% of their time delivering direct care at the patient bedside Cybercriminals are increasingly going after targets in the medical and healthcare verticals (1) Joint Commission, an independent healthcare accreditation organization (2) Agarwal et. al. Univ. of Maryland,

5 2017 Context Market Forces Vocera Forces Political Forces Meaningful Use Hangover ACA Repeal Medicare/Medicaid Hospital Budgets Product Scalability Integration Unified Platform Technology Forces Device of Choice CC&C Unified Platform Strong Backlog/Def Revenue Approaching Target Model Sales & Marketing ROI Selling Cross Selling System-level Deals 5
6 Strategic Evolution Vocera Before Communications Badge-Centric Point Product Department Sale Vocera Now Clinical Workflow Software-Centric Complete Solution Enterprise Sale

7 Compelling Return on Investment Patient Safety and Satisfaction Response times down from 2 minutes to 9 seconds Fall related injuries down 60%; estimated $1.27 mm savings 35% overall satisfaction rating improvement 25% improvement in HCAHPS scores Operational Efficiency 10 minutes per nurse per shift 350 more annual OR capacity hours OR revenues up $780,000 Bed turnover rates up 50% 4,000 annual ED hours recaptured 7


8 Recent Platform Wins Validate Strategy Key Differentiators: Enterprise-class platform (vs cobbling together vendors) Clinical integration Device of Choice (Apple and Zebra) Vocera Badge resonates with nursing Superb references World-class support and professional services MEDCOM 8
9 Our Mission The Quadruple Aim Quality Cost Patient-Centered Experience Enhance how care is provided to help patients to achieve better outcomes Increase operational efficiencies Improve patient experience by allowing caregivers to be Patient Centered Improve the caregiver experience by improving workflow and empowering care teams 9
10 How Do We Do That? Achieve the Quadruple Aim By enabling the care team to get the data, context, presence, and insights needed to Focus on the patient Enhance workflows Make information and help easier to find 10

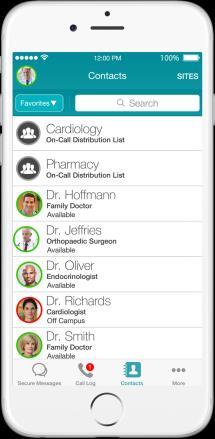
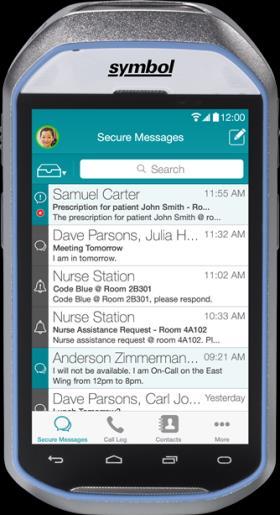
11 Clinical Communication and Collaboration Experience Improve response times, patient care, safety and satisfaction Communicate Secure text, voice, image Engage Over 120 clinical integrations 11

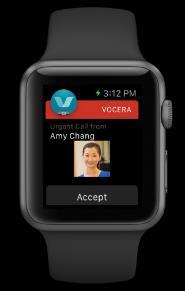
12 Enterprise-Grade Communication Platform Vocera Platform Master Directory On-Call Scheduling Security Analytics Hospital Staff Physicians Post-Acute Care Voice Secure Texting Clinical Integrations and Workflow Patient Engagement Alarm Management Vocera Badge Wi-fi Smartphone iphone Android Tablets Desktop VoIP Device Apple Watch
13 A Coordinated Approach Today s Situation The Vocera Approach Alerts Alarms Messaging Voice


14 Intelligent Clinical Workflow Quadruple Aim Quality Cost Patient- Centered Experience


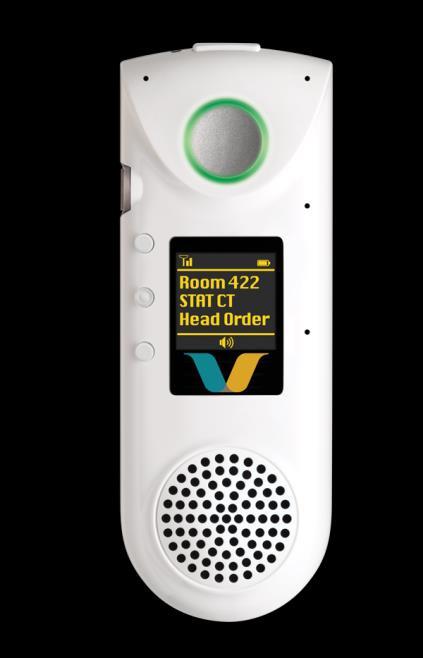
15 The Device of Choice Differentiator 15
16 Smartphone Apps Wireless Devices Status Quo Competitive Landscape Scalable, secure and integrated = we consistently win >70% of competitive sales Pagers Overhead Paging Shouting or Walking Spectralink Cisco Ascom Complete end-to-end solution Role-based intelligence Clinical integration Enterprise class Voalte Tiger Text Texting Solutions Mobile Apps Device of choice Ease-of-use Hands-free Trusted provider Purpose-built device World class service and support 16
 International Healthcare Facilities 230+ Global Non-")
 Hospitals (6308 Total US")
 ~$6 Billion Global Market Opportunity Vocera Hospitals US Hospitals")
17 Large Global Market Opportunity U.S. Hospitals (1) International Healthcare Facilities 230+ Global Non- Healthcare Facilities ,986 18% U.S. Penetration Rate (2) Hospitals (6308 Total US Hospitals) in the U.S. (1) ~$6 Billion Global Market Opportunity Vocera Hospitals US Hospitals Fed Hospitals Vocera Total VA DoD Total (1 ) Based on Definitive US Healthcare Database (2) Definitive Healthcare database 17
18 Our Opportunity: Multiple Avenues for Growth International Expansion Core Customer Growth Large system deals Further penetrate existing health system customers Continue pace of new customer acquisition Software Building momentum across new products EHR Integration Collaboration Suite Clinical Integration Even Driven Alerts Care Experience Extend reach to new users Physicians New Users Long Term Care Surgery Centers Attractive international markets Canada United Kingdom Saudi Arabia UAE Qatar Australia Singapore New Zealand 18


19 Diversified Revenue Streams % of 2016 Revenue Revenue Streams 39% Devices *50% recurring Vocera Badges Batteries, chargers, accessories 16% 34% Software *15%+ recurring Maintenance *All recurring Perpetual licenses Subscriptions Software maintenance Technical support 60% revenues are recurring High visibility Low customer concentration 11% Services *15%+ recurring Professional services Deployment and training 19
20 ($ in Millions) ($ in Millions) Financial Highlights Revenue +36% +23% $104.1 $27.7 $36.3 Adjusted EBITDA $127.7 Q116 Q $4.3 -$2.8 Highlights Strong Revenue Growth Q1 17: 36% Revenue Growth Product: +45%, Services: +25% Solid Customer Base and Value Proposition 95%+ s/w maintenance renewal rate Strong competitive win rate Expanding Profitability and Cash Flow Near-term impact from recent acquisition 2017 A-EBITDA guidance: $5-10 million $71 million of Cash, no Debt (1) Earnings before interest, taxes, depreciation and amortization, and further excludes stock -based compensation and change in fair value of warrant and option liabilities. 20
21 2017 Revenue Visibility $161M 65-70% $4.2 Rev from Def. Rev/BL Supplies Visible Revenue Book-ship 2017 Revenue 21
22 Operating Leverage Drives Significant Value Actual Drivers ~$200M Target Model R&D % of Revenue 17% 15% 13% S&M % of Revenue 47% 41% 37% G&A % of Revenue 13% 12% 11% Sales 12% 29% 8% Notes All numbers are non-gaap Mean peer group enterprise value comps are 3-4x Revenue and 12-15x A-EBITDA 22
23 Thank you!