BIG DATA ANALYTICS. Potential Revenue Streams for FTTx Operators. Brad Hine - ETI Software Product Director Analytics and GIS Solutions
|
|
|
- Jasper Gilmore
- 5 years ago
- Views:
Transcription


1 BIG DATA ANALYTICS Potential Revenue Streams for FTTx Operators Brad Hine - ETI Software Product Director Analytics and GIS Solutions
2 ABOUT ETI SOFTWARE 25 Years of OSS/BSS Integration Specialists serving CSPs, Cable, Utility and Satellite Controlling 7 BILLION daily transactions globally, managing MILLION devices, we offer scalable solutions, 130+ vendor technology & system integrations. Service Provider Customers on 5 Continents
3 BSS/OSS ECO-SYSTEM INTEROPERABILITY? Subscriber Information Location-Based Info Billing System info Service Activation Device Mmgt/Activation Network monitoring Asset & Inventory Ticketing Systems Work Force Mgmt Systems Homes Passed/Census Data IPTV Middleware PPV/VOD Systems Customer Service Mgmt Data Field Tech Scheduling Trouble Ticketing Work Groups Fleet Management Social Media CPE, Inventory Tracking Fiber Network Mapping Network/Device Provisioning Revenue Tracking
4 MY DAILY BUSINESS GOALS Daily Goals 1: Listen to customer challenges with Manual vs. Automation Devise methods through standard products to: (1) Keep subscribers satisfaction high and reduce churn (2) Refine and automate processes for efficiency (3) Every refinement must positively effect revenue and control costs
5 THE DILEMMA Challenges: Problem solving requires access to all relevant data Information in SILOS is inefficient Important data sets exist in different systems Need tools to monitor, identify and respond quicker Flat file reporting doesn t cut it need location-based analytics Monitor LOCATIONS, SUBSCRIBERS, TECHNOLOGY, DEVICES, and SERVICES.ANY TIME FROM ONE PLACE!
6 HOW DO WE GET THERE? Simple Steps 2: Integrate and Connect all internal systems, Real-Time Data VISUALIZATION using GIS Leverage traditional business tools, maps, reporting, spreadsheets Create Business Rules and Intelligent Work Flows NO SILOS - Enable Organizational Access. Combine BSS/OSS & GIS Monetize, Measure ROI and Refine your Methods

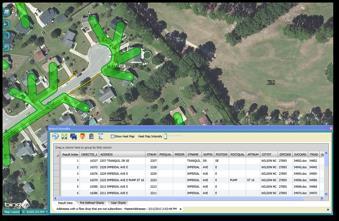
7 GIS - REALTIME + ACTIONABLE INTELLIGENCE ARPU: Census 284 $ monthly Repeat Ticket Internet Bandwith Issue Device Outage: AC Fail 5 min out Subscriber Activated Triple Play Subscriber Activated IPTV, Internet Fiber Cut OTDR: 842ft from node Device Outage ONT, Port work tickets Phased deployment model also available
8 5 CATEGORIES AND 15 SUB-CATEGORIES


9 VISUALIZING YOUR DATA FOR EACH UNIT


10 Be Operationally Intelligent Monitor, Respond, Report, Proactive Corporate Management Sales $ Marketing Operations Customer Care / Service Network


11 Monitor Real-time integration with BSS/OSS and IoT devices Visualize network elements Analyze current performance Evaluate critical events Respond to emerging issues before they develop into major problems

12 Respond Strategic response based on spatial analysis Visualize outages and give customer care insight into restoration Prioritize response based on crew proximity to incidents

13 Report Real-time incident response and reporting Access accurate and timely information Collect information from the field that supports real-time decision making Give management insight into all operations

14 Proactive Proactive network maintenance before its service affecting Analyze historical performance Incorporate machine learning and geography to identify patterns and trends Deliver a better customer experience with less costly proactive maintenance
15 LOST & FORGOTTEN DATA Questions to Ask: Am I leveraging all the necessary data in our eco-system? What info can I use that is location based? Can I automate crucial processes with visualization? Which system(s) should I access to for this automation? Do these processes need to be real-time?

 Network Design, Assets and")
16 RECENT CUSTOMER STUDY - JEA Jackson Energy Authority (Jackson, TN) 50,000 Subs MODEL: FIBER Network, VOICE, VIDEO & DATA External Operations 26 Use cases Work Force Management Scheduling & Ticketing Network Alarms and Outages Subscriber Service & Devices Automate Vehicle Locator (AVL) Network Design, Assets and Inventory

17 RECENT CUSTOMER STUDY - JEA Under Used Assets # Subscribers # Connections Capacity Cost ARPU Services Gross Revenue
18 RECENT CUSTOMER STUDY - ATMC Atlantic Telephone (Shallotte, NC) 225,000 subs MODEL: VOICE, VIDEO & DATA Services Market Analytics 62 use cases Subscriber Consumption Patterns Churn/Growth & Exit Codes Trouble Ticket Trends: PPV & VOD Consumption: Campaign Conversions FCC Mandatory Reporting

19 TRACKING SUBSCRIBERS, SERVICES & ARPU Subscriber Types Segmented Active Recent Disconnects Former Past Due Other Opportunities Business Lines Per Region Per Service, Per Region Bundle, Package Upsells ARPU

20 SUBSCRIBERS (CONT D) Subscriber Types Segmented Active Recent Disconnects Former Past Due Other Opportunities Business Lines Per Region Per Service, Per Region Bundle, Package Upsells ARPU

21 SERVICES (CONT D) Services Types Segmented Phone Voice TV Video Data Internet

22 BUSINESS TYPES Business Line Types Residential Commercial By Service Types By Region

23 SUBSCRIBER EXPERIENCE Growth New Installs Commercial Residential By Service Types By Region Churn Service Impacting Threats

24 THANK YOU Questions? Brad Hine - ETI Software Product Director Analytics and GIS Solutions bhine@etisoftware.com