ASSET MANAGEMENT PLAN 2016 WEL ASSET MANAGEMENT PLAN BEST IN SERVICE, BEST IN SAFETY
|
|
|
- Jayson Arnold
- 5 years ago
- Views:
Transcription


1 ASSET MANAGEMENT PLAN BEST IN SERVICE, BEST IN SAFETY WEL.CO.NZ

2 2
3 FOREWORD 22 March 2016 Dear Stakeholder Thank you for taking time to review the WEL Networks Limited Asset Management Plan (AMP) In essence the 2016 AMP is a snapshot of our intended capital expenditure on our network over the next ten years. It outlines the investment rationale and performance measurements of our assets and reinforces our commitment to provide a strong, safe, efficient, and reliable supply for customers. It reflects our objective to be Best in Service, Best in Safety, and highlights key initiatives that will improve our; planning, business performance, and investment decisions. While our service to urban customers remains consistent, we need to improve our service reliability in rural areas. The format of this year s AMP follows on from the 2015 revision delivering a more informative and easy to read document. We want to encourage stakeholders - from commercial partners to residential customers - to engage with, and comment on, the projects outlined in this document. Your feedback is essential for our business to progress and I d invite you to comment on the initiatives outlined either by ing me (garth.dibley@wel.co.nz) or phone Garth Dibley Chief Executive 3
4 TABLE OF CONTENTS FOREWORD... 3 PLAN SUMMARY INTRODUCTION Purpose Key Themes and Initiatives Document Structure BACKGROUND Overview of WEL Our Customers Our Network ASSET OVERVIEW Asset Population Summary Subtransmission Zone Substations Distribution and LV Lines Distribution and LV Cables Distribution Substations and Transformers Distribution Switchgear Other system fixed assets Other Assets Assets owned by WEL at GXPs APPROACH TO ASSET MANAGEMENT Stakeholder Requirements Asset Management Framework Risk Management Framework Assessment of Asset Management Performance ASSET MANAGEMENT GOVERNANCE Investment Planning Expenditure Approvals Works Plan ASSET MANAGEMENT PERFORMANCE Overview of Performance Objectives Safety Customer experience Cost Efficiency Asset Performance Performance Evaluation
5 7. NETWORK DEVELOPMENT AND NON-NETWORK INVESTMENTS Overview of Approach Peak Demand Forecast Overview of Network Development Plans GXP Investment Urban Development Plan Rural Development Plan Summary Network Capital Investment Non-Network Investments RENEWALS AND MAINTENANCE Overview of Maintenance and Renewals Maintenance Renewals Asset Life Cycle Management Overall Expenditure summary SUMMARY OF EXPENDITURE FORECASTS Introduction Capital Expenditure Operational Expenditure APPENDIX A GLOSSARY APPENDIX B CBRM APPENDIX C INFORMATION DISCLOSURE COMPLIANCE APPENDIX D INFORMATION DISCLOSURE SCHEDULES APPENDIX E DIRECTOR CERTIFICATION

6 6
7 PLAN SUMMARY INTRODUCTION The Asset Management Plan (AMP) describes the nature and characteristics of our assets and investment requirements providing an overview of our asset management planning, systems, procedures, and practices. It demonstrates the interaction with our corporate vision, our asset management objectives and the relationship with our other corporate documents such as the strategic plan and business plan. In preparing an AMP our aim is to create a valuable resource for all stakeholders. A significant refresh of the plan in 2015 delivered on this objective as we moved away from a traditional technical based document towards user-friendly, easy to understand information. For efficiency and consistency, few changes have been made to the format of this year s version. A significant review of the 10 year capital works plan has been undertaken. This is to ensure that the projects put forward are in line with the key initiatives listed below, challenge the anticipated future developments of the network and can withstand commercial analysis. Where there is technical information we aim to explain it in a way that provides meaning and value to all of our stakeholders. This AMP covers the period from 1 April 2016 to 31 March KEY INITIATIVES Throughout this document we describe and explain our key themes and initiatives for the AMP period. They are: Safety is our highest priority. Our vision places safety first and foremost, making it the top priority in everything we do. We strive to ensure safe environments for our staff, contractors and the public. We place a strong emphasis on delivering quality service to our customers. We have identified that our network performance comfortably exceeds our urban customers expectations. In contrast, our rural customers expect to experience significantly less interruption minutes than they currently do. As a result, a key focus of this AMP is on a renewal of the rural network, targeting high risk and aged assets to reduce customer outages. In addition to our focus on the performance of the rural network, our network development includes: - Projects to maintain network safety; - Providing additional capacity in localised areas of forecast growth; and - Addressing network security issues. Our core capabilities are in health and safety management, asset management, operational control, reliability management and service restoration. We are currently lifting our capability in these areas and in work delivery and corporate information systems. This will drive further efficiencies across our business. We strive for continuous improvement and have established performance objectives and measures in four key asset management areas: safety, customer experience, cost efficiency and asset performance. 7
8 OVERVIEW OF WEL NETWORKS LTD (WEL) WEL is owned by the WEL Energy Trust (Trust). The Trust s purpose Growing investment for our community requires being diligent shareholders and sharing the profits of WEL s business operation with our community through annual discounts and community grants. Our business vision is to Provide high quality, reliable utility services valued by our customers whilst protecting and enabling our community. By keeping our vision at the forefront of our activities, we focus on enhancing customer service and protecting the community we serve. We play a pivotal role by providing services that are essential to the economic, social and environmental wellbeing of the community. NETWORK OVERVIEW WEL supplies electricity to the northern Waikato and small networks in Cambridge and Auckland. Hamilton City is the main electrical load centre where customers enjoy a high level of reliability. Outside of Hamilton City the network area is predominantly rural. Our network areas are shown MARAMARUA in Figures S1 and S2 below. WEL NETWORKS AREA NGARUAWAHIA NGARUAWAHIA RAGLAN TE KAUWHATA HUNTLY GORDONTON GORDONTON HOROTIU HAMILTON HOROTIU HAMILTON Figure S1 Map of WEL Networks area SOUTHGATE BRICK STREET HULME PLACE RYAN PLACE KIRKDALE HALF MOON BAY DANNEMORA FLAGSHIP PORCHESTER ROAD OAKLANDS 8 Figure S2 Map of WEL external networks
9 Our network is supplied by four Grid Exit Points (GXP) owned by Transpower and two large embedded generators at Te Rapa and Te Uku. Our 33kV subtransmission network connects the GXPs with zone substations which in turn supply our distribution network. This network feeds our low voltage network supplying the majority of our customers. ELECTRICITY DELIVERED AND DEMAND The total electricity delivered during 2016 is forecast to be 1,219GWh with a coincident peak demand of 258MW. Delivered electricity has continued to increase while peak demand has generally remained flat since Peak demand has been forecast to grow modestly during the AMP period, driven primarily by continued residential subdivision activity in the north and new residential subdivision activity in the east of Hamilton along with residential, commercial and industrial connection growth in the Tasman substation area (between The Base and Rotokauri). Our network development plan proposes additional network capacity and security projects to meet the growth in forecast peak demand in localised areas of the network and to address existing constraints. An overview of our network development plan is described further below and in detail within Chapter 7. OUR STAKEHOLDERS As a community owned company we consider our stakeholder requirements to have utmost importance. Accordingly we have considerable focus on identifying and meeting stakeholder expectations. We have eight broad groups of stakeholders. These are customers, community, regulators, Transpower (including their role as System Operator (SO)), electricity retailers, service providers, staff, and our Board of Directors. We have identified our customers expectations through surveys and direct interaction to ensure we continually focus on what is important to our customers. Our stakeholder requirements, discussed in detail in Section 4.1, drive expenditure plans. ASSET OVERVIEW Our network is more than 6,400 km in length and is comprised of more than 200,000 individual asset components. Within the network we maintain and operate 25 zone substations and 17 switching stations (11kV) to enable a reliable supply of electricity to our customers. Table S1 below provides a summary of the assets we operate. ASSET TYPE UNIT QUANTITY Lines km 3487 Cables km 3080 Poles No Crossarms No Transformers No Ring Main Units No. 840 Smart Meters No Load Control Relays No Table: S1 Summary of Assets In general, our assets are in good condition. We have targeted our renewal and maintenance programmes based on our assessment of asset health, condition and risk. An overview of these programmes is described further below and in detail within Chapter 8. APPROACH TO ASSET MANAGEMENT AND GOVERNANCE Our approach to asset management is evolving. We have identified that we need to continuously improve and build additional capability. Good asset management is central to achieving our vision, strategic and business plans and the performance outcomes set out in Chapter 6. 9
10 We have established an asset management framework that links the Trust s purpose, our vision, strategy and business plans to our Asset Management Policy. This in turn determines key strategies contained within our network development, non-network investment and renewal and maintenance plans. Our strategies are recorded in this AMP and together form our work plan and incorporate the lifecycle activities required to meet the performance sought by stakeholders. Each component of our asset management framework is further described below. ASSET MANAGEMENT POLICY The Asset Management Policy informs our corporate governance arrangements. Its primary objective is to deliver a safe and reliable network over the long-term that meets customers quality and price expectations. ASSET MANAGEMENT STRATEGY Asset management strategy links our policy objectives to the network development projects and asset renewal and maintenance plans described in Chapters 7 and 8. The strategy adopted supports three distinct components. Network Development: In line with customer expectations our strategic objective for network development is to maintain our urban reliability level while improving the performance of the rural network. This involves consideration of network security over the planning period against the established security criteria. We will need to maintain capacity required to supply localised areas of growth within the urban network. To achieve these cost-effectively, we will seek projects with high cost benefit ratios such as network automation and non-network alternatives such as demand management. The initiatives and projects that result from this strategic approach are discussed further in Chapter 7. Non-network Development: We invest in non-network assets to increase operational flexibility and to improve the information that supports our asset management decision making. We are now utilising the information and flexibility this provides to improve services to customers and to ensure efficient investment decisions are made. The initiatives and projects that result from this investment are discussed further in Chapter 7. Maintenance and Renewals: Our strategic approach to maintenance and asset renewal is to maintain a consistent and sustainable level of risk over the long-term. The principal methodology employed for this is Condition Based Risk Management (CBRM) which is explained further in Appendix B. This strategic approach and resulting renewal and maintenance expenditure over the AMP period is discussed further in Chapter 8. Central to our asset strategy is our whole of life approach. We seek to optimise investment decisions by taking into account the full life-cycle costs of our assets. WORKS PLANNING Works planning is integral to meeting the needs of our stakeholders. Our focus is to efficiently deliver both planned and unplanned works. It also includes operational services required to meet customer requirements and involves three key steps. 1. Integration and optimisation of network development, renewal, and maintenance works. 2. Works and resource scheduling and programme management. 3. Management of works delivery. The governance arrangements for works planning are discussed further in Chapter 5. We understand the integration and optimisation of our planning process and works delivery is key to achieving our safety, efficiency and affordability objectives. We are currently integrating a number of improvement opportunities into our works delivery methodology. 10
11 The works delivery plan and our operations scheduling is expected to improve as we build on our initial initiatives. We are currently instigating a project to further integrate and extract benefits from our SAP system and, in particular, by the enhanced utilisation of a powerful scheduling module and increased use of the financial functionality. RISK MANAGEMENT FRAMEWORK Risk management is a fundamental asset management discipline. It requires robust processes to be in place for assessing and managing asset-related risk. We have in place an effective and efficient risk framework for identifying and managing business and network risks where risk is routinely assessed and re-evaluated. EXPENDITURE APPROVALS Investment planning is fundamental to many of our asset management activities. Our planning capability is central to efficiently delivering on customer price and quality expectations. Our development process has the same fundamental stages for all investments, from needs identification through to delivery. These stages are managed under an overarching governance, prioritisation and approvals framework as illustrated below. GOVERNANCE, PRIORITISATION, APPROVALS Need Identification Options Analysis Project Definition and Cost Estimation (PDD) Works Plan Figure S3 Investment Planning Framework In December 2015 our Board of Directors endorsed the updated delegated financial authority structure for the business. Prior to approval, expenditure plans are subject to an internal challenge process. The expenditure approval limits have been established commensurate with our organisational structure, meaning higher limits are set corresponding to a person s position or role within the organisation. ASSET MANAGEMENT IMPROVEMENT The Asset Management Maturity Assessment Tool (AMMAT) gauges our performance against the selected components of the PAS 55:2008 (replaced by the ISO 55000:2014 standard) Asset Management framework. This self-assessment informs us and stakeholders about the level of competency we believe we have reached at the time of assessment. We derive benefit from our internal discussions and views around the level of asset management capability and competency appropriate for our stakeholders and the identification of improvement opportunities AMMAT ASSESSMENT The results from the 2016 year are shown below indicating an improvement in our scores over the last year. This suggests that the initiatives we are undertaking to improve our delivery of work are starting to take effect and we are achieving a better alignment to the ISO 55000:2014 standards. 11
12 ASSET MANAGEMENT MATURITY ASSESSMENT 2016 AVERAGE 2015 AVERAGE Asset strategy and delivery 4.0 Competency and training Documentation, controls and review Structure, capability and authority Systems, integration and information management Figure S4 AMMAT Assessment Communication and participation ASSET MANAGEMENT OBJECTIVES Our asset management objectives cover four key areas. Safety: Safety is our highest priority. Our objective is to provide a safe environment for our staff, contractors, and the public. Customer Experience: Our customer objective is to deliver the quality of supply (reliability) sought by our customers and provide them with a service they value. Cost Efficiency: Our objective is to make the right investment choice at the right time, and to deliver our works programme for the lowest total ownership cost possible while achieving our quality and safety targets. Asset Performance: Our asset performance objective is to optimise the price-quality trade-off based on our stakeholders needs. We will support this by further developing our asset management capability, asset strategies, network configuration, and supporting business processes. Furthermore our purpose, vision and values drive the priorities defined within our Strategic Plan. They also provide context for our business and asset management practices. There are five asset management strategies defined in our Strategic Plan. Our asset management investment decisions reflect safety as our top priority and are optimised based on a quantifiable trade-off between capital and operational expenditure, risk and reliability. Preventive and corrective maintenance decisions are made using quantitative analytical techniques such as Condition Based Risk Management (CBRM) or Failure Modes and Effects Analysis (FMEA). These techniques allow for a quantifiable trade-off between capital and operational expenditure, risk, reliability and safety considerations. We leverage our Smart Box data to inform the way we plan, build, maintain and operate our network. This includes voltage exception analysis, fault identification and remediation, peak capacity planning and optimised load control. 12
13 How, when and who we use to deliver our AMP are key inputs in our investment decisions. We have an effective operational business metering team and are recognised externally as a leading player in the smart metering business environment. ASSET MANAGEMENT PERFORMANCE Performance objectives, measures and targets have been established in four areas covered by our asset management objectives. Each performance area includes measures and targets for the AMP period which flow directly from our Strategic Plan. Our performance objectives and measures are: Safety: Safety is our highest priority. Our safety performance objectives cover aspects of our culture and leadership, how we operate, equipment purchased and requirements for continuous improvement and improved communications. We measure our safety performance. Our key measures and targets include our Total Recordable Injury Frequency Rate (TRIFR), staff behaviours and public safety incidents. Customer Experience: Our customer experience objectives cover both reliability (quality of supply) and the quality of service we deliver through our interactions with customers, such as the time taken to resolve a complaint. In addition to these measures we are committed to safely restoring supply as soon as possible following an interruption. Accordingly we undertake to restore power to our urban customers within three hours of an outage and within six hours of an outage to our rural customers. If we do not meet this timeline, our residential and small commercial customers are entitled to receive $40 and our large commercial customers will receive $150 from us. This is known as the WEL Promise. 1 Cost Efficiency: Cost efficiency is driven by making the right investment choices at the right time and delivering our works programme for the lowest total ownership cost possible while achieving our quality and safety targets. We measure operating cost per customer and capital expenditure performance as key cost efficiency measures, and Asset Performance: The performance of our assets directly determines the quality and cost of providing services to our customers. This, in turn, is a direct consequence of the asset management decisions we make on a daily basis. Reflecting these linkages, our asset performance objective is to optimise the price-quality trade-off based on our stakeholders needs. We measure GXP load factor and transformer utilisation as key initiators of our asset performance. DEVELOPMENT INVESTMENTS With our customers investing more in electricity efficiency initiatives over the AMP period, we anticipate the total electricity delivered to grow at a slower rate than in the past. However, we also expect to see small increases in peak demand in some localised areas of the network, driven by growth in residential subdivisions and the commercial/industrial sectors. Accordingly, we expect a slow increase in peak demand over the AMP period, as set out below. GXP Hamilton 11kV Hamilton 33kV Huntly 33kV Te Kowhai 33kV System Peak Table S2 GXP Demand Forecast The network development initiatives that result from our peak demand forecast are summarised in the following page. 1 The WEL promise does not apply to faults beyond our control such as storms, lightning, vehicle accidents, or third party damage. 13
14 GXP DEVELOPMENT PLAN Our peak demand forecast implies a need to augment the supply capacity at the Hamilton GXP. However, one of the two transformers at Hamilton GXP is a smaller capacity than the other and due to be upgraded by Transpower in When this occurs capacity at the GXP will increase. Until that time demand at the GXP will be managed through load management and switching by WEL. URBAN DEVELOPMENT PLAN The Urban Development Plan addresses the needs arising from localised growth in Hamilton City. Growth is expected from residential subdivision development activities in the north and southeast of Hamilton and residential, commercial and industrial connections in the Tasman area (between The Base and Rotokauri). Expenditure has also been included for investment required specifically to meet the needs of individual customer works. The Urban Development Plan also provides for improving and updating our control and automation equipment and specific safety related investments and works. RURAL DEVELOPMENT PLAN The Rural Development Plan addresses the need to improve voltage performance and security on our rural network. Expenditure is targeted at development of the rural zone substations at Weavers, Gordonton and Te Uku. We have also included a number of distribution network improvements aimed at enhancing security, voltage levels and reducing interruptions due to avoidable circuit tripping. Improvement to the reliability of the rural network will primarily come from maintenance and renewal of the assets. NON-NETWORK INVESTMENT Our non-network investments during the AMP period cover our planning expenditure on computer equipment including the periodic renewals of software and hardware used to support asset management functions. It also includes plant, equipment and motor vehicle renewals. The GXP, Urban, Rural and Non-network investment expenditure is summarised below. This year a review of the 10 year capital project plan was undertaken to reaffirm the drivers with present and anticipated future developments on the network. The review recommended that the 10 year capital spend profile be reduced by $25.8M. Work was also undertaken to flatten the spend profile. 10 YEAR DEVELOPMENT EXPENDITURE 20,000 GXP URBAN RURAL NON-NETWORK $000 18,000 16,000 14,000 12,000 10,000 8,000 6,000 4,000 2, Figure S5 Development Expenditure 14
15 RENEWAL AND MAINTENANCE Delivering our performance objectives requires the right balance between expenditure on maintenance and investment in renewals. In striking this balance we have considered the whole of life costs of our assets and required interventions during their lifecycle. MAINTENANCE All maintenance activity is first and foremost safety focused. After which it is structured to minimise the whole of life costs of our assets while managing their performance over time. This is achieved by selecting maintenance techniques and processes that: ensure safety risks are identified and mitigated optimise the costs of maintenance together with renewal expenditure meet any regulatory requirements where possible, improve network availability. VEGETATION MANAGEMENT We manage vegetation in and around our assets that has the potential to interfere with the safe and reliable supply of electricity to our customers in accordance with the mandatory Electricity (Hazards from Trees) Regulations We have increased inspection rates and created a model to predict when future work will be required based on vegetation type (vegetation growth model). Vegetation expenditure is based on this model. Using current cutting rates our model predicts expenditure will reduce over the AMP period. SERVICE INTERRUPTION AND EMERGENCY MANAGEMENT Service Interruption and Emergency Management relates to faults work required to be undertaken. We have forecast a decrease in our faults expenditure due to efficiency gains from the introduction of the new faults team, proactive repairs on defects due to enhanced diagnostic testing and reduction in line breaks due to the conductor asset renewal programme. Our forecast expenditure on maintenance, vegetation and faults activities is shown below. 10 YEAR MAINTENANCE, VEGETATION AND FAULTS EXPENDITURE VEGETATION SERVICE INTERRUPTIONS AND EMERGENCIES MAINTENANCE 9,000 8,000 $000 7,000 6,000 5,000 4,000 3,000 2,000 1, Figure S6 Maintenance, Vegetation and Faults Expenditure
16 RENEWALS Renewal expenditure is forecast to vary over the AMP period, primarily due to the variable expenditure on zone substation renewal. Step changes are also evident on our planned transformer and distribution and LV line expenditure from This reflects our risk based approach to asset renewals known as CBRM. This approach prioritises the renewal of assets that present the highest risk to safety, network performance and the environment. The methodology is used by numerous electricity distribution companies internationally to deliver effective risk related asset management. Our forecast expenditure on renewals is shown below. 10 YEAR RENEWAL EXPENDITURE 14,000 OTHER SYSTEM FIXED ASSETS 12,000 DISTRIBUTION SWITCHGEAR 10,000 $000 8,000 6,000 DISTRIBUTION SUBSTATIONS AND TRANSFORMERS DISTRIBUTION AND LV CABLES DISTRIBUTION AND LV LINES 4,000 ZONE SUBSTATIONS 2, SUBTRANSMISSION Figure S7 Renewal Expenditure OVERALL SUMMARY The Asset Management Plan provides a clear description of the objectives, measures, and targets we aim to achieve on behalf of our stakeholders. It describes the investments we need to make over the next 10 years and how these activities will be managed to deliver meet the requirements of our current and future customers. 16

17 1. INTRODUCTION
18 1. INTRODUCTION The Asset Management Plan (AMP) describes the nature and characteristics of our assets and investment requirements; it also provides an overview of our asset management planning, systems, procedures and practices. This 2016 Asset Management Plan (AMP), while similar in format and content layout to last year, includes a significant review of our capital works expenditure plan from previous versions. This chapter introduces our AMP, and is structured as follows. Purpose (1.1): explains the purpose of the AMP, the period covered, the date ap proved by our Board of Directors, its scope and the intended audience. Key Themes and Initiatives (1.2): summarises our key themes and initiatives included in this AMP. Document Structure (1.3): provides a summary of the AMP and its structure. 1.1 PURPOSE The purpose of this AMP is to communicate with our stakeholders by: providing readers with an appreciation of the nature and characteristics of the assets we own and operate recording the investment requirements we foresee over the AMP period so we can continue in accordance with our vision to provide high quality, reliable, utility services valued by our customers whilst protecting and enabling our community providing an overview of how stakeholder interests are incorporated into our asset management planning, systems, procedures and practices demonstrating the interaction between the plans, our corporate vision and our asset management objectives conveying our asset management and planning processes, which have been set in place to meet our asset management objectives of safety, high quality customer experience, cost efficiency and asset performance describing the relationship of the AMP with our strategic plan and its importance as a key planning document. 18 Where there is technical information in this AMP we aim to explain it in a way that provides meaning and value to all our stakeholders. PERIOD COVERED BY THE AMP This plan covers a ten year period from 1 April 2016 to 31 March 2026 (AMP period). As with any long-term plan, the details tend to be more accurate in the earlier years as it is easier to predict the near-term state of our assets and required actions, plans and expenditure. APPROVAL DATE This plan was reviewed and approved by the WEL Networks Limited Board of Directors on 22 March SCOPE OF THE AMP This AMP covers the WEL assets used in the delivery of electricity distribution services to the customers connected to our network. INTENDED AUDIENCE The intended audience for this AMP includes: our customers, the Commerce Commission and Electricity Authority (our key regulators), our staff and contractors, and other interested parties.
19 1.2 KEY THEMES AND INITIATIVES KEY THEMES AND INITIATIVES Throughout this document we describe and explain our key themes and initiatives for the AMP period. They are: Safety is our highest priority. Our vision places safety first and foremost, making it the top priority in everything we do. We strive to ensure safe environments for our staff, contractors, and the public. We place a strong emphasis on delivering quality service to our customers. We have identified that our network performance comfortably exceeds our urban customers expectations. In contrast, our rural customers expect to experience significantly less interruption minutes than they currently experience. As a result, a key focus of this AMP is on a renewal of the rural network, targeting high risk and aged assets to reduce customer outages. In addition to our focus on the performance of the rural network, our network development includes: - Projects to maintain network safety; - Providing additional capacity in localised areas of forecast growth; and - Addressing network security issues. Our core capabilities are in asset management, health and safety, operational control, reliability management and service restoration. We have plans to further lift our capability in these areas and in work delivery and corporate information systems. This will drive further efficiencies across our business. We strive for continuous improvement and have established performance objectives and measures in four key asset management areas: safety, customer experience, cost efficiency and asset performance. Our performance objectives, initiatives, measures and targets are set out in Chapter 6. 19
20 1.3 DOCUMENT STRUCTURE The document is structured as illustrated in Figure 1.3. INTRODUCTION (THIS CHAPTER) BACKGROUND INFORMATION ON WEL NETWORKS 2 3 CHAPTER 2 BACKGROUND Introduces WEL Networks, our customers and network. CHAPTER 4 APPROACH TO ASSET MANAGEMENT Sets out the approach we take to asset management. 6CHAPTER 6 ASSET MANAGEMENT PERFORMANCE Describes both the performance we are seeking to achieve and the performance levels delivered over the last two years. CHAPTER 3 ASSET OVERVIEW Describes the assets we own and operate along with their current condition. OUR APPROACH TO ASSET MANAGEMENT AND PERFORMANCE OBJECTIVES 4 5 CHAPTER 5 ASSET MANAGEMENT GOVERNANCE Describes the processes we use to manage our assets and network. OUR 10 YEAR PLAN 7 8 CHAPTER 7 NETWORK CHAPTER 8 RENEWALS AND DEVELOPMENT AND NON-NETWORK MAINTENANCE INVESTMENTS Sets out the requirements Sets out our plans for developing for replacement and the network over the next 10 maintenance expenditure years, along with our non-network over the next 10 years. expenditure. 9CHAPTER 9 SUMMARY OF EXPENDITURE FORECASTS Summarises our projected expenditure over the next 10 years. Figure 1.3 AMP Structure APPENDICES Provides supporting information and the detailed regulatory schedules 20

21 2. BACKGROUND
22 2. BACKGROUND This chapter introduces WEL Networks Limited (WEL) and our customers. It provides an overview of our distribution network (network) that serves our customers. The chapter is structured as follows: Overview of WEL (2.1) provides background information on WEL, including our governance arrangements, purpose, vision, values, and stakeholders. Our Customers (2.2) describes our customers and the quality of supply they require from our network. Our Network (2.3) provides an overview of the network assets used to distribute electricity. 2.1 OVERVIEW OF WEL WEL and its direct predecessors have supplied electricity to the Northern Waikato for nearly 100 years. The northern Waikato region includes the major population centre of Hamilton City, and the regional centres of Raglan, Gordonton, Horotiu, Ngaruawahia, Huntly, Te Kauwhata and Maramarua. The following sections describe WEL s ownership and governance structure in more detail, along with our company purpose, vision and values OWNERSHIP AND GOVERNANCE WEL is locally owned. The company has one shareholder, the WEL Energy Trust (Trust). The beneficiaries of the Trust are the local councils; Hamilton City Council, Waikato District Council and Waipa District Council. As the Trust is community owned the income it generates benefits the community that WEL serves. The Trustees of the Trust are elected by WEL s customers, with elections held every three years. The next election is scheduled for June The Trust is responsible for appointing WEL s Board of Directors. WEL operates for the benefit of customers and the community. The Trust monitors the performance of WEL and is consulted on our strategic initiatives including asset management measures and targets. More information about the Trust and its activities can be found at CORPORATE OBJECTIVES Our corporate vision, values and objectives are detailed below. Our business vision and values are driven directly from the Trust s purpose statement. This ensures that there is a clear line of sight between the aspirations of the Trust and how we operate as a business. WEL ENERGY TRUST S PURPOSE: Growing investment for our community The Trust s purpose is to grow investment for our community by being diligent shareholders and by utilising our profits effectively in our community through an annual discount on individual electricity accounts and through a programme of community grants. OUR VISION: Provide high quality, reliable utility services valued by our customers whilst protecting and enabling our community The overriding principle of our vision is to continually develop a high quality electricity network which provides cost effective and reliable services to our customers. By keeping our vision at the forefront of our activities, we focus on enhancing our customers experience and protecting the community we serve. 22
23 We play a pivotal role by providing services that are essential to the economic, social and environmental wellbeing of the community we serve. Our vision is supported by our fundamental values. OUR VALUES: A Agility Being quick and responsive to change and opportunities. Having the flexibility to respond when the situation demands it. B Build the Business Grow our business influence and competitiveness. Making sure that our business is always as efficient and effective as it can be. Continuously improving what we do. C Care for our people, customers and assets Working well with people in our business, respecting and providing service to our community, caring about the assets we own and operate. D Do the right thing Earn respect for our actions. Making decisions that might not always be easy, but are the right thing to do. E Every day home safe Everyone focusing every day on their own safety, their colleagues safety, and the public s safety. As a business we take pride in these values and demonstrate them in every interaction with our customers and the community. INFORMING OUR ASSET MANAGEMENT OBJECTIVES Our purpose, vision and values drive the priorities defined within our Strategic Plan. They also provide context for our business and asset management practices. The asset management strategies defined in our Strategic Plan are: Our asset management investment decisions reflect safety as our top priority and are optimised based on a quantifiable trade-off between capital and operational expenditure, risk and reliability; Preventive and corrective maintenance decisions are made using quantitative analytical techniques such as Condition Based Risk Management (CBRM) and Failure Modes and Effects Analysis (FMEA). These techniques allow for a quantifiable trade-off between capital and operational expenditure, risk, and reliability considerations; We leverage our Smart Box data to inform the way we plan, build, maintain and operate our network. This includes voltage exception analysis, fault identification and remediation, peak capacity planning and optimised load control; How, when and who we use to deliver our AMP are key inputs in our investment decisions; and We have an effective operational business metering team and are recognised externally as a leading player in the smart metering business environment. The strategic plan in turn provides the performance requirements, targets and initiatives for each of our asset management objectives. Our asset management objectives cover four key areas; safety, customer experience, cost efficiency and asset performance as outlined. Safety: Safety is our highest priority. Our objective is to provide a safe environment for our staff, contractors and members of the public. Customer Experience: Our customer objective is to deliver the quality of supply (reliability) sought by our customers and provide them with high quality services. Cost Efficiency: Our objective is to make the right investment choice at the right time, and to deliver our works programme safely for the lowest total ownership cost possible while achieving our performance targets. 23
24 Asset Performance: Our asset performance objective is to optimise the price-quality trade-off based on our stakeholders needs. We will support this by more clearly understanding our customer needs, developing our asset management capability, asset strategies, network configuration, and supporting business processes. Our asset management performance objectives are set out in more detail within Chapter STAKEHOLDERS As a community owned company we consider our stakeholder requirements to have utmost importance. Accordingly, we have considerable focus on identifying and meeting stakeholder expectations. We have eight broad groups of stakeholders: Customers Community Regulators Transpower (including their role as System Operator (SO) Electricity retailers Service providers Staff Board of Directors WEL Energy Trust. Each group is described below. CUSTOMERS We place a strong emphasis on delivering quality service to our customers. We have differentiated them into six groups; domestic, non-domestic, small scale distributed generation, streetlight, unmetered and large. In addition we have domestic and non-domestic customers in Cambridge and Auckland on our external networks. These groups can be further characterised as either being located within the Central Business District (CBD), urban or rural areas of our network. We also have a number of generation customers who inject electricity into our network. We identify our customers needs through surveys, feedback and direct interaction. While there is diversity in the level of service sought by the different groups, all customers are concerned with four key service areas; public safety, quality of supply, price of the service they receive, and the level of customer service we provide. Their interests are accommodated within our asset management practices through delivering acceptable asset management, technical and performance standards. Our customers are further discussed in Section 2.2. RETAILERS There are approximately 15 retailers who sell electricity and ancillary services to our customers. In addition, retailers in most situations are responsible for collecting revenue on our behalf and maintaining the direct contractual relationship with customers. We maintain frequent communication with retailers through our operational, billing and payment interactions and regular consultation. We understand retailers requirements of us as an electricity distributor. These requirements include: the delivery of effective business to business services; use of transparent, simple and appropriate network tariff structures and prices; and fair contractual arrangements. Retailers are viewed as customers in their own right in addition to their role as representatives of our customers. 24
25 COMMUNITY We have a responsibility to the wider community in which we operate. Our owner is a community trust and as such the wider community needs are an important focus for us. We have developed our understanding of the community s needs through a number of channels including the Trust. These needs include safety and the impact our assets have on the environment. These needs are paramount to us and are accommodated in our asset management practices. Our objectives and approach to public safety and environmental issues are described in Chapter 6. REGULATORS As an electricity distribution business our operations are subject to regulations established under various Acts including the Commerce Act and the Electricity Industry Act. The regulations are primarily administered by the Commerce Commission and the Electricity Authority. The Commerce Commission is our economic regulator. It manages regulations around price-quality requirements, and public disclosure of important information (Information Disclosure) that applies to WEL. The Electricity Authority is responsible for establishing and regulating an efficient electricity market and other related aspects of an electricity distribution business, such as pricing structure, interactions with the System Operator and commercial agreements with retailers that also apply to WEL. TRANSPOWER We receive our electricity supply via transmission lines owned and operated by Transpower, the New Zealand transmission company. Transpower also holds the role of System Operator (SO) responsible for, amongst other things, maintaining the integrity of the electricity system including the coordination of electricity generation. Transpower and WEL consult extensively with each other regarding our respective asset management plans, commercial relationship and other industry issues. We have established systems and protocols with the SO for immediate communications regarding operational matters should circumstances require it. SERVICE PROVIDERS Our service providers are essential to our ability to supply electricity distribution services to our customers. Accordingly we are focused on ensuring they perform and deliver the services required of them in a safe, effective and efficient manner. They in turn require our interactions with them to be predictable, transparent and commercially sound. STAFF Our staff are the driving force behind our business. They value job satisfaction, a safe and enjoyable working environment and to be fairly remunerated for the work they perform. We strive to be a good employer and have incorporated health and safety policies and initiatives, performance reviews and forward work planning so staff can maintain a work/life balance. BOARD OF DIRECTORS The Board of Directors are the shareholder s representatives in setting direction for the business. As such they are concerned, amongst other things, with: providing a safe environment for staff, service providers and the public enterprise value and the long-term sustainability of the business ensuring a good reputation with the community customer engagement the long-term management of our assets managing business risk seeking opportunities for growth efficient operation developing organisational capability. 25
26 Their interests are identified and incorporated into asset management practices through our governance processes CORPORATE AND ORGANISATION STRUCTURE This section describes the governance arrangements, organisation structure and key responsibilities of our Executive Management, Asset Management and Operational teams. The aim of the governance and organisation structure is to ensure the necessary accountabilities are in place for good asset management. BOARD OF DIRECTORS AND GOVERNANCE ARRANGEMENTS The Trust appoints the Board of Directors, who govern the company and appoint the Chief Executive. These are the key Board level asset management related governance activities. Approval of strategic plans. Approval of the annual business plan and budgets. Approval of the AMP and corresponding work plan. Individual project approval (for projects greater than $2M). Monitoring performance against the strategies, objectives and targets in relation to the above governance activities. The Board receives regular reports and information on the operational revenue and expenditure of the company, capital expenditure and progress against established timeframes, risk management and compliance, performance and any customer complaints. ORGANISATION STRUCTURE WEL is structured into five divisions plus a wholly owned subsidiary for delivery for the majority of the works plan. The divisions are: Finance, Asset Management, People and Performance, Commercial and Technology. Figure below illustrates our organisational structure. WEL Services reports to the WEL Networks Chief Executive. Chief Executive Executive Support & Administration GM Finance Finance Treasury Management Accounting GM Asset Management Asset Strategy & Planning Maintenance Planning Engineering Network Design Work Programme Management Contract & Customer Project Management Network Operation & Automation Asset Information GM WEL Services Works Planning and Design Works Scheduling Project Management First Response Overhead Services Subtransmission Services Performance and Financial reporting GM People & Performance Health and Safety Human Resource Management HR And Payroll Administration Organisational Development Communications Customer Services GM Commercial Commercial Regulatory Pricing & Billing Procurement Distribution Centre Business Assurance GM Technology Systems and Technology Development IT Support GIS Management Project Management Office 26 Metering Services Figure Organisation Structure
27 EXECUTIVE MANAGEMENT TEAM Our Chief Executive and executive management team are responsible for developing our strategy and leadership within the organisation. The executive team is headed by Chief Executive, Garth Dibley. ASSET MANAGEMENT TEAM Our Asset Management team has overall responsibility for the management and operation of the network assets. This includes ensuring the assets are developed, renewed, maintained, operated and used on a long-term sustainable basis to meet the needs of all stakeholders. Their key responsibilities are set out in the following table. TEAMS Asset Planning and Engineering Maintenance Strategy Network Design Contract & Programme Management Principal Advisor KEY RESPONSIBILITIES Investment planning to meet the needs of stakeholders SCADA/Network Management System (NMS), network automation, Smart Grid and communications Manage Land Access, Consenting and Resource Management Act requirements Renewals and Maintenance strategy Development of maintenance standards, policies and procedures Optimisation of lifecycle costs of network assets Management of the renewal and maintenance programme Design services for internal and external customers. Review and approval of design works provided by external contractors Works programme management, works plan & spend profile development Management of outsourced work through contract management Front end management of customer initiated works Monitoring asset performance outcomes maintenance of project optimisation tools SLA and KPI management Strategy and business planning Portfolio Management Network Operate and Restore 24/7 monitoring and operation of the network Table Asset Management Team Responsibilities WEL SERVICES SUBSIDIARY Control and permitting of access to the network In 2015 WEL Networks undertook a review of our delivery model as planned in the WEL Networks Strategic Plan (developed February 2015). The aim was to ensure the right commercial decisions are made with regards to insourcing and outsourcing of maintenance and capital works. The project followed a robust methodology and included learnings from other organisations as well as thorough financial and non-financial analysis and evaluation. The models evaluated were: status quo; partial outsourcing; full outsourcing; an alliance and a subsidiary. 27
28 The results of our investigation demonstrated that the best long term cost/benefit value for WEL will result from a combination model, in which: a wholly owned Subsidiary delivers maintenance, first response, second response and asset renewal works there is outsourcing of some capex works, such as customer initiated works and major project capex to one or more service providers. This model rated the highest on both financial and non-financial evaluation criteria. In addition, establishing the subsidiary will provide an opportunity to: develop a more commercially astute team with strong commercial drivers and associated Service Level Agreements underpinning its performance build a flexible, high performance culture within the team reflecting its role as a service provider to WEL Networks, as well as a partner. This model was endorsed by the WEL Networks Board and work undertaken in the remainder of the financial year preparing the organisation for the wholly owned subsidiary model. The WEL Networks subsidiary was in in place for the beginning of the financial year and is now recognised as WEL Services. The formation of WEL Services will not affect WEL Networks core asset knowledge as core asset management information is contained within the WEL Networks asset management documentation structure and WEL services is still part of the WEL company structure. The WEL Services team has overall responsibility for the operational delivery of the Works Plan assigned to them and is divided into four primary sub-teams. The key responsibilities are set out below. TEAMS Planning & Scheduling Dispatch & Delivery Project Management Administration KEY RESPONSIBILITIES Receipt of incoming work, complete detailed design where required Plan and schedule all work to efficiently manage resources Assignment and handover of work to resources Delivery of maintenance, customer work, faults and capital projects Provide project management services to support planning and scheduling on complex projects Reconciliation of work order costs, SAP processing and reporting Table WEL Services Team Responsibilities OTHER TEAMS The Asset Management and WEL Services teams are supported by the Finance, Information Services, Commercial and People and Performance teams. Each team provides essential services in the areas outlined in our organisation structure (Figure 2.1.4) and contributes to the fulfilment of our overall asset management objectives and performance. CAPABILITY An assessment of our organisational capability has recently been completed confirming our core capabilities; asset management, health and safety, operational control, and reliability management and service restoration. While all staff and contractors are competent and have appropriate training programmes in place we have identified, and are in the process of forming plans to lift our capability and competency in these areas. This also applies to works delivery, business acumen and corporate information systems. We will establish a capability development programme to ensure we meet future challenges including implementation of this AMP. 28
29 2.1.5 OUR OPERATING ENVIRONMENT The environment we operate in is an important factor in delivering our services. There are a range of factors that determine the operational environment. These include: Topography Climate Land access Vegetation Regulation. The sections below discuss each environmental factor. TOPOGRAPHY The topography of our region varies greatly from the gently undulating landscapes of Central Waikato, South Auckland and Hauraki Plains to the steep slopes of the western hill country towards Raglan. The soil of our region is largely free-draining and cultivated. However, there are also areas of peaty loam, peat soils with wetlands in the Waikato lowlands and large tracts of native forest in the western hill country. This adds complexity to the design, construction and operation of our network. CLIMATE The northern Waikato region enjoys a moderate climate with prevailing winds from the west. On occasions unpredictable extreme weather conditions negatively impact the performance and reliability of our assets. Weather related events cause the highest incidence of interruptions to our customers, particularly in rural areas. This is due to the presence of overhead lines and outdoor assets which are subject to interference from windblown debris and failure during weather events. LAND ACCESS Our ability to gain access to our existing assets or secure land for new assets is fundamental to our continuing operations. As a Network Operator WEL has special rights under the Electricity Act 1992 for assets built prior to These special rights give equipment established prior to 1992 existing use rights and the ability for WEL to access and maintain the equipment. WEL is also permitted to access designated road reserves for installation, maintenance and repair of electrical equipment under the Electricity Act. We acquire easements for the installation of new assets on private property in order to formalise both the landowner s and WEL s legal rights. Obtaining an easement is usually straightforward when a private land owner will directly benefit from the easement e.g. a new connection. However, obtaining an easement for new assets to transit private land where the landowner gains no benefit is often challenging and time consuming. As such, our planning systems ensure work commences on obtaining the necessary easement as soon as practical in the planning process. A conservative approach is taken to the amount of land required for an easement to reduce expense and delay in the delivery of new assets. VEGETATION Vegetation located close to our assets has the potential to interfere with the safe and reliable supply of electricity to our customers. We manage all vegetation in accordance with the requirements of The Electricity (Hazards from Trees) Regulations We do this by patrolling, monitoring and recording sites where vegetation could interfere with the safe and reliable supply to our customers. We trim or remove vegetation accordingly. 29
30 REGULATION We operate in a highly regulated environment. As we are community owned and our size is below the threshold contained within Part 4 of The Commerce Act 1986, we are exempt from direct price and quality control by the Commerce Commission. We remain subject to all other regulatory controls including significant Information Disclosure requirements. 2.2 OUR CUSTOMERS WEL supplies electricity to a mix of customers across our CBD, urban and rural environments. Our customers range from low-use domestic though to very large users such as Waikato District Health Board. Effective engagement with customers requires a targeted approach. Our largest customers are regularly consulted on a range of issues important to them through our key account and customer works teams as outlined in Section Regular surveys are undertaken across all other customer groups, with the latest customer survey undertaken in June CUSTOMER PROFILES There are over 86,000 connections across WEL s traditional network area with an additional 1,800 within our networks located in Auckland and Cambridge. The breakdown of load by customer group for the 2015 year is set out in the table below. CUSTOMER GROUP NUMBER OF ACTIVE ICPS ELECTRICITY DELIVERED (GWH) DEMAND (MW) Domestic 72, (40%) Non-Domestic 12, (18%) Small Scale Distributed Generators (0 %) 160 (65%) Streetlights and Unmetered (1%) Large (40%) 86 (35%) Embedded Networks 1, n/a TOTAL 87,969 1, Table Electricity Delivered and Demand by Customer Group MAJOR CUSTOMERS We remain in regular contact with all of our major customers to ensure their needs are considered in our asset planning and service delivery. In some instances the specific needs of these customers influence the design and operation of our network. For example additional security levels may be required in the connection of some customers, while others require fast response times to fault events to ensure that essential operations can continue. Our ten largest major customers are: Waikato District Health Board Hamilton City Council Fonterra/Canpac International Solid Energy AFFCO Foodstuffs University of Waikato 30
31 Pact Group Holdings Progressive Enterprises Sealed Air. ELECTRICITY DELIVERED (GWH) PEAK TIME DEMAND(MW) Top 10 Customers Percentage of WEL Traditional Network 14.1% 9.2% Table Major Customers Electricity Delivered and Peak Time Demand Our two largest customers Waikato District Health Board and Hamilton City Council are, like us, suppliers of essential services. Accordingly they warrant special consideration and priority of attention in the event of loss of supply under provisions of the Civil Defence and Emergency Management Act ELECTRICITY DELIVERED AND DEMAND The total electricity delivered during 2016 is forecast to be 1,219 GWh with a coincident peak demand of 258MW. As illustrated in Figure 2.2.3, electricity delivered has continued to increase while peak demand has generally been flat since ENERGY DELIVERED AND PEAK DEMAND HAM0111 HAM0331 HLY0331 TWH0331 MER0331 Energy Delivered (GWh) Peak Demand (MW) Electricity Delivered (GWh) Figure Electricity Delivered and Peak Demand 2012 The majority of customers across our network have two distinct load profiles throughout the day. For urban customers load is generally high in the morning with a trough during the day and then increasing again in the late afternoon and early evening as residential customers prepare the evening meal. Peak load occurs during winter. The rural profile follows a similar pattern with the addition that dairy farms peak in summer during milking times in early morning and mid-afternoon
32 CHANGING ELECTRICITY DELIVERED, PEAK DEMAND AND GENERATION We have observed a number of changes in the quantities of electricity delivered and in peak demand patterns. Examples include: A declining amount of electricity delivered on average to our domestic customers. The average delivered quantity has fallen to 6,700 kwh p.a. from over 8,000 kwh p.a. or 16% in recent years. New domestic premises connecting to our network tend to be double glazed with electrically efficient lighting and appliances and on an average will only take delivery of 5,200kWh of electricity p.a.; Delivery of electricity to our large customers on average has also declined by approximately 1% p.a. since 2013, while their peak demand has declined by 2% on average. Our large customers pricing includes a strong peak time demand price component and it is evident many of our large customers are actively managing their demand during these times; Small scale distributed generation conversions are increasing. Approximately 150 new small scale distributed generators connected to our network in the past year. This increase is expected to continue as the cost of photovoltaic (PV) installation becomes more affordable. Each conversion typically results in a reduction of 2,000 kwh p.a. of delivered electricity; Our local councils have started to utilise LED technology for street lighting. LED technology could eventually see electricity used in street lighting drop by up to 80%; and The use of electric vehicles has commenced. We anticipate the use of electric vehicles will increase during the AMP period. The impact of these changes on our plans is discussed further in the demand forecasting section in Chapter OUR NETWORK This section describes our network and provides an overview of our assets grouped according to their function NETWORK OVERVIEW Our region stretches from Hamilton City in the southeast, to Raglan in the west to Maramarua in the north. We also own and operate small embedded networks in Cambridge and Auckland. Our coverage area is illustrated in Figure below and on page 33. WEL NETWORKS AREA NGARUAWAHIA RAGLAN MARAMARUA TE KAUWHATA HUNTLY GORDONTON HOROTIU HAMILTON 32 Figure Map of WEL Networks area
33 WEL NETWORKS AREA SOUTHGATE BRICK STREET HULME PLACE RYAN PLACE KIRKDALE HALF MOON BAY DANNEMORA FLAGSHIP PORCHESTER ROAD OAKLANDS Figure Map of WEL external networks The network assets that are used to provide electricity to the WEL geographic area consist of four main components: Grid Exit Points (GXPs) which connect our network to the National Grid; Subtransmission circuits and zone substations that transport the bulk supply across the region (33kV); Distribution assets (11kV) that move power from the zone substations to areas of local supply; and Low voltage network that then connects directly to houses and businesses. The map on page 34 provides a high level depiction of the GXPs and Subtransmission network. 33
34 OVERVIEW FINLAYSON RD MEREMERE HAMPTON DOWNS TE KAUWHATA HUNTLY KIMIHIA GLASGOW ST WEAVERS NETWORK OVERVIEW NGARUAWAHIA HOROTIU GORDONTON TE KOWHAI PUKETE BORMAN RD CHARTWELL SANDWICH RD 34 RAGLAN HAMILTON HOEKA TE UKU CLAUDELANDS PEACOCKES RD WHATAWHATA TASMAN RD COBHAM DR WALLACE RD BRYCE ST AVALON DR LATHAM CT TE UKU WINDFARM KENT ST Figure Map of GXP and Zone Substation Network LEGEND POINT OF CONNECTION WINDFARM SUBSTATION PUKETE COGENERATION ZONE SUBSTATION HOEKA SUBSTATION PROPOSED 33KV OVERHEAD 33KV UNDERGROUND WEL NETWORKS BOUNDARY
35 The following sections describe each network component in more detail. GXPS We take supply from three GXPs (owned by Transpower) located at Hamilton, Te Kowhai and Huntly. A general description of assets at each GXP is provided in Table GXP Hamilton Te Kowhai Huntly GENERAL DESCRIPTION Hamilton GXP supplies electricity at both 33kV and 11kV. Our 33kV subtransmission network from Hamilton provides a degree of interconnectivity with Te Kowhai providing an additional level of backup and security for Hamilton City. We own some protection and ancillary equipment located at the Hamilton GXP consisting primarily of check meters, auxiliary power supplies, load control plants, SCADA and communications equipment. Commissioned in 2005 Te Kowhai GXP supplies electricity at 33kV. The 33kV subtransmission network from Te Kowhai has a degree of interconnection capability with Hamilton GXP. We own protection and ancillary equipment located within the Te Kowhai GXP. This includes check meters, auxiliary power supplies, load control plant, SCADA and communications equipment. Huntly GXP supplies electricity at 33kV. The Huntly GXP can also be supplied from the neighbouring Bombay GXP via Meremere and a 33kV subtransmission circuit, should this be required. We own all the 33kV equipment on site including the 33kV switchgear, protection equipment and ancillary equipment. Table GXP General Description Hamilton GXP has the largest supply capacity and is the principal supply point for Hamilton City. SUBTRANSMISSION AND ZONE SUBSTATIONS Our 33kV subtransmission network transports electricity from Transpower s GXPs to our zone substations that in turn supply the 11kV distribution network. The subtransmission network is 429km in length and consists of a 33kV interconnected mesh around Hamilton City and double radial 33kV circuits supplying all but our Raglan and Finlayson zone substations. For Raglan and Finlayson the zone substations are supplied from single radial 33kV subtransmission circuits with our 11kV distribution network providing partial backup. The level of security provided in the majority of the subtransmission network is known as N-1. This means that the network can withstand the loss of one component and continue to supply electricity to customers. There are 25 zone substations on the network. All zone substations have two or more transformers (N-1) except Whatawhata, Finlayson, Raglan and Hampton Downs, which are smaller rural zone substations that supply smaller loads with a single transformer (N security). The level of security supplied available at each zone substation is in accordance with our network security criteria discussed further in Chapter 7. DISTRIBUTION Our distribution system takes supply from zone substations and the Hamilton GXP at 11kV. The distribution system is comprised of 11kV overhead lines on poles and crossarms, underground cables, distribution transformers and switching stations and consists of approximately 2,600km of 11kV cables and overhead lines, generally known as feeders. The Hamilton City CBD 11kV distribution network consists of 11kV underground trunk feeders interconnecting within the CBD network. The interconnection of the 11kV feeders provides an additional level of security, over and above that provided in the subtransmission network. The CBD distribution system has provided a high level of reliability to the CDB and its urban customers. 35
36 In other areas the 11kV distribution network is mostly overhead lines except where they traverse the newer residential areas. All recent and new subdivisions, whether they are rural or urban, are reticulated with underground cables in accordance with district plan requirements. There are four main types of distribution substations on the network, industrial and commercial, residential berm, residential pole mounted and rural substations. Each has different characteristics. Industrial and commercial distribution substations typically consist of enclosed, ground mounted transformers with integrated high voltage switchgear enclosed or adjacent to the unit. They are either site specific or only distribute electricity to a small number of customers. Low voltage distribution to these customers is protected using either fuses or circuit breakers (CBs) located within the unit. Residential berm type substations consist of enclosed ground mounted transformers with integrated high voltage switchgear enclosed or adjacent to the unit and customers are typically supplied from these units via fuses and underground LV cables. Residential pole type substations consist of pole mounted transformers with high voltage fuses above the unit. Customers are supplied from these units via fuses to LV overhead lines or underground cables. Rural pole type substations consist of pole mounted transformers with high voltage fuses adjacent to the unit. Customers are supplied via fuses and LV overhead lines. A number of our large customers own distribution networks within their sites. WEL only maintains and operates these where it is contracted to do so. LOW VOLTAGE NETWORK We manage approximately 3,400km of low voltage (LV) lines and cables. Approximately 90% of rural and 40% of the urban low voltage network is overhead lines. All new residential subdivisions, whether they are rural or urban, are reticulated with underground cables. LV assets include overhead lines, poles, insulators, cables, supply pillars, fuses and other ancillary equipment ASSET CLASSES We group our assets into asset classes. We have utilised these asset classes throughout the AMP. These asset classes are defined below and align with those required for Information Disclosure purposes. More detail on each asset class is included in Chapter 3. Asset classes utilised throughout this AMP. Subtransmission: the lines, cables and switchgear associated with the 33kV subtransmission system. Zone Substations: includes switching stations and the transformers, switchgear and buildings located within zone substations. Distribution and LV Lines: covers the 11kV and LV conductors, poles and other equipment associated with our overhead lines. Distribution and LV cables: includes the 11kV and LV underground cables. Distribution substations and transformers: covers the small substations and transformers that convert electricity from 11kV to LV. Distribution switchgear: includes switches and reclosers that are utilised on the distribution system to change the configuration of the network during maintenance or fault situations. Other system fixed assets: covers the important ancillary equipment used on the network to control and monitor the network. Other assets: covers all the other ancillary assets we utilise in providing services to our customers. 36

37 3. ASSET OVERVIEW
38 3. ASSET OVERVIEW This chapter describes the population, age profile, and condition of our assets. The chapter is structured as follows. Asset Population (3.1):quantifies the population and condition of our assets. Subtransmission (3.2) describes our subtransmission assets. Zone Substations (3.3) describes our zone substation assets. Distribution and LV lines (3.4) describes our distribution and LV line assets. Distribution and LV cables (3.5) describes our distribution and LV cable assets. Distribution substations and transformers (3.6) describes our distribution substation and transformer assets. Distribution switchgear (3.7) describes our distribution switchgear assets. Other system fixed assets (3.8) describes our other system fixed assets. Other assets (3.9) describes our other assets. Assets owned by WEL at GXPs (3.10) lists assets we own installed at Transpower s GXPs. 3.1 ASSET POPULATION SUMMARY A summary of the population and condition of our assets is shown in Table below. The condition is presented in the scale we use for grading our assets. Condition 5 represents an asset in as new condition and an asset is at condition 0 when it is due for replacement. 2 SECTION ASSET CATEGORY UNIT QUANTITY WEL CONDITION SCORE Subtransmission Poles No Crossarms No Subtransmission Lines 3 km Subtransmission Cables 4 km Subtransmission Circuit Breakers No Zone Substations Power Transformers No Switchboards No For regulatory reporting purposes these condition profiles are translated into the Commerce Commission s C1 to C4 condition scale in the schedules attached to this AMP. The translation from our 0 to 5 condition scale to the Commerce Commission s prescribed C1 to C4 scales is: WEL Condition 0 and 1 is translated to C1, 2 and 3 become C2, 4 is C3 and 5 is C4. 3 Condition score based on age 4 Condition score based on age
39 SECTION ASSET CATEGORY UNIT QUANTITY WEL CONDITION SCORE Substation Buildings No Distribution and LV Lines Poles No Crossarms No Distribution and LV conductors km Distribution and LV Cables Distribution Cables km LV Cables km Distribution Substations and Transformers Distribution Switching Stations Distribution Transformers No No Distribution Switchgear Ring Main Units No Distribution Circuit Breakers Distribution Air Break Switches Distribution Sectionalisers & Reclosers 3.8 Other System Fixed Assets No No No LV Pillars No Protection Relays No Network Management System Load Control Equipment No No Meters No Table Asset Population and Condition Summary 39
40 3.1.1 ASSET HEALTH INDEX (AHI) Our asset renewal strategy discussed in Chapter 8 utilises the CBRM methodology. In implementing the CBRM approach we have established an AHI for some of the asset categories. AHIs combine age, condition, environment and risk to generate a more comprehensive measure of asset health than a condition score. A probability of failure (PoF) is derived from the AHI and combined with consequential losses in order to establish a risk level. An AHI of 0 means the asset is in as new condition with a very low PoF, whereas an AHI of 10 means it is near the end of its life with a high probability of failure. This is illustrated in Figure CONDITION HEALTH REMNANT LIFE PROBABILITY INDEX OF FAILURE 10 Bad At EOL (<5 years) High Poor 5-10 years Medium Fair years Low Good 0 >20 years Very low Figure CBRM Health Indices Where an AHI exists for an asset category it has been included along with the population, age profile and condition information in the following sections. 3.2 SUBTRANSMISSION The subtransmission system transports bulk electricity across the region. It connects Transpower s GXPs to our zone substations. It also provides a level of interconnection between zone substations. The subtransmission network operates at 33kV and is 429km in length, of which 191km is overhead and 238km is underground. The majority of the overhead lines are in the rural areas while the underground network is split between the urban and rural areas. The following asset categories are included within the subtransmission category: Subtransmission poles Subtransmission crossarms Subtransmission lines Subtransmission cables Subtransmission circuit breakers Each asset category is described in the following sections. 40
41 3.2.1 SUBTRANSMISSION POLES POPULATION We have 2,646 subtransmission poles. Figure shows the distribution by construction material. The majority are concrete poles, with a small number of softwood, hardwood and steel poles remaining. SUBTRANSMISSION POLES BY TYPE Number of Poles Concrete Steel Hardwood Softwood P O L E M A T E R I A L Figure Subtransmission Pole Types AGE PROFILE Subtransmission poles share the same age profile as subtransmission lines, shown in Figure , as they are installed at the same time. The exception to this is wooden and steel poles that have a shorter life expectancy and therefore require earlier replacement. New poles installed are concrete due to the increased life expectancy, unless site considerations dictate otherwise. ASSET LIFE EXPECTANCY (YEARS) Concrete poles 70 Wooden poles (both softwood and hardwood) 45 Steel Poles 45 Table Life Expectancy of Subtransmission Poles CONDITION The condition profile of the subtransmission poles is shown in Figure below. Field inspections indicate that in general the condition of subtransmission poles is good. CONDITION OF SUBTRANSMISSION POLES Number of Poles Figure Condition of Subtransmission Poles C O N D I TN I O 41
42 3.2.2 SUBTRANSMISSION CROSSARMS POPULATION We have 2,911 subtransmission crossarms with the vast majority being hardwood. It is our current practice to install galvanised steel crossarms on the network due to their increased life expectancy and lower resultant whole of life cost. SUBTRANSMISSION CROSSARMS BY TYPE Number of Crossarms Steel Figure Subtransmission Crossarm Types C R O S S A R M M A LT E R I A Hardwood AGE PROFILE The age profile of the subtransmission crossarms is shown in Figure AGE PROFILE OF SUBTRANSMISSION CROSSARMS WOOD STEEL Number of Crossarms Age (Years) Figure Age Profile of Subtransmission Crossarm 42
43 Wooden crossarms have half the life expectancy of the line so must be replaced at least once during a line s lifetime. ASSET LIFE EXPECTANCY (YEARS) Steel crossarms 60 Hardwood crossarms 35 Table Life Expectancy of Subtransmission Crossarms CONDITION The condition profile of the subtransmission crossarms is shown in Figure Field inspections indicate that in general the condition of subtransmission crossarms is good. CONDITION OF SUBTRANSMISSION CROSSARMS 2500 Number of Crossarms Condition Figure Condition of Subtransmission Crossarms SUBTRANSMISSION LINES Subtransmission lines connect GXPs to the zone substations at 33kV, and are overhead conductors. POPULATION We have 158km of subtransmission lines in rural areas, 21km within the Hamilton urban area and 12km in Huntly. Subtransmission lines consist of conductors (wire). Four types of conductors are used on our network. Copper Aluminium conductor steel reinforced (ACSR) All aluminium (AAC) All aluminium alloy (AAAC) Copper was the original conductor installed on the network. Since the 1980s the relatively high cost of copper precluded its use and the installation of various aluminium conductors commenced. ACSR was the first aluminium conductor utilised, but more recently AAC and AAAC have been adopted as network standards. 43
44 Figure shows the quantity of subtransmission conductor by type. SUBTRANSMISSION CONDUCTOR BY TYPE Length (km) ACSR AAC AAAC C O N D U C T O R E T Y P Copper Figure Subtransmission Conductor Types AGE PROFILE Figure shows the age profile of our subtransmission lines. The life expectancy of conductors is 58 years. The graph shows the length of line installed in each year. There have been periods of major investment in our subtransmission lines. The spike at year five (2010) corresponds to the construction of a subtransmission line to the Te Uku Wind Farm. In year 17 (1998), the link between Horotiu and Weavers substations was constructed. A number of areas of the subtransmission network were strengthened in year 38 (1977). AGE PROFILE OF SUBTRANSMISSION CONDUCTOR Length (km) Age (Years) Figure Age Profile of Subtransmission Lines 44
45 CONDITION The condition profile of the subtransmission lines is shown in Figure Field inspections indicate that in general, the condition of subtransmission lines is good. CONDITION OF SUBTRANSMISSION LINES Length (km) CONDITION Figure Condition of Subtransmission Lines SUBTRANSMISSION CABLES Subtransmission cables connect GXPs to the zone substations at 33kV and are placed underground. POPULATION We have 266km of subtransmission cables, with 81km in Hamilton. Figure shows the geographical location of our subtransmission cables. There are two types of subtransmission cables in use. Cross-linked polyethene (XLPE) aluminium cables comprise 88% of cables in use. The remainder are various types of paper insulated, lead covered (PILC) copper cables. The move from copper PILC cables to aluminium XLPE insulated cables began in the mid-1970s. We have standardised on the use of XLPE insulated single core aluminium conductor cables with copper wire screens. LOCATION OF SUBTRANSMISSION CABLES 160 PILC XLPE Length (km) Rural Hamilton Huntly LOCATION Figure Location of Subtransmission Cables Ngaruawahia Raglan 45
46 WEL does not have any gas or oil filled subtransmission cables in the network. AGE PROFILE Figure shows the age profile for subtransmission cables. The age of PILC cables ranges from 33 to 45 years and XLPE cables range in age from new to 45 years old. The weighted average age of the XLPE cables is nine years and the weighted average age of the PILC is 38 years old. The peak in year five was due to the installation of the cables connecting Avalon, Te Kowhai and Whatawhata. The peak in year 10 was due to the cables installed as part of the Te Uku windfarm project.. AGE PROFILE OF SUBTRANSMISSION CABLES 60 PILC XLPE 50 Length (km) AGE (YEARS) Figure Age Profile of Subtransmission Cables The life expectancy of the cables is shown in Table CABLE TYPE LIFE EXPECTANCY (YEARS) PILC Cables 70 XLPE Cables 45 Table Life Expectancy of Subtransmission Cables CONDITION The condition of our subtransmission cables is considered to be generally good. The only issues experienced to date are joint failures in a limited number of cables. These failures have been attributed to poor workmanship on that section of the cable network during installation. A programme of partial discharge tests has been initiated to determine the extent of these problems SUBTRANSMISSION CBS The majority of subtransmission CBs are located within substations on incoming circuits. Their main function is to protect transformers at each substation. A CB is also a switching device that can be operated either manually or automatically. When operated automatically it interrupts the flow of electricity if the current exceeds a predetermined level. POPULATION We own kV CBs. Three types of CB are in use on our network; oil, gas insulated (SF 6 ), and vacuum breakers. Typically the older oil circuit breakers were installed in outdoor switchyards, while the newer types (gas insulated and vacuum) are more often installed indoors. Over recent years, the older outdoor switchgear has been upgraded to indoor switchgear. Consequently only 24 % of the fleet remains outdoors. Figure shows the distribution by type. 46
47 SUBTRANSMISSION BREAKER TYPES Number of Breakers SF6 (Indoor) Mineral Oil (Outdoor) Vacuum (Indoor) Figure Subtransmission CBs by Type CIRCUIT BREAKER TYPE AGE PROFILE Figure shows the age profile of the CBs installed on the network. Most 33kV CBs installed over the last 10 years were indoor SF 6 type. AGE PROFILE OF SUBTRANSMISSION CBs INDOOR OUTDOOR Number of CBs AGE (YEARS) Figure Age Profile of Subtransmission CBs The expected lives are shown in Table ASSET LIFE EXPECTANCY (YEARS) Outdoor Breakers 45 Indoor Breakers 60 Table Life Expectancy of Subtransmission CBs 47
48 CONDITION All 33kV CBs are regularly maintained in accordance with recognised maintenance practices and are in good condition. The condition profile of the subtransmission CBs is shown in Figure CONDITION OF SUBTRANSMISSION CBs Number of CBs CONDITION Figure Condition of Subtransmission CBs 3.3 ZONE SUBSTATIONS Zone substations transform power from the 33kV subtransmission to the 11kV distribution voltage. Switching stations provide the capability to switch load between different zone substation circuits, thereby providing security of supply during fault conditions or planned maintenance. We operate 25 zone substations sites with construction dates ranging from the 1950s to Six of the 25 zone substations have outdoor switchyards which include 33kV CBs, outdoor instrument transformers, switches, insulators and busbars. 17 of the zone substations have N-1 security and eight have N security in accordance with the WEL security standard, which is discussed in further detail in Chapter 7. Substations include buildings, outdoor structures, foundations, fences, oil interception equipment and auxiliary equipment such as low voltage AC and DC power supplies. The major plant items located at substations include power transformers and the associated switchgear. Within the zone substation asset class there are three asset categories: Power transformers Indoor switchboards Substation buildings POWER TRANSFORMERS Power transformers reduce the voltage from the subtransmission voltage (33kV) to distribution voltage (11kV). POPULATION We own 44 power transformers with installation dates ranging from 1960 to There are two 10MVA and two 15MVA spare power transformers strategically located in our zone substations that are readily available when needed. Figure shows the size distribution of our power transformers. The majority are rated at 15/23 MVA with forced air-cooling. 48
49 DISTRIBUTION OF POWER TRANSFORMER RATINGS 30 Number of Transformers /23 TRANSFORMER RATING (MVA) Figure Distribution of Power Transformer by Ratings AGE PROFILE The age profile of our power transformers is shown in Figure AGE PROFILE OF POWER TRANSFORMERS 5 4 Number of Transformers AGE (YEARS) Figure Age Profile of Power Transformers The average age of the power transformer fleet is currently 21 years old. The life expectancy of power transformers is 60 years. Some transformers undergo a mid-life refurbishment to achieve this lifespan. Transformers often are upgraded, not because of old age, but because the load has exceeded their capacity. In such situations we rotate the transformers from one substation to another smaller one. CONDITION The internal condition of the transformers is monitored by utilising annual Dissolved Gas Analysis (DGA) and periodic furans analysis to give an indication of remaining life. Test results are then correlated with the results from other diagnostic testing such as Sweep Frequency Response Analysis (SFRA) and Dissipation Factor tests. The overall results of the testing shows that our power transformers are in a good condition. This is illustrated in Figure
50 CONDITION OF POWER TRANSFORMERS Number of Power Transformers CONDITION Figure Condition of Power Transformers SWITCHBOARDS Switchboards contain switchgear that provides control and protection for the network. There are two main types of switchgear; Air Insulated Switchgear (AIS) and Gas Insulated Switchgear (GIS). GIS is located indoors and installed in our newly constructed substations. Rural zone substations with outdoor switchyards are progressively being converted to indoor. POPULATION We own 60 33kV and 11kV switchboards, with 51 being AIS and nine GIS within our subtransmission network. Generally, the type of switchboards is a reflection of the age of the substations. AGE PROFILE The age profile of the indoor switchboards is shown in Figure The average age of switchboards is 18 years. The life expectancy of switchboards is 60 years. AGE PROFILE OF SWITCHBOARDS Number of Switchboards AGE (YEARS) Figure Age Profile of Indoor Switchboards 50
51 CONDITION The condition of the majority of our switchboards is good. Partial discharge appears to be a problem for some of the older ones. CONDITION OF SWITCHBOARDS Number of Switchboards CONDITION Figure Condition of Switchboards SUBSTATION BUILDINGS Substation buildings provide protection against environmental factors and prevent unauthorised entry reducing safety risk to members of the public. POPULATION In total there are 32 zone substation buildings across the 25 zone substation sites that WEL operates. These were built to meet specific site and regulatory requirements at the time of construction. As the construction of our substations occurred over several decades they have differing designs. AGE PROFILE The design working life of the substation buildings is 50 years. Figure shows the age profile for substation buildings. AGE PROFILE OF SUBSTATION BUILDINGS Number of Substations AGE (YEARS) Figure Age Profile of Substation Buildings 51
52 CONDITION Our substation buildings were also assessed by registered quantity surveyors as part of a financial valuation process in The assessment found that the majority of them are in good condition, as illustrated in Figure When a substation is substantially refurbished the buildings are usually reinforced or completely rebuilt. CONDITION OF ZONE SUBSTATION BUILDINGS Number of Buildings CONDITION Figure Condition of Zone Substation Buildings The seismic ratings of most of the buildings has also been assessed. WEL commenced a programme of specialised seismic assessment in The results of the seismic assessment to date are shown in Figure SEISMIC CONDITION OF SUBSTATION BUILDINGS >75%+ of NBS > 33% < 75% of NBS Strengthening work planned Figure Distribution of Substation Building Seismic Conditions To be assessed All new WEL Zone Substation buildings will be designed and built to IL4 standard. Seismic strengthening of existing zone substation buildings where practical shall be to IL4 and a minimum of 75% of National Building Standard (NBS). Where it is not practical to strengthen a building to the required level then a cost-risk assessment will be carried out to determine the most practical level. 52
53 3.4 DISTRIBUTION AND LV LINES The distribution network conveys electricity from zone substations to the LV network. The LV network supplies the majority of our customers. The network includes overhead lines and underground cables. The total length is approximately 6,000km, of which 55% is overhead line. This section describes the following asset categories which are included within Distribution and LV Lines: Poles CrossarmsDistribution and LV conductors POLES Poles support the overhead lines. They play a key role in isolating conductors and preventing contact with people and property. POPULATION We own approximately 38,600 poles. Figure shows the distribution by construction material. The majority are concrete poles, with a small number of softwood, hardwood and steel poles remaining. DISTRIBUTION OF POLE MATERIAL IN HV AND LV NETWORKS Number of Poles Concrete Softwood POLE MATERIAL Figure Distribution of Pole Material in HV and LV Networks AGE PROFILE Figure shows the age profiles of our poles. Both concrete poles and wooden poles have an average age of 31 years. Hardwood Steel 53
54 AGE PROFILE OF POLES 3500 CONCRETE POLES/STEEL STRUCTURE WOOD POLES Number of Poles Figure Age Profile of Poles AGE (YEARS) The life expectancy of concrete poles is 70 years and 45 years for wooden poles as illustrated in Table The population of wooden poles is older and closer to end of life than the concrete ones. ASSET LIFE EXPECTANCY (YEARS) Wooden Poles 45 Concrete Poles 70 Table Life Expectancy of HV and LV Poles CONDITION The distribution of pole condition is shown in Figure CONDITION OF POLES Number of Poles Figure Condition of Poles CONDITION The majority of concrete poles are in good condition as the average age is young compared to their life expectancy. 54
55 There are approximately 500 hardwood poles remaining on our network that range in condition from good to poor. WEL stopped installing hardwood poles on the network approximately 15 years ago and as such, it is expected that most wooden poles will need to be replaced in the AMP period. All hardwood poles have been tested and monitored for hidden rot at ground level and poles that were identified as needing replacement have been replaced with concrete ones. Figure shows the AHI profile of our poles. POLES HEALTH INDEX PROFILE Number of Poles (0-1) (1-2) (2-3) (3-4) (4-5) (5-6) (6-7) (7-8) (8-9) (9-10) (10+) No Result HI CATEGORY Figure Poles Health Index Profile CROSSARMS Crossarms are found at the top of our poles. They support and insulate the conductors and separate each of the three phase conductors. Until recently all of our crossarms were constructed from hardwood, however we have changed our design standard for new crossarms on HV circuits to steel. We are currently investigating the use of fibreglass composite crossarms and expect to be installing these next year, due to these crossarms having similar life expectancy to steel but significantly less weight. WEL has also installed virtual crossarms which are a type of insulator that attaches the line directly to the pole. As the majority of the existing crossarms are wooden, which have half the life expectancy of the concrete poles, they are generally replaced half way through the life of the pole. POPULATION There are 70,186 crossarms installed on our network. The majority of crossarms are wooden as shown in Figure
56 DISTRIBUTION OF CROSSARM MATERIAL Number of Crossarms Wood Steel Virtual MATERIAL Figure Distribution of Crossarm Material AGE PROFILE Figure shows the age profile of wooden and metal crossarms. The average age of the fleet is 30 years. AGE PROFILE OF CROSSARMS WOOD METAL Number of Crossarms Figure Age Profile of Crossarms As shown in Table the life expectancy of wooden crossarms is 35 years and metal crossarms is 60 years. Therefore, many of the wooden crossarms already exceed their expected lives. Consequently there is a high failure rate, especially of the insulators. Chapter 8 details the maintenance strategies designed to address these issues. ASSET LIFE EXPECTANCY (YEARS) Wooden Crossarms 35 Metal Crossarms 60 Table Life Expectancy of Crossarms AGE (YEARS) 56
57 CONDITION The condition distribution of our crossarms is shown in Figure CONDITION RATING OF CROSSARMS Number of Crossarms CONDITION Figure Condition of Distribution Crossarms The AHI profile for our crossarms is shown in Figure The graph indicates that a significant number are approaching the stage where they will need to be replaced. The AHI and the factors used to assess an asset are explained in section 3.1. CROSSARM HEALTH INDEX PROFILE Number of Assets (0-1) (1-2) (2-3) (3-4) (4-5) (5-6) (6-7) (7-8) (8-9) (9-10) (10+) No Result Figure Crossarm Health Index Profile DISTRIBUTION AND LV CONDUCTORS HI CATEGORY Distribution and LV lines transport electricity from zone substations to our customers on the LV network. POPULATION We own 3,296km of overhead distribution and LV lines, of which 1,940km is 11kV distribution lines and 1,356km is LV. 57
58 Figure shows the distribution of overhead conductor types. DISTRIBUTION AND LV CONDUCTOR TYPES Length (km) Gopher Copper Bare (16mm 2 ) Ferret Copper PVC (70mm 2 ) Copper Bare (70mm 2 ) Copper Bare (25mm 2 ) Dingo Mink Flourine Copper PVC (16mm 2 ) Stoat Copper PVC (25mm 2 ) Other Aluminium Light Beetle Dog ABC (95mm 2 ) Aluminium Medium ABC (35mm 2 ) Copper Bare (40mm 2 ) Krypton Iodine Copper Bare (35mm 2 ) CONDUCTOR TYPE Figure Distribution and LV Conductor Types Figure shows the location of the distribution and LV lines is primarily in the rural areas. Urban areas are typically reticulated with underground cables. LOCATION OF DISTRIBUTION LINES Length (km) Rural Hamilton Huntly Figure Location of Distribution of LV Lines Ngaruawahia LOCATION AGE PROFILE Figure shows the age profile of all types of the distribution and LV conductors. The average age of our overhead conductors is 33 years. Raglan Te Kauwhata Taupiri 58
59 AGE PROFILE OF DISTRIBUTION AND LV CONDUCTORS Length (km) Figure Age Profile of HV and LV Conductor AGE (YEARS) The spike in installing of new conductors corresponds to the rapid expansion of the network during the 1970s. The life expectancy of conductors is 55 to 60 years depending on conductor type.. CONDITION The condition distribution of overhead line conductors is shown in Figure CONDITION OF DISTRIBUTION AND LV CONDUCTORS Length (km) CONDITION Figure Condition of Distribution and LV Conductor The condition is further supported by the AHI shown in Figure Approximately 500km of distribution overhead line conductors are becoming poor in condition. These are predominantly 16mm 2 copper conductors which are being analysed for replacement through the CBRM model. 59
60 DISTRIBUTION CONDUCTOR HEALTH INDEX PROFILE Length (km) (0-1) (1-2) (2-3) (3-4) (4-5) (5-6) (6-7) (7-8) (8-9) (9-10) (10+) No Result Figure Distribution Conductor Health Index Profile HI CATEGORY The majority of the conductors with an AHI of 7 or greater are the 16 mm 2 copper type. This issue and remedial actions are discussed further in Chapter DISTRIBUTION AND LV CABLES The distribution network conveys electricity from the zone substations to our customers via the LV network. The network is a mixture of overhead lines and underground cables. The total length is approximately 6,000km, 45% of which is underground cables. This section describes our Distribution cables and LV Cables DISTRIBUTION CABLES Distribution cables form part of the 11kV distribution network. POPULATION We own 676km of 11kV underground cables. All of the 11kV cable installed prior to 1976 was PILC. Between 1976 and 1990 XLPE cable was installed in the Hamilton CBD area with predominantly PILC installed in other areas. Since 1990 most cable installations have been XLPE. Most of the 11kV underground network is now aluminium conductor (71%), the remainder is copper. AGE PROFILE Figure shows the age profile of the distribution cable. The average age of PILC cable is 39 years and the average age of XLPE cable is 15 years. 60
61 AGE PROFILE OF DISTRIBUTION CABLE PILC XLPE Length (km) AGE (YEARS) Figure Age Profile of Distribution Cable The life expectancy of cables is shown in Table ASSET LIFE EXPECTANCY (YEARS) XLPE Cables 45 PILC Cables 70 Table Life Expectancy of Distribution Cables While some of the XLPE cables may be reaching the end of their expected life, experience has shown that XLPE cables can usually be safely operated for much longer than 45 years. CONDITION The condition of underground cable is hard to assess. The main indication of underground cable health is the number of faults that occur on it. A key determining factor of cable health is the quality of its installation. The cables are generally in good condition. The 11kV ring around the CBD was built around 1945 and still supplies customers very reliably, this is not shown in figure as the records regarding the installation are not reliable LV CABLES The LV cables convey electricity from distribution transformers to customers at a domestic voltage level. POPULATION We have 2,165km of installed LV underground cable, of which 7km is PILC and the rest is XLPE. Figure shows that the majority of LV XLPE cable is in the Hamilton area. Figure shows virtually all the LV PILC cable is in Hamilton, with a small amount in Huntly. 61
62 DISTRIBUTION OF LV XLPE TYPE CABLE Lenght (km) Hamilton Rural Huntly Ngaruawahia External Subdivisions Raglan Te Kauwhata Taupiri Figure Location of LV XLPE Type Cable LOCATION This situation is similar for PILC Cable as shown in Figure DISTRIBUTION OF LV PILC TYPE CABLE Length (km) Hamilton Huntly Rural Figure Location of LV PILC Type Cable Te Kauwhata LOCATION AGE PROFILE Figure shows the age profile of the underground LV cables in the network. The average age of PILC cable is 65 years, because small amounts have been installed over the years, and the average age of XLPE cable is 21 years. Taupiri Ngaruawahia Raglan 62
63 AGE PROFILE OF LV CABLE PILC LENGTH (KM) XLPE LENGTH (KM) Length (km) Figure Age Profile of LV Cable AGE (YEARS) PILC cables have a life expectancy of 70 years and XLPE cables have a design life expectancy of 45 years as shown in Table Some of the cables are reaching the end of their life expectancy. However, operational experience shows that XLPE can be safely operated for much longer than 45 years. ASSET LIFE EXPECTANCY (YEARS) XLPE Cables 45 PILC Cables 70 Table Life Expectancy of LV Cable CONDITION The condition of underground LV cables is difficult to access. However to date the number of failures experienced has been small. The majority of faults have been caused by damage from external factors such as the works associated with the installation of ultra-fast fibre around Hamilton. 3.6 DISTRIBUTION SUBSTATIONS AND TRANSFORMERS There are two asset categories within the distribution substations and transformers asset class: Distribution switching stations; and Distribution transformers DISTRIBUTION SWITCHING STATIONS Distribution switching stations provide the capability to switch between interconnected 11kV circuits providing security of supply during fault conditions or planned maintenance. POPULATION WEL operates 17 11kV switching stations that were installed between 1967 and
64 AGE PROFILE The age profile of switching stations is shown in Figure AGE PROFILE OF SWITCHING STATIONS 5 Number of Switching Subs AGE (YEARS) Figure Age Profile of Switching Substations CONDITION The condition profile of switching stations is shown in Figure CONDITION OF SWITCHING STATIONS 12 Number of Switching Stations Figure Condition of Switching Substations CONDITION The seismic ratings of most of the buildings have also been assessed. WEL commenced a programme of specialised seismic assessment in The results of the seismic assessment to date are shown in Figure
65 SEISMIC CONDITION OF SWITCHING STATION BUILDINGS >75%+ of NBS > 33% < 75% of NBS Figure Seismic Condition of Switching Substations Strengthening work planned To be assessed All new WEL switching station buildings will be designed and built to IL4 standard. Seismic strengthening of existing switching station buildings, where practical, shall be to IL3 and a minimum of 75% of NBS. Where it is not practical to strengthen a building to the required level then a cost-risk analysis will be carried out to determine the most practical level DISTRIBUTION TRANSFORMERS Distribution transformers step down electricity supply from the 11kV distribution voltage to LV. Transformers allow adjustments so the supply voltage remains within statutory limits. Distribution transformers are either mounted on poles or the ground. Following the Christchurch earthquakes industry practice has changed so that larger transformers are always ground mounted. POPULATION We own 3,898 pole mounted transformers and 1,860 ground mounted transformers. Due to economies of scale we purchase transformers in a limited number of predefined sizes. The standard pole mounted transformer sizes we utilise are 1, 30, 50 and 100kVA. Standard ground mounted transformer sizes are 100, 200, 300, 500, 750 and 1,000kVA. The population of transformers in each size is shown in Figure
66 POPULATION OF DISTRIBUTION TRANSFORMERS POLE MOUNTED GROUND MOUNTED 1600 Number of Transformers kva Rating Figure Population of Distribution Transformers AGE PROFILE Figure shows the age profile of our distribution transformers. The average age is 19 years. The significant investment made over the last 20 years was driven by an active replacement programme of older transformers in poor condition (often pole mounted) and the growth in load necessitating capacity upgrades. Consequently the overall population of distribution transformers is young compared to other asset fleets. There are a small number of transformers that have exceeded their life expectancy, but they are still operating effectively. AGE PROFILE OF DISTRIBUTION TRANSFORMERS GROUND MOUNTED POLE MOUNTED Number of Transformers AGE (YEARS) Figure Age Profile of Distribution Transformers CONDITION Figure shows the condition profile of our distribution transformers. 66
67 CONDITION OF DISTRIBUTION TRANSFORMERS Number of Transformers Figure Condition of Distribution Transformers CONDITION The AHI for distribution transformers is shown in Figure The AHI and the factors used to assess an asset are explained in section 3.1. DISTRIBUTION TRANSFORMERS HEALTH INDEX PROFILE Number of Assets (0-1) (1-2) (2-3) (3-4) (4-5) (5-6) (6-7) (7-8) (8-9) (9-10) (10+) No Result HI CATEGORY Figure Distribution Transformers Health Index Profile The condition profile and the health indices show that the fleet is in good health. The transformers with a very poor health index of 8-9, correspond to those that have exceeded their life expectancy. 3.7 DISTRIBUTION SWITCHGEAR Four switch types exist within our network. These are: Ring Main Units (RMUs). Circuit Breakers. Air Break Switches (includes the modern SF 6 and Vacuum types) Reclosers and Sectionalisers. Each switch type is discussed in the following sections. 67
68 3.7.1 RMUS RMUs are ground mounted switchgear that connects to 11kV cables. There are 745 RMUs in operation on the network ranging from new to approximately 60 years old. Older RMUs are typically oil insulated with all new RMUs being SF 6 gas-insulated switchgear. POPULATION The RMU are a mixture of oil filled and gas filled types, as shown in Figure TYPE OF RMUs Number of RMUs OIL TYPE SF6 Figure RMU Types AGE PROFILE The age profile of RMUs is shown in Figure The average age is 15 years. AGE PROFILE OF RMUS OIL SF Number of RMUs AGE (YEARS) Figure Age Profile of RMUs 68
69 The life expectancy of RMUs is detailed in Table ASSET LIFE EXPECTANCY (YEARS) Oil Filled RMU 40 Gas Filled RMU 55 Table Life Expectancy of RMUs CONDITION The distribution of RMU conditions is shown in Figure CONDITION OF RMUs Number of RMUs Figure Condition of RMUs CONDITION A few oil filled RMUs failed from an incorrect set up of the internal contacts. Consequently a rigorous inspection programme was instigated. Where appropriate the RMUs were replaced. As a result of this programme the overall condition and health profile for RMUs is good. The AHI profile for RMUs is shown in Figure The AHI and the factors used to assess an asset are explained in section 3.1. RMU HEALTH INDEX 300 Number of Assets (0-1) (1-2) (2-3) (3-4) (4-5) (5-6) (6-7) (7-8) (8-9) (9-10) (10+) No Result Figure RMU Health Index Profile HI CATEGORY 69
70 3.7.2 DISTRIBUTION CIRCUIT BREAKERS (CBS) Distribution CBs are used to control and protect the distribution network. The CB is a switching device that can be either operated manually or automatically. When operating automatically they interrupt the flow of electricity if the current exceeds predetermined limits. POPULATION We have 430 CBs on our network which range in age from new to over 45 years old. The CBs deployed are a mix of technologies which include oil filled, SF 6 and vacuum as shown in Figure The oil-filled CBs are the oldest followed by SF 6 and vacuum types. DISTRIBUTION CB TYPES Number of CBs VACUUM OIL SF6 TYPE Figure Distribution CB Types AGE PROFILE The age profile is shown in Figure The average age of the fleet is 20 years. AGE PROFILE OF DISTRIBUTION CBs Number of Cbs OIL SF6 VACUUM AGE (YEARS) 70 Figure Age Profile of Distribution CBs
71 The life expectancy of CBs by type is shown in Table ASSET LIFE EXPECTANCY (YEARS) Oil 45 SF 6 55 Vacuum 55 Table Life Expectancy of Distribution CBs CONDITION The condition of CBs is summarised in Figure CONDITION OF ABSs Number of ABSs Figure Condition of CBs CONDITION Routine condition monitoring indicates there are no significant maintenance problems. Since the number of operations of the circuit breakers is well below operational limits, life expectancy is likely to exceed the standard life for each type of CB. Vacuum and SF 6 CBs are now used for all new installations, as they have low maintenance requirements DISTRIBUTION AIR BREAK SWITCHES (ABS) ABSs are installed on the network and used for isolation and switching. ABSs are categorised as load break or non-load break. Operators are able to open a load break switch when current is flowing through it. A non-load break switch is designed to only open when no current is flowing. POPULATION We own 1,046 ABSs where approximately 77 can be operated remotely from our centralised control room. This has the dual advantage of reducing SAIDI and improving safety. The location of our ABSs is shown in Figure A large proportion are in the rural areas as remote control capability in rural areas provides greater benefit than in urban areas. 71
72 DISTRIBUTION OF ABSs Number of ABSs Rural Hamilton Huntly Ngaruawahia Raglan Te Kauwhata Taupiri Figure Distribution of ABSs LOCATION AGE PROFILE The age profile of ABSs is shown in Figure The average age is 22 years. AGE PROFILE OF ABSs Number of ABSs Figure Age Profile of ABs AGE (YEARS) The life expectancy of ABSs is 35 years. The replacement programme for our ABSs is discussed further in Chapter 8. CONDITION The condition of ABSs is generally good, as reflected in Figure The AHI profile of ABSs is shown in Figure and indicates a substantial number of ABSs have a medium AHI value, which signifies an increasing rate of asset degradation over the AMP period. The renewal strategy to address this is discussed in Chapter 8. 72
73 CONDITION OF ABSs Number of ABSs CONDITION Figure Condition Profile of ABs ABS HEALTH INDEX PROFILE Number of Assets (0-1) (1-2) (2-3) (3-4) (4-5) (5-6) (6-7) (7-8) (8-9) (9-10) (10+) No Result Figure ABS Health Index Profile HI CATEGORY The condition of the ABS fleet is good, but the health index shows about a third of the fleet is in only fair condition. The reason for the difference lies in the nature of the condition assessment and the extra factors included in the assessment of the health index. The condition assessment is based on a visual inspection, so the information provided does not include weaknesses such as impending insulator failure. The AHI accounts for the relatively old age of the fleet and environmental factors such as proximity to waterways and the sea. The age in particular has a strong influence on the above AHI DISTRIBUTION RECLOSERS AND SECTIONALISERS Sectionalisers are self-contained, circuit-opening devices used in conjunction with reclosers to automatically isolate faulted sections of the network. Sectionalisers also allow operators to locate a fault more accurately and quickly, as well as minimising the number of customers affected by any one fault. A recloser, is a circuit breaker equipped with a mechanism that can automatically close the breaker after it has been opened due to a fault. Reclosers are used to detect and interrupt momentary faults and have the ability to automatically restore power to the line subject to the fault. 73
74 POPULATION We own 51 sectionalisers and 64 reclosers. There are a mix of the dropout sectionalisers and enclosed sectionalisers and reclosers on our network as shown in Figure RECLOSERS AND SECTIONALISERS BY TYPE 120 SECTIONALISER RECLOSER Number of Reclosers and Sectionalisers Dropout Type of Recloser or Sectionaliser Enclosed Figure Distribution of Recloser & Sectionaliser Types AGE PROFILE Figure shows age profile of the reclosers and sectionalisers. A large number of dropout sectionalisers were installed in 2004 and 2005 which was part of a reliability improvement programme, while the sectionalisers have the ability to improve reliability these units have been problematic and are now targeted for replacement. RECLOSERS AND SECTIONALISERS BY TYPE 25 ENCLOSED SECTIONALISERS DROPOUTS SECTIONALISERS RECLOSERS Number of Reclosers and Sectionalisers AGE (YEARS) Figure Age Profile of Reclosers & Sectionalisers The life expectancy of sectionalisers and reclosers is 40 years. The average age of the fleet is five years. 74
75 CONDITION Routine testing of old sectionalisers is detrimental to their reliability. Therefore testing is only done when there is an indication that an incorrect operation has occurred. All reclosers are generally in good condition. Ancillary devices such as COMMs protection and battery systems are maintained periodically. The condition profile is shown in Figure CONDITION OF RECLOSERS AND SECTIONALISERS Number of Reclosers and Sectionalisers CONDITION Figure Condition of Reclosers & Sectionalisers Figure shows the AHI of the sectionalisers and reclosers. The AHI is further explained in section 3.1. RECLOSERS AND SECTIONALISERS HEALTH INDEX PROFILE Number of Assets (0-1) (1-2) (2-3) (3-4) (4-5) (5-6) (6-7) (7-8) (8-9) (9-10) (10+) No Result Figure Reclosers & Sectionalisers Health Index Profile HI CATEGORY Since a large majority of the fleet is comparatively young the fleet is in good condition overall. 75
76 3.8 OTHER SYSTEM FIXED ASSETS This section covers the electrical protection, load control equipment and other system fixed assets and is structured by asset class: LV Pillars Protection Relays NMS Load Control Equipment Meters LV PILLARS The LV pillars provide termination points for LV cables, as well as fusing and isolation points. POPULATION There are two types of LV pillars; distribution pillars and service pillars. Distribution pillars are the connection points for larger LV supplies, and allow for easy back feeding. They are usually located close to town centres. Service pillars are the point of connection between the main LV feeder and a service main to the customer. There are 24,562 LV pillars on the network. AGE PROFILE The age profile of LV pillars is shown in Figure AGE PROFILE OF LV PILLARS Number of Pillars Figure Age Profile of LV Pillars AGE (YEARS) CONDITION The condition of LV pillars is shown in Figure They are in good condition, but if the lid is open they can be a public health riskso are patrolled regularly. 76
77 CONDITION OF LV PILLARS Number of PIllars CONDITION Figure Condition of LV Pillars PROTECTION RELAYS Electrical protection is the primary safety system within the electricity network. Protection relays are required to act quickly and trip a CB within a few thousandths of a second. POPULATION We own 831 relays in total, with a mixture of electromechanical and numeric protection relays, with electromechanical representing the older relays. The distribution of relays is shown in Figure below. TYPE OF PROTECTION EQUIPMENT 500 Number of Protection Equipment ElectroMechanical Figure Type of Protection Equipment TYPE OF PROTECTION Numeric 77
78 AGE PROFILE Figure illustrates the age profile of the protection equipment. AGE PROFILE OF PROTECTION EQUIPMENT ELECTROMECHANICAL NUMERIC Number of Protection Equipment AGE (YEARS) Figure Age Profile of Protection Equipment The average age of the protection relays on our network is 19 years. The life expectancy for all types of protection relays is 30 years. CONDITION The condition of the newer relays is good, but the older relays need replacing. This is discussed further in Chapter 8. The distribution of their condition is shown in Figure CONDITION OF PROTECTION EQUIPMENT Number of Protection Equipment Figure Condition of Protection Equipment CONDITION In managing numerical relays the configuration data is critical to the correct operation of the relays in the field. In order to ensure the integrity of this data WEL uses a protection database. 78
79 3.8.3 NETWORK MANAGEMENT SYSTEM (NMS) The NMS enables the fast and efficient control of the electricity network for the operator. It consists of the General Electric PowerOn Fusion software package and data storage systems integrated with our SCADA network. The Supervisory Control And Data Acquisition (SCADA) network includes Remote Terminal Units (RTUs) that communicate back to the control room equipment in real time. The key business benefit of the system is to enhance the safe, reliable and efficient management of the network, as well as provide effective customer service. The NMS consists of the following subsystems: Distribution Management System (DMS); Outage Management System (OMS); and Trouble Call Taker, with smart meter information integration. The DMS is the core of the NMS. It collects the real time information and disseminates it to users and other subsystems. A key element of the DMS is the connectivity model that allows operators to easily see the effects of actual and planned switching. It also controls all switching management steps (preparation, validation and execution) so can enforce built in safety logic throughout all stages. This is a particularly powerful aspect of the system, especially from a safety perspective. The OMS is an application designed to aid in the management, prioritisation and administration of outages on the network and individual customers. The OMS automatically associates customer call taker calls and clusters of calls to the one incident and to the respective devices supplying them. To do this OMS relies on the Installation Control Point (ICP) to transformer relationship and the connectivity of the DMS. Last gasp data from the Smart Boxes has been integrated with the OMS to improve fault location. The Trouble Call Taker records customer calls and provides vital information to Dispatch. The information derived from the calls is integrated with the OMS to predict the location of faults or likely future faults. It can also be used for post event analysis. It is available to the internal WEL dispatch team as well as the external after-hours call centre staff. Access to NMS functionality is controlled in a secure authorisation hierarchy. System Management, System Administration, Operator, Call Taker, Dispatcher, Engineering, Report Access or View Only provide different levels of system access. Access can be via a full client installed on a workstation or through a web browser. POPULATION We own 343 RTUs. The older fleet are progressively being upgraded or replaced to provide improved functionality and communications capability. Figure shows the location of our RTUs. DISTRIBUTION OF RTUS Number of RTUs Substation Ripple Plant Control Poletop LOCATION Figure Location of Remote Terminal Units 79
80 AGE PROFILE The lifecycle of the NMS software is approximately 15 years. The NMS software was initially commissioned in December 2010 and the last upgrade was completed in March The life expectancy of the supporting infrastructure, including the RTUs, is 15 years. The average age is 8.5 years. The age profile of NMS related equipment (RTUs) is shown in Figure AGE PROFILE OF NMS AND RELATED EQUIPMENT Number of Units AGE (YEARS) Figure Age Profile of NMS Infrastructure CONDITION The condition of the control room NMS equipment is good with all computer hardware replaced in March The next software upgrade is planned to be completed in March LOAD CONTROL EQUIPMENT Load control is an important part of managing peak loads on the network. It is initiated from the NMS which provides control signals to the ripple injection plants which in turn signal the ripple relays located at each customers site. Load control equipment consists of the ripple injection plants and ripple relays. The load management system within the NMS provides centralised intelligence to monitor network peak demand, forecasting expected demand, and managing control of interruptible load within service levels to ensure demand does not exceed targets. Furthermore load management functionality is used to manage the total Regional Coincident Peak Demand (RCPD). Other controls provided by the load management system include street lighting and meter tariff rate control. POPULATION We own three 33kV static ripple injection sets and two 11kV static sets which operate at 283Hz. Load Control Equipment is generally located at GXPs and where other signal propagation issues exist. Specifically the 33kV injection plants are located at the Hamilton GXP, Te Kowhai GXP and Weavers substation for the Northern area. The 11kV static sets are located at Pukete and Hamilton 11kV zone substations. Between 2004 and 2006 new ripple relays were installed at customer premises across the central region of the network. However, the northern region was left with the old relays. Part of the justification for installing Smart Boxes in the northern region was the opportunity to replace the old ripple relays with new ones fitted to the Smart Boxes. This project is now finished, the old ripple plant has been switched off and decommissioned. AGE PROFILE The life expectancy of a load control plant is 20 years. The age profile of our load control equipment is shown in Figure
81 AGE PROFILE OF LOAD CONTROLLERS 3 Number os Sets AGE (YEARS) Figure Age Profile of Load Controllers CONDITION The load control plants are within their life expectancy and are generally in good condition METERS WEL has a range of meters from 33kV meters down to LV smart meters. Further information about the systems that support Smart Boxes is contained within section POPULATION The subtransmission and distribution meters are used for revenue protection, load control, operation, fault management and network protection. WEL has currently 57,952 LV smart meters installed. The vast majority of these meters are installed as check meters in series with revenue meters, except approximately 500 which are currently used as revenue meters. WEL has also installed a small number of data loggers at locations of special interest, which can be relocated as required for investigative work. All smart meters can also act as data loggers returning data quality information. AGE PROFILE The average age of the subtransmission and distribution meters is 3 years. The low voltage smart meters are installed as compliant meters under the Electricity Industry Participation Code 2010 (Code), requiring strict auditing of procedures and a controlled maintenance and inspection management over their total life span of 15 years. The number of Smart Boxes installed over recent years is shown in Figure SMART METERS INSTALLED PER YEAR Number of installed meters Figure Smart Meters Installed per Year 81
82 CONDITION The condition of all these assets is good; all low voltage meters are maintained under the Code and the subtransmission meters are housed indoors. 3.9 OTHER ASSETS This section describes the asset classes that are not directly part of the normal operation of the network BACKUP GENERATORS We have three emergency generators, one in the new Disaster Recovery Centre (DRC), one for the corporate office and depot and one at the old DRC. The new 100kVA generator at the DRC site is only a year old and in excellent condition (condition 5). The depot s 100kVA generator is six years old and in good condition (condition 4) EMERGENCY CRITICAL SPARES We hold the following critical spares reserved for emergency conditions: 4km of overhead 33kV line Substation battery bank Protection relays Substation communication equipment Four zone transformers, two 10MVA and two 15MVA transformers One 33kV circuit breaker 33kV and 11kV sectionalisers and reclosers 33kV and 11kV air break switches RMUs are always in stock so not included in the critical spares list explicitly. The zone transformers will be distributed geographically across the network and on opposite sides of the Waikato River should bridges be destroyed in a disaster HEAD OFFICE AND DEPOT BUILDINGS 82 We own our Head Office building and the depot for our field staff. These buildings are 7 and 8 years old respectively. Our Head Office has a four star energy efficiency rating. Both buildings are in very good condition COMPUTER HARDWARE, SOFTWARE AND DATA The core software packages within WEL are an Enterprise Resource Planning system (ERP system), a Geographic Information System (GeoIS) and the NMS. Smaller and more focused systems include the vegetation management system and the Smart Box head end. WEL continuously monitors and improves the data quality within these systems through an information framework. GEOGRAPHIC INFORMATION SYSTEM (GEOIS) The assets managed by WEL are distributed over a large geographical area, so at the most basic level WEL needs to know the geographical location of each asset. The GeoIS contains this spatial information as well as asset specifications. The GeoIS also contains data describing the electrical attributes of assets, connectivity, landbase data (which includes property boundaries and owner details), topological maps and aerial photography. Some of this data is integrated with other systems. The GeoIS is the primary tool for assisting field staff to locate assets.
83 The GeoIS aims to leverage existing data and present it in a way that decision makers can easily comprehend. One of the strategic focuses for the GeoIS is to increase the degree to which it leverages existing company data for the benefit of decision makers at all levels. The purchase of aerial photography provides cost savings across the company and is also a means of improving data quality. Other recent data enhancement initiatives include the criticality project, addition of easements, implementation of distributed generation, street light controllers and aerial bundled cable, recording of vertical heights as well as communication features. The criticality project leverages the GeoIS data to optimise asset replacement decisions. The addition of easements is particularly important for managing the associated legal risks and responsibilities. The upgrade from a relational model to a full spatial model has enabled improved efficiencies in compliance reporting. ENTERPRISE RESOURCE PLANNING (ERP) SYSTEM SAP, an ERP system, supports finance, asset management, maintenance, capital works and procurement. In addition a third party scheduling package was purchased for works delivery. The system is based on work orders, which capture all costs associated with a particular piece of work. Information derived from this data provides a measure of productivity and efficiency of the field staff, which in turn aids cost control. At the close of capital jobs the costs are added to the Financial Asset Register, so WEL always knows the value of its asset base. The plant maintenance module in SAP supports the management of all maintenance and capital work undertaken on the network through the work orders application, as well as the inventory management and purchasing applications. The maintenance module enables engineers to create planned maintenance work schedules and capture important information when faults occur. Continuous improvements in the functionality include: Improved reporting through the application of Business Intelligence; and Implementation and enhancement of mobility solutions. NMS The NMS is described in section and the associated load control equipment is discussed in section VEGETATION MANAGEMENT DATABASE This application was commissioned by WEL in order to better manage the tracking of vegetation removal. It has a graphical interface which is derived from a landbase and GeoIS extract. All vegetation is recorded in the system and registered against a span or sub span of the line. Information includes the priority, owner, species, previous work, previous notifications and other notes as required. Job cards are created from the system and direct field work. Periodic field patrols are done to update information into the system. The interface allows tree issues to be visually observed in a spatial mapping environment. The system is a key element in allowing WEL to comply with the vegetation regulations. SMART METER The Silver Spring Network (SSN) head end hosts a suite of applications that support the Smart Box implementation. The head end itself is hosted in the United States and the contractual agreement is a Software as a Service agreement. The application is accessed in the WEL office via a web interface. Data traffic from devices and other application traffic flows from the WEL office to the head end via an Internet VPN. ADVANCED METER MANAGEMENT The Advanced Meter Management module within the SSN head end is the main application used for managing devices (meters, relays, access points) and for setting up schedules, reports and exports. The number of devices in various life cycle states can be monitored along with events and alarms from devices. On demand interrogation and control of devices at selectable frequencies can be performed using web services. Smart Box meter readings and events are obtained at scheduled intervals. 83
84 METER DATA MANAGEMENT We recognise that the information derived is only as good as the source data it depends upon. Therefore we are progressively developing our systems and processes to aid the capture and retention of good quality data. Meter data management systems and associated reporting tools are being developed in house, leading to improved asset management decisions, setting of priorities and so far have resulted in asset management savings of $10-15M over the next 10 years. The development is an on-going and iterative process due to the lack of either published information or commercially available tools OTHER OPERATIONAL ASSETS We have a number of miscellaneous assets including safety equipment, test equipment and vehicles. The safety and test equipment is replaced as needed. Approximately a third of WEL s vehicle fleet is leased. Financial analysis undertaken by WEL revealed that there was a significant financial and operational advantage if WEL owned its own vehicles. As vehicle leases expire WEL is purchasing replacements ASSETS OWNED BY WEL AT GXPS The WEL owned assets located at GXPs are covered in the above sections. However, for clarity they are summarised below. They generally include switchgear, metering and load control equipment. HAMILTON GXP Hamilton GXP has the following assets. Communications equipment Ripple Plant (load control equipment) Metering equipment RTUs Protection relays TE KOWHAI GXP Te Kowhai GXP has the following assets. Communications equipment Ripple Plant (load control equipment) Metering equipment RTUs Protection relays HUNTLY GXP Huntly GXP has the following assets. Communications equipment Metering equipment RTUs Protection relays 33kV Switchgear 84
85 4. APPROACH TO ASSET MANAGEMENT
86 4. APPROACH TO ASSET MANAGEMENT This chapter describes our approach to asset management. Asset management is the core of what we do and as such our approach is fundamental to achieving the service level outcomes sought by our customers and stakeholders. Within this context this chapter covers the following: Stakeholder Requirements (4.1) describes the performance requirements expected from each of our stakeholders. These form the basis for the level of investment and expenditure required to meet these expectations; Asset Management Framework (4.2) describes the strategic approach and framework we utilise in managing and developing our assets over the AMP period; Asset Life Cycle (4.3) explains our long-term whole of life approach to asset management; Risk Management Framework (4.4) describes our risk management approach, specifically in relation to network assets; and Asset Management Performance Assessment (4.5) describes our asset management performance and improvement initiatives. This section discusses our assessment using the Asset Management Maturity Assessment Tool (AMMAT) prescribed by the Commence Commission. 4.1 STAKEHOLDER REQUIREMENTS Chapter 2 identified our stakeholders. In this section we describe our understanding of our stakeholders and our environmental management requirements. The remainder of this section is structured to describe the requirements of: Our customers Retailers Community Environment management Regulators Transpower (including in their role as SO) Service providers Staff Board of Directors. Their requirements and expectations are described below. Stakeholder requirements are incorporated into our asset management practices through the metrics we use to measure our performance and in our network design and security standards. The metrics used to measure our performance against these requirements is described in Chapter 6 and our design and security standards are discussed in Chapter 7. CUSTOMER REQUIREMENTS Our customers were last surveyed in June The survey informs us of customers views about the price and quality of service that we provide. Table 4.1 below compares our actual performance to our customers expectations of average power outages per customer, measured in minutes (SAIDI). It also includes a measure of the industry average for each sector. This was determined by averaging the SAIDI recorded against electrical distribution companies that are either largely urban or largely rural. This was a weighted average therefore it takes into account the number of customers in each company. 86
87 The companies used for the urban benchmark were: Electricity Invercargill Nelson Electricity Wellington Electricity WEL Urban. The companies used for the rural benchmark were: Alpine Energy Electricity Ashburton Eastland Network Horizon Energy MainPower NZ Marlborough Lines Northpower The Lines Company Top Energy Network Waitaki Westpower WEL Rural. CUSTOMER GROUP ACTUAL PERFORMANCE 2015 (MINUTES) INDUSTRY WEIGHTED AVERAGE 2015 (MINUTES) CUSTOMER EXPECTATIONS FEBRUARY 2014 (MINUTES) CUSTOMER EXPECTATIONS JUNE 2015 (MINUTES) Urban Rural All Customers Table 4.1 Customer Outage Expectations Of particular significance is that the survey results indicate that our rural customers expectation of performance improvement, through the reduction of the duration and number of outages, is a 28% reduction in outage minutes. Our current performance comfortably exceeds urban customers expectations but falls well below that of rural customers. A comparison of our current urban and rural performance and recent trends in these are provided in more detail in Chapter 6. The survey also indicated that our customers expect us to maintain our current cost structure. Of the rural customers surveyed 94% indicated that they would not want an increase in reliability if it would require additional cost to the customer. There is a large focus in this AMP on improving rural performance and we are targeting a significant improvement in this area; however our expectation is that, even after challenging ourselves to improve, innovate and with reallocation our available resources, the rural network performance may still fall short of our customers expectations of performance improvement during the AMP period. Our rural performance improvement initiatives will largely come from the renewal of aging assets in these areas and is discussed in Chapter 8. Our large customers communicate directly with us about their expectations and requirements. Our commercial and customer project teams are set up to interact with them on a day-to-day basis. 87
88 COMMUNITY Public safety and community prosperity (economic and social) are primary concerns for our community. Our assets form part of the landscape in which our communities live and work. Accordingly public safety is a key concern and consideration in our asset management planning, equipment design and network operations. These requirements are reflected in our safety objectives and performance measures and implementation of a Public Safety Management System. WEL contributes to the community s prosperity on many levels but primarily through the safe and efficient delivery of our services. ENVIRONMENTAL MANAGEMENT Our environmental and sustainability policy aims to reduce our impact on the environment. We have identified that in order to reduce our environmental impact we must ensure all staff and contractors are aware of their responsibilities and are actively engaged and committed to improving our environmental performance. As part of giving effect to the policy we have developed an Environmental Management System as a basis for managing our activities in the field. Our field staff are trained in how to identify potential environmental impacts and discuss any environmental considerations prior to commencing work. TRANSPOWER (INCLUDING IN THEIR ROLE AS SO) Transpower is one of our largest suppliers of services and we are co-dependant on each other for the effective delivery of electricity to meet our customer expectations. Transpower requires that we keep them informed of our plans and events with the potential to affect them. In their role as SO they require that we maintain instantaneous communications and are able to respond to their instructions. They, in turn, must take into account our requirements. We maintain communications through our regular planning discussions and through our Network Operation Control Centre. All Code requirements are met by our established procedures and practices, and monitored through our risk and compliance framework. REGULATORS REQUIREMENTS We are subject to regulation under various Acts including the Commerce Act administered by the Commerce Commission and the Electricity Industry Act administered by the Electricity Authority. Our compliance with regulation is a key requirement of theirs and is a key focus for us. The publication of an AMP is an example of a regulatory requirement we meet. In general, our regulators require our compliance, constructive input and collaboration to assist them in fulfilling their duties. SERVICE PROVIDERS We rely on service provides to carry out a number of functions. These include providing critical components of equipment and services. The requirements of service providers vary depending on the nature of the services they are required to deliver. However to be effective they require appropriate payment for services and good working relationships. Accordingly we put significant effort into ensuring sustainable working relationships are fostered with all service providers. STAFF Our staff are critical to our business. They enable us to deliver on customer and stakeholder expectations. As such, staff safety and wellbeing are critical to our success. BOARD OF DIRECTORS The Board of Directors is responsible for the delivery of outcomes sought by our stakeholders including the Trust. Their requirements are therefore related to the purpose of growing the investment for our community. 88
89 4.1.1 BALANCING STAKEHOLDER REQUIREMENTS With a wide range of stakeholders, striking the appropriate balance between their requirements is necessary where the outcomes sought are mutually exclusive. In a majority of cases our stakeholder requirements align and can therefore be met without conflicting outcomes. However, when they don t align we always prioritise safety requirements ahead of all other needs, followed by other legal and regulatory requirements. Any remaining unserved stakeholder requirements are prioritised on a case by case basis depending on the particular circumstances. 4.2 ASSET MANAGEMENT FRAMEWORK Effective asset management is critical to achieving our objectives. We have developed an asset management framework that links our corporate objectives and day-to-day activities. It comprises the following: Asset Management Policy: aligns our asset management approach with our corporate objectives (Vision, Values and Strategic Plan). Our asset management objectives reflect these objectives by focusing on risk management and the skills and competencies of our workforce. Asset Management Strategy: translates the Asset Management Policy into drivers and high level objectives. The strategies employed currently sit within our network development, renewal and maintenance and non-network development plans. AMP: (this document) reflects our asset lifecycle model, aligns our high level objectives to relevant processes and activities, and details our 10 year investment plans. Work Plans: apply our strategies to individual assets and set out intervention plans. Our work plans consider each element of the asset lifecycle. Together these components align with the performance objectives established for the urban and rural network. The asset management framework is depicted below. 89
90 PURPOSE, VISION AND VALUES STRATEGIC PLAN Corporate objectives, initiatives and targets LINE OF SIGHT ASSET MANAGEMENT POLICY Establishes AM objectives and accountabilities ASSET MANAGEMENT STRATEGIES STAKEHOLDER EXPECTATIONS Network Development Non-Network Investment Renewal and Maintenance OUR AMP WORKS PLAN Delivery of asset lifestyle activities CONTINUOUS IMPROVEMENT PURPOSE, ENABLERS VISION AND VALUES Health and safety Information systems Capability Corporate Figure 4.2 Asset management framework ASSET MANAGEMENT POLICY The Asset Management Policy is established within the corporate governance arrangements. The General Manager Asset Management has overall responsibility for asset management with the primary objective of delivering a safe and reliable network over the long-term that meets the customers quality and price requirements ASSET MANAGEMENT STRATEGY Asset Management Strategy links our policy objectives to the network development projects and asset renewal and maintenance plans we have described in Chapters 7 and 8. The strategy adopted considers three distinct components, network development; non-network investments and maintenance and renewals. 90
91 NETWORK DEVELOPMENT In line with customer expectations our strategic objective for network development is to maintain our urban reliability level while improving the performance of the rural network. This involves consideration of network security over the AMP period against the established security criteria. We will need to maintain capacity required to supply localised areas of growth within the urban network. To achieve our customers requirements in a cost effective manner, we will seek projects with high cost benefit ratios such as network automation and non-network alternatives such as demand management. The initiatives and projects that result from this strategic approach are discussed further in Chapter 7. NON-NETWORK INVESTMENTS We invest in non-network assets to increase operational flexibility and to improve the information that supports our asset management decision making. We are now utilising the information and flexibility this provides to improve services to customers and to ensure efficient investment decisions are made. MAINTENANCE AND RENEWALS Our strategic approach to maintenance and asset renewal is to maintain a consistent and sustainable level of risk over the long-term. The principal methodology employed for this is CBRM. This strategic approach and the resultant renewal and maintenance expenditure over the AMP period is discussed further in Chapter 8. DOCUMENT CONTROL AND REVIEW WEL uses promapp for the control and review of its asset management process. Promapp is process management software that allows us to clearly define our process and set review periods. Each process describes the actions that are required and links to all controlled documents. Each process is assigned an owner and it is the owner s responsibility to ensure that a review of the process and supporting documentation is undertaken within the interval set. We also undertake internal and external audits (including certification to ISO9001) of our asset management strategies and policy which ensures their alignment and accuracy WORKS PLAN The integration of outcomes across the three strategic components are implemented through our works planning process. Work planning is integral to meeting the needs of our stakeholders. The focus of works planning is safety and efficiently delivering both planned and unplanned works. It also includes operational services required to meet customer requirements. It involves three key steps: Integration and optimisation of network development, renewal, and maintenance works. Works and resource scheduling and programme management. Management of delivery through WEL Services and external contractors. The governance arrangements for works planning are discussed further in Chapter 5, and the associated performance metrics and targets are described in Chapter 6. ASSET LIFECYCLE Management of our assets is based on taking a whole of life approach to asset management. This involves considering five aspects of the asset lifecycle, as depicted in Figure The approach to each of the five asset lifecycle components is strongly linked to the overall strategic approach described in above. These are: Figure The asset life cycle 91
92 Plan identifying specific network requirements that will deliver on stakeholder expectations for service and price, investigating options and authorisation of expenditures. Our planning processes are discussed in Chapter 5 and our expenditure plans are discussed in Chapters 7 and 8. Deliver implementation of the planning process through works delivery. This is discussed in Chapter 5. Operate operate the network and assets in such a way as to deliver the service levels sought by customers. Network operations and field delivery is discussed in Chapter 5. Maintain efficiently maintain the equipment and network through defect identification and planned maintenance activities. The treatment of each asset class is identified in strategic asset management decisions. Our approach to maintenance is set out in Chapter 8. Dispose efficient, safe and environmentally appropriate disposal of assets. Any specific requirements for disposal of an asset are discussed in Chapter RISK MANAGEMENT FRAMEWORK This section describes our approach to risk management. Risk management is a fundemental asset management discipline that supports the management of our assets. It requires that robust processes are in place for assessing and managing asset-related risk. It is key to fulfilling our ultimate aim of keeping people safe RISK MANAGEMENT POLICY Our Risk Management Policy identifies risk management as a key requirement when managing day-today operations and longer-term network planning. It ensures that risk management is an integral part of our management and operating processes. It seeks to improve decision making, so that the business can maximise improvement opportunities while managing risk. We have developed and maintain a risk aware culture, where staff are empowered and enabled to identify relevant risks. We have in place processes to evaluate, prioritise and mitigate these identified risks. Other than safety related decisions, we seek to balance the costs of mitigation with the residual risk. RISK ACCOUNTABILITIES Ultimate responsibility for risk management resides with the Board of Directors. The Board of Directors have delegated management of this responsibility to the Audit and Risk sub-committee. The subcommittee meets every six months to review risk and audit and assurance activity. The full Board is updated on a monthly basis by the Chief Executive as part of the regular management reporting functions. We have established an internal Risk and Audit Management Committee (RAMC) comprising a cross business representation of managers including the Chief Executive, all General Managers, the Business Assurance Manager, the Risk and Quality Auditor, and senior operational, corporate and health and safety managers. The RAMC provides management oversight of our risk management and audit processes. This includes reviewing all new risks entered in the risk database to validate the data, determine the classification of the risks and approve the treatments. This committee meets on a quarterly basis. Specific actions are then delegated to the relevant managers. Each staff member is responsible for ensuring they understand the risk management process and how it applies to them. This includes being actively engaged in the identification of new risks and ensuring these are appropriately escalated. 92
93 4.3.2 RISK MANAGEMENT FRAMEWORK Our Risk Management Framework is aligned to the ISO standard. It consists of five process steps for systematically managing risk, as illustrated in Figure below. Establish the Context RISK ASSESSMENT Risk Identification COMMUNICATION AND CONSULTATION Risk Analysis MONITORING AND REVIEW Risk Evaluation Risk Treatment Figure Risk Management Framework The following describes our approach to each process step in the framework. ESTABLISH THE CONTEXT The risk context is established from many factors including; accessibility by the public, location e.g. rural or urban, asset age and condition, inspection programmes and data quality. RISK IDENTIFICATION Our asset management risks are identified via the hazard identification process, regular risk meetings, audit results or event analysis. Any new risk will then be assessed and ratified by the RAMC. Managers from our Asset Management team meet on a monthly basis to review a selection of risks. This provides a formal mechanism for risk assessment, risk monitoring and the identification of new or emerging risks. RISK ANALYSIS When a potential new risk is raised a process of analysis is completed to understand the nature and extent of the risk. This includes discussion with relevant staff. RISK EVALUATION Each risk is evaluated against established criteria to determine the degree of acceptability. The criteria are discussed in Section RISK TREATMENTS Options to mitigate risks are identified. The costs (both initial and on-going) of the proposed treatment options are estimated. The treated risk is then evaluated against the inherent risk. The gap indicates the effectiveness of the treatment option. 93
94 Once agreed treatment actions are included in business plans and budgets where necessary, priorities are set and timeframes for actions are agreed with the risk owner and relevant managers. MONITORING AND REVIEW An active programme of risk monitoring and review is in place. Our internal audit programme also assesses key risks and the effectiveness of controls. The results of these audits are reported to the RAMC with improvement opportunities discussed and additional actions approved. The internal audit programme utilises both our internal auditors and independent third party auditors to conduct a range of internal audits to verify performance. RISK MANAGEMENT DATABASE To support our risk management framework, we use the Quantate Risk Management application. This software based process supports ISO It helps to ensure we have a structured approach to the risk management processes, and has assisted with the efficient administration of risk management reporting RISK CLASSIFICATION Figure below illustrates our risk management classifications. Risk classification bands (indicated by different colours) have been set to reflect our tolerance for risk. These settings were determined by establishing the potential impact and degree of acceptability. 100 RISK CLASSIFICATION Likelihood 10 Class 4 Class 3 Class 2 Class Figure Risk Classification Consequence There are two aspects to the classification of risk: likelihood and consequence. Likelihood (y axis) is determined from: Historical data from our company and other similar companies Empirical data externally sourced data e.g. equipment manufacturer information Consequences (x axis) are considered and rolled up into three broad categories of: Health and safety the risk of a health and safety impact e.g. is there a risk of single or multiple fatalities, serious harm or minor injury. Financial impact includes the service, environment and reliability factors estimated as cost impacts from $0 to > $100,000,
95 Reputation this looks at the impacts on various groups of internal and external stakeholders including our customer and community and is categorised in five bands from 1 (very serious impact) to 5 (very minor impact). Each combination of consequence and likelihood has been given a value according to the potential impact on the business. The classification of risks, shown by the colour bands in Figure above, and description are: Class 4 (Extreme) risks are considered intolerable. Risk reduction actions must be applied to reduce the likelihood or consequences of the risk. Class 3 (High) risks are unacceptable without further controls unless the cost of such controls outweighs the benefits. Class 2 (Medium) risks are tolerable but undesirable. Higher consequences (those further over to the right hand side of the chart) are less desirable. Low cost mitigation may be justified unless the cost of such controls outweighs the benefits. Class 1 (Low) risks are acceptable IDENTIFIED TOP 10 RISKS We have identified the following asset risks as being the top 10 inherent. RISK INHERENT RESIDUAL KEY MITIGATIONS CLASSIFICATION CLASSIFICATION Sub-optimal investment in assets Extreme Extreme Strategic Asset Management due to changing patterns in Approach consumer energy efficiency Project Prioritisation Tool practices and the impacts of emerging technologies Asset class failure prior to Extreme Extreme Asset Management scheduled replacement e.g. Condition-based Assessment 16mm copper conductor failure Major storm or natural disaster Extreme High Contingency Planning Network Design Staff or contractors injured Extreme Medium Training while working on the network Processes Harm to member of the public Extreme Medium Asset Management through equipment failure Maintenance Harm to member of the public Extreme Medium Asset Security through deliberate contact Maintenance with the network Harm to staff or member of the Extreme Medium Training public through defective work Processes and Standards Harm to staff or member of the Extreme Medium Maintenance public through theft of earthing Work with NZ Police Harm through failure of Extreme Medium Test and Inspection safety equipment Purchasing Standards Harm and or reliability impact Extreme Medium Commissioning Process from critical network systems As-built Process e.g. NMS not being accurate Table Top 10 Inherent Risks 95
96 4.3.5 MANAGING ASSET-RELATED SAFETY RISK Safety management is a critical component of the overall risk management framework and, due to the inherent nature of our electricity network, many network risks have a significant safety consequence weighting. Minimising both the likelihood of safety events occurring, and the ability to minimise the consequences when events do occur are therefore of paramount importance to us. Our Public Safety Management System reflects our approach to managing asset based safety risk. The key principle in managing asset and infrastructure risk is to reduce the residual risk to being as low as reasonably practical. ASSET FAILURE RISK MANAGEMENT Safety risk due to asset failure is a key concern for WEL. The Asset Management team is responsible for managing risk associated with our assets, the delivery of our works programs and the operation of the assets. WEL services and our contractors also have a responsible for managing any operational or delivery risks. WEL has employed the technique of exposure rate analysis to assess the likelihood (frequency) of asset failure and related impacts. Risk assessments have been conducted for the various classes of network asset. This approach is inherently built into our CBRM asset management tool, discussed further in Chapter RESILIENCE AND HIGH IMPACT LOW PROBABILITY EVENTS Even though natural disasters and emergency situations are unlikely, they would have a significant impact on our assets and operations. Reflecting this, our planning in this area is extensive and includes the following aspects. While the network is not designed to withstand significant natural events, we actively identify areas and sections of the network that may be subject to HILP events and have response plans in place. LIFELINE UTILITY As a critical infrastructure provider in New Zealand, WEL is a Lifelines Utility and has a significant Civil Defence Emergency Management (CDEM) role to play. Section 60 of the CDEM Act 2002 requires WEL to: function at the fullest possible extent during and after an emergency have plant for such functioning participate in CDEM planning at national and regional levels provide technical advice on CDEM issues where required. We are a participating member of Waikato Lifelines Utility Group (WLUG) which has overall goals to: assist members to meet their obligations under the CDEM Act coordinate and work to progress the completion of projects which benefit lifeline organisations in their regionstrive to ensure that member organisations get value for money through their participationendeavour to meet ever increasing customer expectations that Lifeline Utilities will deliver secure services. Lifeline utilities are responsible for strengthening relationships within and across sectors, and individually committing to actions that ensure continuity of operation and delivery of service. Through our membership in WLUG, we have access to regional and national studies carried out on natural, technological and biological hazards. From these we have identified the top hazards and developed a comprehensive vulnerability assessment which identifies the risks in terms of importance, vulnerability, resilience, and impact of each major asset on the network. 96
97 MAJOR EVENT PROCEDURES A major event procedure has been established and is applied when events e.g. weather, flood or earthquake have a major impact on our ability to supply electricity, or when a Civil Defence Emergency is declared. It is designed to prepare resource levels beyond those normally available or on call. The procedure requires the following actions to be taken. Prepare for impending weather that has been forecast. Teams are required to make preparations and resources are put on notice. Manage increased or increasing numbers of faults due to weather conditions. Resources are increased accordingly. Liaise with Civil Defence in the event of a Civil Defence Emergency being declared. Respond to Civil Defence requirements to prioritise the restoration of supply to critical sites. We also have a communications process for major events which covers external communications during an event. CONTINGENCY PLANNING We have developed contingency plans for loss of significant assets or groups of assets. Further development of specific plans for zone substations and critical 33kV circuits is ongoing. Our contingency plans include switching processes to ensure essential services, as much as is practicable, are able to continue to receive power supply in the event of a major outage. We have also entered into arrangements to gain priority access to emergency generation should the need arise. EMERGENCY EXERCISES We undertake annual emergency response exercises. These alternate between desktop and full scale emergency scenario simulations. Typically these have involved full scale alarms being initiated without prior warning. A range of scenarios have been staged including major rolling storms, significant failure of the communications network (affecting SCADA) and failure of a Transpower point of supply. Most recently we simulated a significant earthquake event, putting into practice some of the learnings from the Canterbury earthquakes. Following every exercise we discuss any potential improvements to be made and record lessons learnt. DISASTER RECOVERY SITE We operate our control centre under normal circumstances from our Maui Street premises. When this is not available for any reason, our Disaster Recovery site provides a full back-up of the Network Management, SCADA and major corporate systems. The Disaster Recovery site allows full monitoring and control of the network to continue. 4.4 ASSESSMENT OF ASSET MANAGEMENT PERFORMANCE In this section we describe the assessment tool we and all other electricity distributors are required to use to assess our respective asset management capability AMMAT AMMAT is a prescribed set of questions identified by the Commerce Commission for the self-assessment of electricity distributors asset management performance and maturity. The Commerce Commission developed the tool to help all electricity distribution businesses and stakeholders to assess and understand their performance and to encourage continuous improvement. 97
98 The tool uses a selection of 31 questions, which are grouped into six key areas. The questions relate to the key components of the internationally recognised ISO framework for asset management. In addition the Electricity Engineer s Association has developed guidelines to assist in the assessments process. We made this resource available to all key personal invited to participate in the 2016 assessment THE PURPOSE OF AMMAT The purpose of the assessment is to gauge our performance against the selected components of the ISO framework. The self-assessment informs us and stakeholders about the level of competency we believe we have reached at the time of assessment. While we have no immediate aspirations to seek ISO certification, we do agree at this stage that there is benefit to be obtained from performing the assessment. The benefit comes from our internal discussions and views around the level of asset management capability and competency appropriate for our stakeholders, and the identification of improvement opportunities IMPROVEMENTS IMPLEMENTED DURING 2015 Since the survey in 2014 we have implemented a number of improvement initiatives. We reviewed our delivery model to ensure the right commercial decisions are made with regard to the insourcing and outsourcing of maintenance and capital work. The project followed a robust methodology which included learning from other organisations as well as thorough financial and nonfinancial analysis and evaluation. CBRM tools have been implemented across a number of fleets and the results are starting to be used to inform our planning and decision making. Safety Improvements - Safety by design concepts have been formally incorporated into our design processes. - Improvements have been made to the identification of safety hazards, their documentation and handover to external contractors. Contract Management we have revised our tender documents under NZS3915:2005 to improve their consistency and to better manage commercial risks. Resource Management we have employed a dedicated Works Programme Manager and have improved the visibility of resource scheduling in our works plan. More work in this key area has been identified for AMMAT ASSESSMENT Our 2016 assessment is summarised below. We have undertaken detailed analysis of the responses to gain a deeper understanding of our latest performance assessment. Overall we believe our performance and maturity in asset management is good. We aspire to be better and we believe our revised AMP is a significant step in the right direction. The results shown indicate an improvement in the scores over our last assessment undertaken in This indicates that the initiatives we are undertaking to improve our delivery of work is starting to take effect and we are obtaining a better alignment to the ISO 55000:2014 standards. 98
99 ASSET MANAGEMENT MATURITY ASSESSMENT 2016 Average 2015 Average Asset strategy and delivery 4.0 Competency and training Documentation, controls and review Structure, capability and authority Systems, integration and information management Communication and participation Figure AMP AMMAT Summary Results The conclusion drawn from the result is that we are maturing as asset managers and our works delivery improvements are resulting in improved performance IMPROVEMENT AREAS AND INITIATIVES Of particular note is that the two lowest areas of assessment in 2015 are Communication and Participation, and Competency and Training. Activities we undertook to improve in these areas included improving the communication of our plans. There was a greater involvement across the company in the development of last year s AMP and the communication of the AMP was also greatly improved. As part of the works delivery project there has also been an improvement in the clarity that each role within the company has in the delivery of our asset management plans, and the competencies required. 99

100 5. ASSET MANAGEMENT GOVERNANCE
101 5. ASSET MANAGEMENT GOVERNANCE This chapter sets out WEL s asset management governance framework, in which established processes support investment planning decisions with clear accountability and expenditure approvals. The later sections of the chapter describe our approach to works delivery. The chapter is structured as follows: Investment Planning (5.1) explains our methodology applied to investment planning including an explanation of our four stage approach to investment decisions and implementation. The four stages are: need identification, options analysis, project definition and cost estimation, and establishment of a works plan. All stages are undertaken under overarching governance, prioritisation and approval controls. Expenditure Approvals (5.2) provides a description of our governance arrangements including the delegated financial authority framework, and our challenge and prioritisation processes. This section concludes by summarising the decision support tools underpinning our expenditure approval process. Works Plan (5.3) describes how we integrate and optimise our works delivery, the associated delivery model, and how the resources for this are determined. It also describes our approach to materials management and works management. 5.1 INVESTMENT PLANNING Investment planning is fundamental to many of our activities. Our planning capability is also central to efficiently delivering on customer price and quality requirements. Our process is fundamentally the same for all investments, from needs identification through to delivery. These stages are managed under an overarching governance, prioritisation and approvals framework as illustrated below. These stages are: Needs identification Options analysis Project definition and cost estimation (Project Definition Document (PDD)) Works Plan. GOVERNANCE: PRIORITISATION; APPROVALS Needs Identification Figure 5.1 Investment Planning Model Options analysis Project Definition and Cost Estimation (PDD) Works Plan The first three planning related stages are described below. The processes employed for investment approvals and works delivery are described in sections 5.2 and 5.3. Details of the proposed projects and associated expenditure can be found in Chapters 7 and
102 5.1.1 NEED IDENTIFICATION Investments are made in response to a number of needs. Over the AMP period our network expenditure will be primarily driven by: Safety Reliability performance Asset condition and health Growth and security Customer requests Technology change Legal, regulatory and environmental requirements. In many instances an investment, or a series of investments, will meet more than one of the above drivers. As such it is imperative to have a very clear definition of the need being met in order to ensure that the most prudent solutions are being proposed. The investment drivers are discussed below. SAFETY Investment to address safety concerns and safety related asset issues is a high priority for us. The majority of safety related risks can be addressed in the design and selection of equipment on the network, through our safety in design process. In addition, there will be specific safety drivers within our expenditure on reliability, asset condition and health, and growth and security. There are instances where specific safety related investments emerge from risk review meetings and are assessed on their individual merits. RELIABILITY PERFORMANCE As assets age and or demand grows, the reliability performance of sections of the network can degrade. In addition, previously unidentified reliability issues become apparent. In these instances investment to maintain reliability performance is required. Typically this will result in additional network automation, further sectionalising of circuits, or the addition of new feeders. These issues are identified as part of our network planning process. It is the responsibility of the Asset Planning and Engineering team to propose and manage these performance issues. ASSET CONDITION AND HEALTH Expenditure on asset maintenance and renewals is primarily driven by the need to maintain asset condition and health. We have a comprehensive and continuous programme to identify asset condition and health, which informs maintenance requirements. Field inspections are carried out by line crews and a dedicated team of inspectors. The renewal and maintenance requirements are then fed into the renewal planning and maintenance process. The overall responsibility for asset health and condition related investment sits with the Maintenance Strategy team. A more detailed explanation of our asset condition and health assessments and how we manage identified issues is set out in Chapter 8. GROWTH AND SECURITY As peak demand grows new capacity from additional investment is generally required to reconfigure the network. The process starts with an assessment of expected future demand on the network and identifying where current network capacity is insufficient to meet expected demand and security requirements. The required level of security at each level in the network has been established as part of our network design security criteria. Assessing the need for growth and security investment is the responsibility of the Asset Planning and Engineering team. 102
103 CUSTOMER REQUESTS Individual customers often seek new connections or an upgrade to their existing connection. Network changes are also frequently requested due to road layout changes e.g. widening or safety improvements, or new roads being built e.g. the Waikato Expressway. Customers have the choice of initiating contact with us through a number of channels. They can initiate the change request with their retailer, call WEL s contact centre and customers familiar with the connections process can make direct contact through their relationship manager or our Customer Projects team. Regardless of the channel used, our Customer Projects team will process the request in a timely manner and keep the customer informed of the status of the request. The Customer Project team is part of the wider asset management team and will assess the works required, advise any costs to be paid by the customer and initiate the works required to fulfil the customer request. Any capital contribution required from the customer is calculated in accordance with our Capital Contribution Policy. The main purpose of the Capital Contribution Policy is to further ensure the best option selected is financially viable. A copy of the policy can be found on our website TECHNOLOGY CHANGE Technology obsolescence and technology change can also drive the need for investment expenditure. This is particularly true where critical operational equipment is required for continued electricity supply. This includes network management software and communications, network monitoring, and corporate support technologies. Responsibility for proposing technology investment lies with individual business units. For example, the Information Technology (IT) team is accountable for all corporate systems, hardware and software investments, while the Asset Planning and Engineering team is accountable for SCADA and network automation investments. LEGAL, REGULATORY AND ENVIRONMENTAL Our formal compliance policy requires that we endeavour to comply with all relevant legal, regulatory, and environmental obligations. Where we find we are non-compliant we will take all reasonable steps to work towards compliance. It is therefore a key consideration in our needs identification that we are either maintaining compliance or are taking all reasonable steps to achieve compliance through the AMP period OPTIONS ANALYSIS Following need identification, potential solutions are identified and considered. The number and type of options (or solutions) varies depending on the type, value and complexity of the investment. Our options analysis is also tailored based on whether the capital expenditure is related to renewals or network development. Renewals analysis is informed by our CBRM framework and processes as detailed in Appendix B. Accordingly renewals are based on targeting high risk assets. This process is described further in Chapter 8. For all other investment needs, maintenance and development options are explicitly considered. Typical options considered include; maintenance, network reconfiguration, network automation, capacity upgrades, additional assets, and non-network investments such as demand management. ASSESSMENT PROCESS Our options analysis process involves considering all technically feasible options then ranking these to select the best in terms of safety, whole of life cost and reliability outcomes. In assessing options we take into account metrics such as the affected customers value of lost load (VoLL), SAIDI and other reliability improvements. In some instances where different development timeframes are available, such as staging the construction over several years, we use economic analysis to account for expenditure timing differences and identify the best option. This analysis includes Net Present Value (NPV) assessment. The outcome sought is the least cost option that meets the identified needs. 103
104 DECISION SUPPORT TOOLS We use a number of decision support tools in our assessment process. These include, as appropriate: Safety considerations and operating processes Technical Analysis Risk Analysis Economic Analysis (Cost Benefit, NPV, VoLL/Cost Ratios) Capital Expenditure / Operational Expenditure trade-offs CBRM. These tools help us assess and choose the best option for the maintenance and development of our distribution network and associated systems PROJECT DEFINITION DOCUMENT (PDD) AND COST ESTIMATION The PDD for each capital project is written and approved to provide a high level project scope, cost and resource estimations. Following expenditure approval of the PDD and associated budgets, resource planning for detailed design and project construction is used to produce a high level project delivery timeline. 5.2 EXPENDITURE APPROVALS Expenditure approval is governed by the delegated financial authority structure within WEL. Prior to approval, expenditure plans are subject to an internal challenge process. This section describes the approval model, the challenge process, and the accountabilities at each level in the organisation GOVERNANCE APPROACH Our Board has established a delegated financial authority structure for the business. The structure amongst other criteria sets the expenditure approval level of the Chief Executive, the General Management team and senior managers. DELEGATED FINANCIAL AUTHORITY The expenditure approval limits have been established commensurate with our organisational structure, meaning higher limits are set corresponding to a person s position within the organisation. The expenditure limits are further differentiated between budgeted and unforeseen expenditure. Unforeseen expenditure limits are set significantly lower than budgeted expenditure given that budgeted expenditure has already undergone preliminary approval process incorporated in our strategic, business planning and asset management planning processes. The Chief Executive s budgeted expenditure limit has been set at $2 million excluding any regular payments above this amount e.g. Transpower s monthly charges. The Chief Executive s unforeseen expenditure limit has been set at $500,000. The Board may approve greater amounts. PRIORITISATION WEL has developed a prioritisation tool for evaluating its capital work. The tool applies a systematic process to all projects. The tool is based on a risk evaluation and considers the following criteria: Health and Safety Network Reliability Network Capacity Environmental 104
105 Regulatory requirements Outage planning constraints Life cycle cost Current book value. The tool calculates a cost benefit ratio from these criteria and provides a ranking. This enables projects with differing drivers to be evaluated in a constant, transparent and repeatable manner. DECISION SUPPORT TOOLS For expenditure approvals the key decision support tools are: Delegated financial authority limits Our strategic, business and AMP strategies Economic analysis e.g. results of the options analysis stage Project prioritisation tool PDD documents. 5.3 WORKS PLAN This section describes the process utilised in delivery of planned projects, and responding to unplanned events. The focus of works delivery is driving efficiencies and ensuring timely outcomes INTEGRATION AND OPTIMISATION WEL is a maturing business focused on continuous improvement. We understand that the integration and optimisation of our planning process and work delivery is key to achieving our safety, efficiency and least cost objectives. We have identified a number of potential enhancements to our current practices. The role of the Contracts & Programme Manager was recently established to further enhance the integration and optimisation process. A primary responsibility of the Contracts & Programme Manager is to develop and manage the Works Delivery Plan. The plan accounts for resource requirements, expenditure and high level delivery timelines for planned projects. Work delivered through WEL Services and external contractors is managed through this role and measured against the Works Delivery Plan. The Works Delivery Plan is utilised by WEL Services and external contractors to establish a delivery schedule (by month) to achieve planned delivery in a financial year. We have identified a number of improvement opportunities in the integration and optimisation of works delivery. One significant change during 2015 was the reorganisation of our First Response team for faults. This has reduced the impact that attending a fault can have on scheduled works. The Works Delivery Plan and scheduling are expected to improve in accuracy over the next 12 months as we build on our initial improvement initiatives. We are currently instigating a project to further integrate and extract benefits from our enterprise system (SAP) through the enhanced utilisation of a powerful scheduling module DELIVERY MODEL This section describes our works delivery model. The aim of the works delivery model is to manage the safe and efficient delivery of maintenance, renewals and development works. The delivery process involves the following stages. 105
106 Resource and expenditure forecasting: The Works Delivery Plan is a high level plan based on PDD information for growth and security, renewal and scheduled maintenance activities. For customer driven and reactive maintenance work, historical resource utilisation and expenditure are used for forecasting. Detailed Design: We utilise standard designs and construction techniques as documented in our design and construction manual to drive quality, standardisation and cost efficiency. Asset categories where standardised designs have been developed include subtransmission lines, zone substation equipment and switchgear. All designs incorporate safety in design concepts assisting assets to be safely accessed, operated and maintained. Opportunities to develop standardised designs are typically identified as part of the asset renewal process and development of maintenance strategies. Specialist independent design support is sought to help manage work flows and cover capability gaps. Scheduling Plan: A detailed monthly schedule for the delivery of all work types, monitoring delivery against the plan to improve coordination of resources. Construction Handover: applies to internal resources and external service providers. Capital Projects have a handover meeting between design and the project manager to effectively manage any safety, delivery risks or complexity. Project Closeout: all capital projects and any other project with a budget that exceeds a defined financial threshold, require a close out report to be completed, circulated and a meeting held to capture and discuss lessons learned. RESOURCING The Works Delivery Plan establishes our resourcing requirements. To ensure full utilisation and cost efficiency of our internal staff we do not plan to deliver our full works programme using only internal staff. Instead we selectively outsource works at peak times and contract specialist resource as required. Projects for outsourcing are identified as early as possible to enable the timely procurement of external support. The process of engaging and managing contractor performance is described in the Section Works Management MATERIALS PROCUREMENT This section describes our materials procurement activities. The objective of the materials procurement process is to efficiently acquire the materials specified by the asset management and delivery functions at an optimal cost given the specification, quantity and quality required. The stages of the procurement process are: 106 Requirements identification Supplier pre-qualification Tender or Request for Proposal (RFP) Approval Purchase order raised or Preferred Supplier Agreement established Evaluate and monitor quality. The processes and business rules for procurement activities have been recorded in our process management systems. This has proven to be a highly effective means of procuring items e.g. inventory, equipment and vehicles because the procurement model for these items is centralised. The centralised model works well because the business processes are adhered to, the benefits and results are measurable, responsibilities are clearly defined and are supported by senior management. TENDERING We tender all major equipment requirements, generally over the value of $100,000. The tender process encompasses assessing business requirements, establishing timeframes, selecting suitable suppliers, detailing specifications, tender preparation and evaluation, and finally developing a formal written recommendation.
107 For purchases or categories up to $499,000, a written recommendation approval is sought from the WEL Tenders Committee. Approvals for values over $500,000 are approved by the Board. PREFERRED SUPPLIERS Through the process of category management and the use of RFP, we have established a number of preferred suppliers. The benefits of a preferred supplier arrangement are consistency and certainty of supply, optimal and stable pricing structures which reflect current market conditions, quality assurance and volume rebate options. MONITORING COST PERFORMANCE We use various techniques for monitoring suppliers to ensure required specifications, quality and cost requirements are being achieved. These include market analysis and product cost benchmarking, monitoring raw material and foreign exchange trends and new technology evaluation WORKS MANAGEMENT Our works management function has been centralised into two key teams to provide a holistic approach to the delivery of all work types. Contract & Programme Management within Asset Management completes all resource planning and timelines for the annual programme of works, manages Customer Initiated Work and contract manages all external design and construction requirements. Within WEL Services, the Works Planning Team manages assigned work priorities to determine work flow for design when required, planning and scheduling prior to being dispatched for construction. Priority 1 works (Typically Faults) bypass planning and scheduling directly into the dispatch process as break-in work for a timely response. The works management handover paths are shown in Table WORK SOURCE DETAIL HANDOVER PATH Maintenance Customer Driven Proactive maintenance inclusive of asset replacements Small & large customer works Handover is primarily from Contract & Programme Management (WEL Networks) to the Works Planning Team for all WEL Services delivered work. Work delivery through external contractors is managed via Contract & Programme Management within Asset Management. Capital Projects Faults Complex long-term planned projects Reactive & time limited maintenance` Table Work management handover paths Handover to the Faults Supervisor for dispatch management Revised contract templates have been developed for the engagement of contracted service and now incorporate: Design services templates using Conditions of Contract for Consultancy Services as a base document due to its relative acceptance in New Zealand; and Invitation for Tender template based on the New Zealand Standard Conditions of contract for building and civil engineering construction (NZS:3915). 107

108 6. ASSET MANAGEMENT PERFORMANCE
109 6. ASSET MANAGEMENT PERFORMANCE This chapter describes our performance objectives, initiatives, measures, and targets for the AMP period. The chapter is structured as follows: Overview of Performance Objectives (6.1) provides an overview of our performance objectives, initiatives and measures. Safety (6.2) describes our safety objectives, initiatives, and measures for the AMP period. Customer Experience (6.3)describes our customer experience objectives, initiatives, and measures for the AMP period. Cost Efficiency (6.4) describes our cost efficiency objectives, initiatives, and measures for the AMP period. Asset Performance (6.5) describes our asset performance objectives, initiatives, and measures for the AMP period. Performance Evaluation (6.6) describes our historical performance. 6.1 OVERVIEW OF PERFORMANCE OBJECTIVES We have established performance objectives in four key areas, safety, customer experience, cost efficiency and asset performance. The objectives reflect outcomes sought by our stakeholders as described in Chapter 4. They are also directly linked to our business plan, strategic plan and ultimately support our corporate vision. The areas of focus for our objectives can be summarised as follows. Safety: Safety is our highest priority. Our vision places safety first and foremost, making it the top priority in everything we do. We strive to ensure safe environments for our staff, contractors, and members of the public. Customer Experience: Our customer experience objectives cover both reliability (quality of supply) and the quality of service we deliver through our interactions with customers e.g. the time taken to resolve a complaint. Cost Efficiency: Cost efficiency is driven by making the right investment choices at the right time, and delivering our works programme for the lowest total ownership cost possible while achieving our quality and safety targets. Asset Performance: The performance of our assets directly determines the quality and cost of services provided to our customers. This, in turn, is a direct consequence of the asset management decisions we make on a daily basis. We will improve our asset performance by further developing our asset management capability and decisions. The objectives, initiatives, measures and targets for each performance area are described in more detail below. 109
110 6.2 SAFETY WEL aspires to being Best in Safety. This underlines our commitment to ensuring the health and safety of our staff and the communities we operate in. To help achieve this we have developed a five year Health and Safety Strategy to The key deliverables of the strategy are summarised below SAFETY OBJECTIVES Our safety objectives are comprehensive. They specify safety outcomes and inform aspects of our culture and leadership. They cover how we operate including the equipment we purchase. To achieve them will require continuous improvement and improved communications. The objectives can be summarised as follows: No business outcome is more important than safety. We have committed and sustainable leadership that supports a culture of openness where people speak up and actively participate. Our people are engaged and take personal responsibility. We always design and plan our work in a manner that puts safety first. Our people are competent to identify hazards and control risks. We accept that errors can occur and always learn from them to prevent reoccurrences. Our systems and tools support our continuous improvement SAFETY INITIATIVES To support these objectives, we are undertaking the following six initiatives. 1. Developing strong and sustainable leadership in health and safety. 2. Ensuring competence to identify hazards and manage associated risks. 3. Actively engaging staff in health and safety across the business. 4. Ensuring everyone understands our Health and Safety Strategy, objectives and accountabilities; 5. Raising the standard of continuous improvement in our health and safety performance. 6. Communicating our performance and any health and safety issues. We consider these initiatives will contribute significantly to achieving our vision and safety objectives. PUBLIC SAFETY We have a strong commitment to protecting the public from harm. During this AMP period we will continue to make improvements to eliminate or control asset-related safety risks to members of our community. The public safety initiatives that are in progress or are planned include: Routine earth testing of all of our substation fencing and earth grids has commenced. This practice will help identify any site where corrective actions may be necessary to ensure our fencing assets don t pose an electrocution risk to people or animals; Due to potential theft of copper earth conductor, a new design standard has been introduced using an equivalent current capacity steel wire conductor that has a lower resale value. The initiative is aimed at discouraging theft to reduce the associated safety risk of electrocution or damage to property as a result of unknown missing earth cables on our equipment; and 110
111 Our Public Safety Management System (certified to NZS 7901), has identified our highest risk to the public is electrocution or shocks from damaged service pillars. To help control this our inspection programme for pillars has been modified from a five to a three year cycle. Additionally, a safety warning label and contact telephone number has been placed on every pillar SAFETY MEASURES AND TARGETS Our safety performance measures are: Total Recordable Injury Frequency Rate (TRIFR). We have commenced reporting TRIFR as our primary measure of safety performance. TRIFR is more comprehensive than Lost-Time Injury Frequency Rates (LTIFR) previously used as our key measure. TRIFR measures all injuries within a given period relative to the total number of hours worked in the same period. In order to standardise the measure it is reported against a base period of 200,000 work hours. Staff Behaviours. We have three key measures for staff behaviour related improvements. These are: - A Safety Improvement Implementation Rate. This is the number of safety improvements implemented, divided by the number suggestions made by staff. - Safety Improvement Indicators. This measures the occurrence of a specific set of safety behaviours that staff witness. - Safety Improvement Behaviours. This measures the occurrence of a specific set of safety supporting behaviours by staff themselves. Data for the safety improvement measures will be informed by a staff safety culture survey. This measures the behaviours of staff in relation to health and safety. Public Safety Incidents. This measures the reported incidents involving the public. The targets for our safety measures over the AMP period are based on our judgement of what is achievable. They have been set at levels that if achieved would reflect very high levels of safety performance amongst electricity distribution businesses. The target performance is set out in Table MEASURE TRIFR Staff Behaviours Implementation Rate 20% 25% 25% 30% 30% 30% 30% 30% 30% 30% Indicators 85% 85% 85% 85% 85% 85% 85% 85% 85% 85% Improvement Behaviours 95% 95% 95% 95% 95% 95% 95% 95% 95% 95% Public Safety Incidents Table Safety Targets
112 6.3 CUSTOMER EXPERIENCE WEL aspires to being Best in Service. This epitomises our objective to provide excellent customer service. We also believe that relationships in our community, with businesses, councils and community groups are vital to our future success. Accordingly, customer experience is a high priority performance area that is key to our on-going business CUSTOMER EXPERIENCE OBJECTIVES Customer experience is a measure of how customers feel about the service and the value they receive. For WEL, customer experience includes the level of reliability each customer receives, how we interact with them, the value derived from the package of services we provide and the information we supply on what is happening on our network. Our objectives for providing Best in Service customer experience are: Delivery of electricity at the service level sought by our customers. Customers know who we are and can contact us across multiple mediums. Customer feedback is easy to give and customers know we will act on it. Customers value the services we offer and can rely on us to meet their needs. WEL is considered to be a partner of choice within the community and within the industry CUSTOMER EXPERIENCE INITIATIVES Our customer experience initiatives have been categorised into two keys aspects: network performance and customer service. NETWORK PERFORMANCE INITIATIVES The following network reliability initiatives will be pursued during the AMP period: Renewal of the rural network, targeted at improving its reliability performance. This is described further in Chapter 8. Investment in urban network capacity and security. The investment will address localised areas of forecast growth. This is described further in Chapter 7. Better utilisation of our smart metering data. We will further leverage data from our Smart Boxes in support of our investment decision making processes. Monitoring Technology. We will actively monitor and assess new technology to maximise the opportunities available from emerging technologies like PV and EV. CUSTOMER SERVICE INITIATIVES Our customer service initiatives include: Continuous improvement in our internal processes, so that customer interactions and broader relationship management are centrally supported and co-ordinated. Measure and benchmark delivery times for services and set key targets for improvement. Ensure that customer needs are fully integrated into our asset management decision making processes. This includes proactive stakeholder engagement in the development of the AMP. Develop and implement a customer relationship improvement plan. Ensure that key stakeholders, and their business needs are central to this plan. 112
113 Reinforce our vision and values with our staff, particularly the Best in Service objective by providing additional training. Review our customer feedback process to ensure that the customers concerns and opinions are clearly identified CUSTOMER EXPERIENCE MEASURES AND TARGETS Similar to our initiatives above, our customer experience measures have been categorised into network performance and customer service. NETWORK PERFORMANCE MEASURES Our network performance measures include those prescribed by the Commerce Commission. The measures are: SAIDI (weighted) System Average Interruption Duration Index (weighted). SAIDI (un-weighted) is the most frequently used reliability indicator. It signifies the average interruption duration for an average customer, over the course of a year. It is measured in units of time, usually minutes. For example, a SAIDI of 60 minutes indicates that on average a consumer on the network experienced 60 minutes without power. Our SAIDI targets have been differentiated between urban and rural customers to allow us to focus on rural network performance. In addition, the targets shown below reflect the Commerce Commission s revised approach to weight (adjust) SAIDI outcomes by 50% for planned outages. This means only half of the duration of planned outages are included in the measure. The targets below incorporate 50% of planned outages. SAIFI (weighted) System Average Interruption Frequency Index (weighted). SAIFI measures the number of times on average a customer will have a power interruption per year. For example a SAIFI of two indicates that the average customer on the network has two interruptions in a year. As with SAIDI, our SAIFI targets have been differentiated between urban and rural to allow us to focus on rural network performance and weighted for planning outages. Repeated Interruptions Is a measure of the number of actual interruptions experienced by each customer. Our targets measure the percentage of urban customers that experience two or less outages in each year and the percentage of rural customers that experience four or less outages per year. For example 90% means 90% of our customers in the relevant segment didn t exceed the targeted number of interruptions. Our targets for network performance are based on our historical performance adjusted for the planned improvements in our rural network, primarily from our renewal and maintenance programmes. Table sets out the targets for each measure over the AMP period. 113
114 MEASURE Urban SAIDI (weighted) Rural SAIDI (weighted) Total SAIDI (weighted) Urban SAIFI (weighted) Rural SAIFI (weighted) Total SAIFI (weighted) Urban Repeat Interruptions (target is 2 or less) Rural Repeat Interruptions (target is 4 or less) % 90% 90% 90% 90% 90% 90% 90% 90% 90% 75% 77% 79% 80% 80% 80% 80% 80% 80% 80% Table Network Customer Experience Performance Targets In addition to these measures we are committed to restoring supply as soon as possible following an interruption. Accordingly we undertake to restore power to our urban customers within three hours of an outage and within six hours of an outage to our rural customers. If we do not meet this, our residential and small commercial customers will receive $40 and our large commercial customers will receive $150. The WEL Promise does not apply to faults beyond our control such as storms, lightning, vehicle accidents or third party damage. The maximum times for restoration are detailed below in Table and, apply for the duration of the AMP period. URBAN RURAL Maximum time to restore power 3 hours 6 hours Table Restoration Promise CUSTOMER SERVICE MEASURES Our customer service performance measures are: Customer Satisfaction we regularly survey a sample of customers to gauge their performance expectations, the price they re prepared to pay, and their satisfaction with our service. During the AMP period we are targeting an improvement in customer satisfaction from 85% to 90%. New Connection Quote Time measures the average number of working days it takes us to provide a quote for upgrades and new connections to our network. During the AMP period we are targeting an improvement in our quoting times from 15 to 10 working days. Complaint Response Time the average number of work days to provide a resolution to any complaint we receive. During the AMP period we will seek to maintain our resolution period of ten working days. 114
115 Our targets are based on our historical performance adjusted for steady improvement over the AMP period. Table shows the targets for each measure over the AMP period. MEASURE Customer Satisfaction 85% 86% 86% 87% 87% 88% 88% 89% 90% 90% New Connection Quote Time (workdays) Complaint Response Time (workdays) <10 <10 <10 <10 <10 <10 <10 <10 <10 <10 Table Other Customer Experience Performance Targets COST EFFICIENCY Our overarching cost efficiency objective is to implement our works plan, without compromise to safety, at the least feasible cost to customers. Our cost efficiency objectives are primarily concerned with the efficiency of our works delivery function. Section 6.5 below addresses our asset management capability COST EFFICIENCY OBJECTIVES Our objectives for cost efficiency are: Works delivery is safe, of high quality and on time. Essential core skills and knowledge are developed and retained. The systems we use enable and support efficient delivery. Value for money is achieved through appropriate commercial tension in the delivery model. We continuously measure and monitor our delivery performance (safety, quality, time, and cost) and always seek ways to improve. We understand that errors can occur and always learn to prevent reoccurrences. Collectively our objectives reflect the cost position we wish to achieve and provide the right incentives for capability development and the safe delivery of projects and maintenance services COST EFFICIENCY INITIATIVES To achieve our cost efficiency objectives there are a number of initiatives we are in the process of putting in place. They include: We have undertaken a review to optimise our works delivery model and are in the process of implementing the outcomes. Review our works delivery management policies and procedures and ensure they are aligned. Align systems functionality with our works delivery model. Reset performance indicators and targets for key delivery activities. Enhance our continuous improvement approaches and performance reporting. 115
116 6.4.3 COST EFFICIENCY MEASURES AND TARGETS The measures we have established for cost efficiency are: Cost Per Customer operating costs that are allocated, in accordance with Information Disclosure requirements, to electricity distribution service excluding costs treated as an asset under Generally Accepted Accounting Practice in NZ, depreciation, tax subvention payments, revaluation, interest expenses and pass-through and recoverable costs divided by the number of connections; and Capital Expenditure Performance project delivery performance for capital works (excluding customer initiated) will be measured by comparing the delivered cost of projects with the budget (which has been appropriately challenged). The performance is subject to the following conditions being met: - Full scope of the project delivered. - Safety performance is maintained. - Design and construction standards are met. - Timeframes are met. - As built information and drawings are captured accurately and in a timely manner. The targets are based on achieving the expenditure levels forecast. Table shows the targets for each measure over the AMP period. MEASURE Cost per customer ($) Capital Expenditure performance % ± 5% ± 5% ± 5% ± 5% ± 5% ± 5% ± 5% ± 5% ± 5% ± 5% Table Cost Efficiency Performance Targets ASSET PERFORMANCE Asset performance is a direct consequence of our asset management decisions and processes. Accordingly, our asset performance objectives focus on further developing our asset management capability ASSET PERFORMANCE OBJECTIVES Our asset performance objectives are to ensure: Our asset management investment decisions are optimised and are based on appropriate trade-offs between capital and operational expenditure, risk and reliability. Preventive and corrective maintenance decisions are made using quantitative analytical techniques such as FMEA. These techniques support quantifiable trade-offs between operational expenditure, asset condition and reliability. We fully leverage our Smart Box data to inform the way we plan, build, maintain and operate our network. This includes voltage exception analysis, fault identification and remediation, peak capacity planning and optimised load control. How, when and who we use to deliver our works plan are key inputs in our investment decisions. We have an effective operational metering team and are recognised externally as a leading player in the smart metering environment enabling new revenue streams for the benefit of our community. 116
117 6.5.2 ASSET PERFORMANCE INITIATIVES The initiatives we are undertaking in the next year to achieve our asset performance objectives include: a review of our asset management planning and decision making processes to ensure the right capabilities, processes and decision support tools are identified and then implemented a review of our maintenance approach particularly in the area of using diagnostic tools to enhance maintenance practices an assessment of opportunities to use Smart Box data to improve the way we manage our assets and operate our network; and assessing opportunities to integrate emerging technologies e.g. PV to improve the performance of existing and future network assets ASSET PERFORMANCE MEASURES AND TARGETS In the short term our asset performance measures focus on network utilisation as our capability measures are being developed. These initial asset performance measures are: Load Factor at GXPs measures the efficiency of assets we contract from Transpower at GXPs. Low values indicate the provision of excess capacity and cost while higher values can also cause concern due to not having sufficient capacity available; and Total Transformer Capacity Utilisation maximum coincident demand divided by total transformer capacity. The basis of the targets is maintaining our historical performance. Table shows the targets for each measure over the AMP period. MEASURE Load Factor at GXPs Total Transformer Utilisation >60% >60% >60% >60% >60% >60% >60% >60% >60% >60% >35% >35% >35% >35% >35% >35% >35% >35% >35% >35% Table Asset Performance Targets PERFORMANCE EVALUATION This section describes our historical performance for the measures we have established under each performance area. However, reflecting our recent improvement initiatives, many of the measures are new and have no relevant historical information. Our performance information is recorded within our information systems. For faults the time, location, duration and fault category is recorded. Other performance information is captured and reported regularly in monthly management and Board reporting processes. For those measures with historical data, this section provides context and scale for the targets going forward. The section is structured by performance areas. Safety Customer experience Cost efficiency Asset performance 117
118 6.6.1 SAFETY The table below shows our safety performance against the targets we set for 2015 and Note that the measures established in this AMP differ from those used last year. SAFETY MEASURE 2015 YEAR TO DATE AT NOVEMBER 2015 TARGET ACTUAL VARIANCE % TARGET ACTUAL VARIANCE % TRIFR per 200,000 man hours n/a % Number of near miss and improvement suggestions Site Observations by Supervisors and Managers % (14%) % % Injury related lost days (64%) % Injury severity rate (lost days per 200,000 man hours) Public Safety Incidents (Actual harm) Public Safety Incidents (Potential harm) n/a n/a n/a % Table Safety Performance 2015 and 2016 We remain concerned by the level of public safety incidents involving our network. Our safety objectives and initiatives have been established to continuously improve our performance CUSTOMER EXPERIENCE Traditionally our measures of customer experience have focused primarily on network performance. Accordingly, the majority of the historical performance data we have is associated with the length and frequency of interruptions to customer s power supply. Our 10 year historical performance is shown on a weighted basis, reflecting the Commerce Commission s revised measurement approach. The presentation on a weighted basis makes the historical performance directly comparable to the targets shown in Section as only 50% of outages that were planned are included in the SAIDI and SAIFI outcomes. ANNUAL PERFORMANCE SAIDI (weighted) SAIFI (weighted) Table Network Customer Experience Historical Performance 2006 and 2015 Our network performance over the last two years is presented below in greater detail and also on a weighted basis where indicated. 118
119 NETWORK PERFORMANCE CUSTOMER EXPERIENCE MEASURES Urban SAIDI (weighted) Rural SAIDI (weighted) Total SAIDI (weighted) Urban SAIFI (weighted) Rural SAIFI (weighted) Total SAIFI (weighted) Urban Repeat Interruptions (target is 2 or less) Rural Repeat Interruptions (target is 4 or less) 2015 FORECAST AT DECEMBER 2015 TARGET ACTUAL VARIANCE % TARGET FORECAST VARIANCE % % % % % % % n/a 0.61 n/a % n/a 4.86 n/a % % % 90% 91% 1% 90% 90% 0% 80% 65% -19% 73% 68% -7% Table Network Customer Experience Performance 2015 and 2016 With the exception of urban repeat outages, for the year ended March 2015 we did not meet our network performance targets. The primary reasons for this are shown below, with the percentage contribution to total SAIDI minutes from each category shown in brackets: Adverse weather (30%): - A major storm between the 10th and 12th June 2014 resulted in SAIDI minutes. This storm met the regulatory criteria for a major event as the time lost exceeded the daily limits of minutes by 1.93 minutes on 11th June SAIDI minutes were resulted from the combination of strong winds and vegetative debris thrown onto lines. Defective equipment (28%) mainly from distribution lines. Third party interference (25%) mainly from vehicle accidents and diggers hit cables: SAIDI minutes were caused by vehicle accidents. Although the SAIDI impact from vehicle accidents is significantly higher than expected we expect to come in on or close to target for WORST PERFORMING FEEDERS We monitor the performance of individual lines and cables supplying customers. Reporting on our worst performing feeders helps identify and develop appropriate action plans to improve the poor service received by affected customers and to address broader issues with these feeders. Our 10 worst performing feeders during the period 2011 to 2015 along with the most recent 9 months performance is shown in Table below. 119
120 RANK FEEDERS AREA SUPPLIED WEIGHTED AVERAGE SAIDI 2016 (YTD AS AT 07/12/15) 1 WEACB6 Rotowaro SILCB4 Matangi RAGCB3 Te Uku GORCB1 Taupiri, Orini HORCB6 Horotiu, Ngaruawahia SILCB1 Matangi HAMCB2802 Eureka, Tauwhare WEACB3 Te Ohaki HAMCB2822 Hamilton East FINCB2 Kopuku Table Top 10 Worst Performing Feeders An explanation of the performance for each feeder is summarised below together with ongoing initiatives to improve service. 120
121 FEEDER WEACB6 STRATEGY Performance has been affected by failing insulators and 16mm2 copper conductor. Unplanned outages in the previous years that were due to adverse weather (storm) have affected the performance of this feeder. Improvement strategy is to prioritise this feeder in our renewal programme particularly our re-conductoring projects and add additional automation to minimise impact on outages. SILCB4 / SILCB1 The performance of both feeders has predominantly been impacted by line clashes and, insulator and 16mm2 Copper conductor failures. These are being addressed in our renewal programme and ongoing capital projects. RAGCB3 Tree debris blown onto the lines and lightning strikes have affected the performance of this feeder. Proactive vegetation programme has been undertaken to minimize risks of feeder outages due to tree debris blown onto the lines. GORCB1 Performance has been impacted by sectionaliser failures which are now being progressively replaced. The large drop in performance was also due to storms in 2014 and a number of car vs pole events. HORCB6 HAMCB2802 WEACB3 HAMCB2822 Tree debris blown onto the lines and car vs pole events have affected the performance of this feeder. A number of network switches and RMUs have been installed to minimise outages. Insulator and lightning arrester failures along with other external influences such as car vs pole events and birds strikes have caused this feeder to have poor performance. Proactive replacements of crossarms, insulators, networks switches and sectionalisers have been initiated in recent years. External influences such as car vs pole events and birds strikes have affected the performance of this feeder. Proactive replacements of sectionalisers and HV fuses have been initiated in recent years. External influences such as car vs pole events and birds strikes have caused this feeder to have poor performance. A number of RMU and network switch replacements have been undertaken in recent years to minimise outages. FINCB2 Table Worst Performing Feeder Strategies This feeder has been impacted by vegetation falling onto the lines, failed insulators and 16mm2 Copper conductor. Re-conductoring projects have been initiated in the previous financial year including automation projects which will improve the performance of the this feeder in the future. CUSTOMER SERVICE The single customer service related measure we have historical data is for customer satisfaction. The results of our performance against our target are shown in Table below. CUSTOMER EXPERIENCE 2015 FORECAST AT DECEMBER 2015 TARGET ACTUAL VARIANCE % TARGET FORECAST VARIANCE % Customer Satisfaction 85% 99% 14% 85% n/a n/a Table Network Customer Experience Performance 2015 and
122 6.6.3 COST EFFICIENCY Our performance measures for cost performance efficiency are shown in Table below. COST EFFICIENCY 2015 FORECAST AT DECEMBER 2015 TARGET ACTUAL VARIANCE % TARGET FORECAST VARIANCE % Cost per Customer ($) % (11%) Capital Work Delivery ($M) (3%) % Table Cost Efficiency Performance 2014 and 2015 We met our cost per customer efficiency targets in We forecasted to be over the target in We completed our capital delivery programme in 2015 but are predicting a variance in ASSET PERFORMANCE Our asset performance for 2014 and forecast for 2015 is shown below. ASSET PERFORMANCE MEASURES 2015 FORECAST AT JANUARY 2016 TARGET ACTUAL VARIANCE % TARGET FORECAST VARIANCE % GXP Load Factor (%) 60% 59% (2%) 60% 57% (5%) Transformer Utilisation (%) 34% 28% (18%) 35% 29% (17%) Table Asset Performance 2015 and 2016 Our load factor performance has remained below target in both years, without any additional capacity being added at GXPs. Our transformer utilisation is forecast to increase in 2016 primarily due to higher peak demand. 122

123 7. NETWORK DEVELOPMENT AND NON-NETWORK INVESTMENTS
124 7. NETWORK DEVELOPMENT AND NON-NETWORK INVESTMENTS This chapter sets out our approach to network and non-network development and describes the plans we have in place for the AMP period. The chapter is structured as follows: Overview of approach (7.1): explains the core elements of our approach to network planning. This covers planning assumptions, security criteria, definition of the equipment ratings we use, changing delivery requirements, the potential for small scale distributed generation and emerging technologies to impact the AMP and the changes that have occurred due to the review of the 10 year plan; Demand forecast (7.2): describes how we forecast electricity demand for the AMP period. This is a fundamental input that influences the expected timing for growth and security related investment across the network; Overview of our network development plans (7.3): provides a summary of GXP development requirements and outlines our urban and rural development plans; GXP Investment (7.4): describes our proposed investment at Transpower s GXPs; The Urban Network Plan (7.5): presents the needs analysis, options, development projects, and expected timing for the required growth and security related investment in the urban network; The Rural Network Plan (7.6): presents the needs analysis, options, development projects, and expected timing for the required growth and security related investment in the rural network; Summary Network Development Expenditure (7.7): presents the summary of the total forecasted network spend; and Non-Network Investments (7.8): describes our non-network related projects and expenditure. 7.1 OVERVIEW OF APPROACH Our approach to network planning and non-network development is aligned with our vision Provide high quality, reliable utility services valued by our customers whilst protecting and enabling our community Accordingly, our plans have been reviewed and aligned with the requirements of our customers and the overall performance objectives described in Chapter 6. This approach leads to targeted investment based on needs in each area of the network. The two fundamental performance needs addressed by our network development investments are: Capacity constraints forecasted to arise due to peak demand growth in specific areas within the network; and Security issues arising from reduced back-up capacity due to growth in peak demand. The projects identified in this chapter are our view of what is appropriate. It is possible that as the operating environment changes the investments forecast for the mid to latter part of the AMP period may need to be refined. 124
125 OUR APPROACH Chapter 5 describes our process and approach to all investment projects, including network development and non-network investment. In summary, our approach consists of two stages. Need identification: An investment need or primary driver for an investment is identified. The needs considered fall under the categories: safety, reliability performance, asset condition and health, growth and security, customer requests, technology change, or legal, regulatory and environmental requirements. Network development projects can fall under all the need categories with the exception of asset condition and health, which is covered by renewals and maintenance discussed in Chapter 8. Options analysis: Following need identification, potential options that meet the need identified are formulated and considered. The number of options will vary depending on the type and complexity of need(s). Non-network options and demand management solutions are considered as a potential option and undertaken if practical and cost effective. The investment option selected is the one that ensures safety, and best meets identified need(s) for the lowest whole of life cost. There are occasions where a specific externality will result in a decision to adopt an alternative investment path e.g. regulation. All investments are subject to the governance framework and processes described in Chapter KEY PLANNING ASSUMPTIONS AND INPUTS The key assumptions informing our network development planning are: Future peak demand growth as forecast in Section 7.2. The large embedded generation plants operated at Te Uku and Te Rapa will not be available to meet demand following a major power outage. The network is well designed and can be operated to prevent overloads. There are many inputs utilised in the planning process, the key inputs are: The reliability performance sought by our customers and stakeholders as detailed in Chapter 2 and the corresponding performance objectives discussed in Chapter 6. Specific individual customer and stakeholder requirements. The inputs required to forecast electricity consumption and demand, as set out in Section 7.2. Voltage requirements and other regulated limits. Equipment ratings based on the manufacturer nameplate ratings as detailed in Section SECURITY CRITERIA Security criteria set the minimum required level of network redundancy. The degree of redundancy determines the ability of the network to maintain supply following the failure of an asset. Our security criteria are specified to achieve our performance objectives (Chapter 6) and the reliability performance sought by our customers and stakeholders (Chapter 2). 125
126 The security criteria used by us are set out in Table RANGE OF POST CONTINGENT DEMAND (PCD) MVA CUSTOMER IMPACT SECURITY LEVEL TIME TO RESTORE AFTER 1ST INTERRUPTION TIME TO RESTORE AFTER 2ND INTERRUPTION 10 to 25 MVA CBD zone and switching substations 10 to 25 MVA Small GXP or large urban zone substations 5 to 10 MVA Medium urban zone substations 2.5 to 5 MVA Rural zone subs and urban interconnected feeders 1 to 2.5 MVA Urban & rural interconnected feeders Under 1 MVA Rural feeder, urban spur, distribution transformers >2000 N-1 Maintain 100% of PCD * >5000 N-1 Maintain 100% of PCD >2000 N Within 15 minutes restore 75%, within three hours 90%, repair time 100% >1000 N Within one hour restore 75%, within three hours 90%, repair time 100% >300 N Within one hour restore 50%, within three hours 75%, repair time 100% <300 N Restore 100% in repair time Majority restored within two hours, 100% in repair time Within three hours Restore 90%, repair time 100% Within three hours restore 90%, repair time 100% Restore 100% in repair time Restore 100% in repair time Restore 100% in repair time * Post Contingent Demand (PCD) is the peak demand after demand reduction through contracted load control services. Table WEL s Planning Security Criteria PLANNING RISK MITIGATION AND NETWORK ENERGY EFFICIENT OPERATION STRATEGIES PLANNING RISK MITIGATION All equipment, with the exception of power and distribution transformers 5, is factored into our planning based on the capacity rating stated on the nameplate. The overloading of the transformers is in line with the international standards that the transformers were designed to. If applied within the guidelines of the standards it will accelerate the aging of the transformer but does not greatly increase the risk of failure. WEL Networks puts considerable effort into ensuring our loading forecasts are accurate and up to date. The process used is detailed in section 7.2. It is rare for the load to increase at a rate which exceeds equipment normal operation conditions. However, the ability to overload transformers for short durations helps to mitigate the residual planning risk. This means that should load increase faster than expected, then the transformer can be overloaded for short durations The transformer emergency capacity rating is used for planning purposes. All new power transformers are designed with an emergency overload rating of 130%. Older power transformers without an emergency overload rating stated on the nameplate are assumed to have an emergency overload of 120%. Distribution transformers have an emergency overload rating of 150%.
127 Many sections of WEL s network has the ability to be offloaded to neighbouring zone substations and feeders. While the prime reason for this is to provide alternate supply in a fault scenario, it can also be used to mitigate planning risk by providing capacity in the short to medium term planning periods. If the neighbouring zone substation or feeder is lightly loaded it can also be used as a solution to capital investment. An example of this is where, in 2010, 6MW of peak load reduction was achieved by transferring load from Chartwell to Borman substations. This has removed to need to install a third transformer at Chartwell substation. NETWORK ENERGY EFFICIENT OPERATION WEL applies a number of strategies around network energy efficient operation, these include: Load management: A few of the transformers on the network operate in overload at times of peak demand. The use of load control will reduce any overload and therefore improve the efficiency of the transformer. This also has the reduce the loading on the conductors and further improves the efficiency of the network. Smart meters: - We are testing a model that will use our smart meters to determine the load on all distribution transformers. This will allow us to determine the peak loading with more accuracy and into half hour durations. This has resulted in transformers that were scheduled for replacement based on ADMD being reassessed and determined that replacement is not warranted. This results in an increase in transformer utilisation and therefore improvement in efficiency. - The use of this model will also allow us to identify transformers that are overloaded and where the neighbouring transformer is underutilised. This allows load to be shifted between the two transformers thereby improving the efficiency of both INFLUENCE OF DISTRIBUTED GENERATION, EMERGING TECHNOLOGY AND DEMAND MANAGEMENT INITIATIVES There are two large embedded generators in WEL s network located at Te Rapa (50MW cogeneration) and Te Uku (64MW wind) and one small generation unit at Hamilton City Council s Waste Water Plant (1MW cogeneration). The amount of small-scale distributed generation within our network is small, however this is expected to increase as the cost becomes more affordable during the AMP period. Our policy for connecting distributed generation is to comply with the regulated terms and to facilitate connections as efficiently as possible. Most distributed generation is expected in the form of PV installations that generate electricity during sunlight hours and as such, it is unlikely to materially reduce peak demand during winter evenings. Figure shows the recent growth in PV installations. CUMULATIVE CAPACITY OF PV CONNECTIONS CUMULATIVE CAPACITY (KW) YEAR Figure Installed PV Connection Capacity 127
128 While the growth in PV installations does not have a material influence on the network design and investment at this time it may drive the need for further network investment during the AMP period. EMERGING TECHNOLOGY In addition to PV, EV and residential and commercial battery storage systems are the main examples of emerging technologies with the potential to impact on the design and operation of our network. Like PV generation, EVs do not at this time influence our network planning or investment. However, there is significant potential for this to change during the AMP period. Through our participation in an industry forum called GreenGrid 6 we expect to gain a better understanding of the potential impacts of emerging technology on our network. DEMAND INITIATIVES We assume that the current level of load control will continue for the AMP period. Accordingly, a base level of demand based initiatives are accounted for in our planning. Similar to the impact of PV and EV we would expect that the impact of demand initiatives is likely to increase over the AMP period, however this is difficult to quantify at this time CHANGES IN THE 10 YEAR CAPITAL PROJECT PLAN This year a review of the 10 year capital projects was undertaken to reaffirm the drivers with the present and anticipated future developments on the network. The review recommends that the 10 year capital spend profile be reduced by $25.8M. Work was also undertaken to flatten the spend profile. In undertaking the review of the 10 year capital project plan the guiding principle was to maintain the current reliability in the subtransmission and urban areas and allow for improvement in the rural performance. The tools used in this review included: 1. Smart box data to improve the assumptions made. This is best demonstrated by the reduction in the voltage/load rated issues, where the conservative planning assumptions were able to be challenged and more informed investment decisions made. 2. Probabilistic risk modelling was used to evaluate the cost vs benefit of a number of projects, such as the Avalon ripple plant, where it was determined that the cost was significantly higher than the value of the risk being addressed. In this case although the risk was less than the cost it was possible to reduce the risk further by allowing for critical street lighting controls to be replaced with smart boxes. These allow for control via either the ripple signal or mesh control. 3. Condition Based Risk Management (CBRM) has provided greater clarity around asset renewals and the relative importance, in terms of risk, for safety, network performance, environment and financial cost for each asset class. The proposed program ensures the total risk profile will remain stable over the planning period. 4. The challenging of load growth assumptions and the need for improved security across the network has resulted in a number of changes. The table gives a summary of the major components that have resulted in the change Ministry of Business, Innovation and Employment funded forum assessing the impact of distributed generation.
129 TOTAL CHANGE ($,000) YEAR Voltage / Load Related Issues -9,167 All GFN (Ground Fault Neutraliser) -8,605 All Transpower Asset Transfers -7,197 19/20, 20/21 11kV Cable Zone Interconnections Upgrades -4,678 All HAM 11kV Interconnections -2,712 16/17, 19/20, 20/21 Weavers Transformer Upgrade -2,138 16/17,17/18 Airport Zone Substation -1,996 25/26 Gordonton Zone Transformer Replacement -1,878 22/23, 23/24 Glasgow 33kV GIS -1,681 19/20 Huntly to Kimihia 33kV Cable -1,431 24/25 Huntly to Glasgow 33kV Cable -1,281 24/25 Mitigation of line clashing near Zone Substations -892 All Caro Switching Station /17 Glasgow Second Transformer /20 Avalon Ripple Plant /19 COB to ALE trunk for CBD /17 Other -3,925 All Reliability Projects 8,395 All excluding 16/17 Customer Driven Works 15,604 All Total -25,826 Table Major capital project plan changes USE OF SMART BOX DATA The summary of capital expenditure changes driven from improved planning information via smartboxes includes: Voltage/load Related Issues Via the data from smart boxes we have been able to more accurately estimate transformer loadings. This has confirmed that the ADMD (After Diversity Maximum Demand) that has been used previously is conservative and in a number of locations has driven the early replacement of transformers. We have also used the voltage related issues from the smart boxes and undertaken a risk based prioritisation to address the voltage related issues. Both of these have resulted in a reduction in capital commitments. PROBABILISTIC RISK MODELLING The summary of capital expenditure changes driven from probabilistic risk modelling includes: GFN There were a number of GFN projects outlined in the previous plan. However given the issues that have occurred on the commissioning of the Weavers GFN unit, it has been decided to complete the commissioning of this unit and evaluate its performance before considering any additional units. 129
130 Transpower Asset Transfers Last year s AMP had proposed to purchase the Hamilton 11kV Board and the Te Kowhai 33kV board from Transpower. A cost benefit has been completed that determined that it was not cost effective to purchase these assets. 11kV Cable Zone Interconnection Upgrades This was to increase urban reliability by providing improved interconnection. It was decided to place these works on hold as the urban reliability is deemed acceptable. Hamilton 11kV Interconnections The Hamilton 11kV has a number of feeders that cannot be offloaded to other substations. Therefore a fault on this board could result in significant outages. However this equipment is Transpower owned therefore it is considered that this risk resides with Transpower and not WEL. Mitigation of line clashing near Zone Substations - The areas that had the greatest impact have been completed and no further work is planned in this space. Caro Switching Station It was proposed to relocate the Garden Place Switching Station. However it has been determined that with some minor improvements the Garden Place Switching Station can be upgraded and the equipment remain in place. Avalon Ripple Plant It was proposed to install a ripple plant at the Avalon Zone Substation to act as a backup for the existing ripple plants. A cost benefit analysis has been completed and determined that it is not cost effective to install the Avalon plant. The use of smart box mesh control will also continue to be investigated and will be deployed for control of critical street lighting locations. CBRM The summary of capital expenditure changes driven from CBRM includes: Weavers Transformer Upgrade It was planned to replace the transformers at Weavers Substation at the same time as the switchgear replacement. This was to allow for load growth, however given the liquidation of Solid Energy, it is likely that the load on the Weavers Zone Substation will decrease. Consequently the upgrade has been postponed until there is certainty regarding future loading in the area. Gordonton Zone Transformer Replacement It was planned to replace the transformers at the time of the substation upgrade. However the drivers behind the substation upgrade are not related to load or the transformer condition. Therefore it is proposed not to replace the transformers. This will mean that at times the Gordonton Zone Substation will not have N-1 security, however given the size of the load, this is appropriate. LOAD GROWTH ASSUMPTIONS The summary of capital expenditure changes driven from a review of load growth assumptions include: Airport Zone Substation Given the changes to some of Peacockes circuits and slower than expected growth in the airport area, it was decided to delay the installation on the Airport Zone Substation. Glasgow 33kV GIS / Huntly to Glasgow 33kV Cable / Glasgow Second Transformer Given the liquidation of Solid Energy and the proposed retirement of the Genesis Energy generators it has been decided to delay any upgrades in the Huntly area. Huntly to Kimihia 33kV cable The Kimihia Zone Substation predominantly supplies the Huntly East Mine. Given the liquidation of Solid Energy it is possible that the Kimihia Zone Substation will no longer be required, and may in fact need to be removed to return the mine land to the required state. COB to ALE trunk - It was proposed to install a trunk feeder from Cobham Substation to Alexandra Switching Station which would provide greater security should the load in the CBD increase. It has been proposed to defer until there is greater clarity regarding any potential load increase in the CBD. 130
131 7.2 PEAK DEMAND FORECAST Our network is currently delivering just over 1,200 GWh of electricity per year with coincident peak demand of 251MW. This peak demand is the principle driver of our network development investment. Our forecast of peak demand is a fundamental input and determines the expected timing for growth related investment across the network during the AMP period. Forecasting future peak demand is inherently challenging and somewhat subjective. For example, we are currently observing a reduction in the average amount of electricity being delivered to our domestic customers, flat peak demand across the network and increasing amounts of PV being installed. Our approach to developing demand forecasts is discussed in this section, including our assumptions and the level of uncertainty involved FORECASTING METHODOLOGY Our forecasting methodology involves a number of components. Each component is assessed and combined to produce our best estimate of peak demands during the AMP period. Historically our peaks occur during winter months. ESTABLISHING BASE DEMAND The most recent peaks for 2016 were measured at zone substations, GXPs and in total across our network. The peaks between zone substations and their respective GXP are generally not coincident, meaning they generally don t occur at the same time, due to diversification in customer use. Similarly, there is diversity in peak demand between GXPs and the total network peak demand. One-off events not likely to repeat are eliminated from these actual peaks. This establishes a baseline demand level for our forecasts. DRIVERS OF PEAK DEMAND The second component of the methodology assesses the drivers of peak demand growth during the forecast AMP period. The drivers are set out. Hamilton City Residential - residential growth is expected in the Borman area, in the northeast and new subdivisions planned for Ruakura in the southeast of Hamilton City. We have estimated a total of 9MVA of peak demand growth for the Borman area. Due to uncertainty of timing and intensity, we have assumed 2 MVA of peak demand for Ruakura during the AMP period. Waikato District Residential & Agricultural growth in these areas is expected to be modest and we have assumed a continuation of the historical trend observed adjusted for the step change as a result of the Te Kauwhata Structural Plan change; Industrial and Commercial our growth forecast is based on applications received and our discussions with developers. A diversity factor is assigned to the new demand and an uptake rate is estimated using the best information available. We have forecast 20MVA demand increase in the Tasman area (between The Base and Rotokauri) and 2MVA for the adjacent Horotiu area. Distributed Generation no adjustment has been made for small scale distributed generation due to its limited ability to impact peak demand. This assumption will be reviewed in future forecasts as our understanding of PV and other emerging technologies improves and these technologies become more prevalent. Load Control - is assumed at current levels throughout the planning period. Temperature impacts - temperature can impact peak demand. Colder winters can increase demand by as much as 10% compared to average winters. This variation is allowed for in our contingency planning. Residential Time of Use Tariffs (enabled by smart meters) - are unlikely to impact peak demand in the immediate future. However, Time of Use (TOU) tariffs may become a feature of future retail tariffs offerings so we have assumed a 1% reduction in peak demand from 2020 onwards. 131
132 EVs growth in EV usage has the potential to significantly increase the amount of electricity our network delivers. The impact on peak demand will depend on how and when customers charge their EVs. No allowance for the impact of EVs is included in the forecast, however we are monitoring developments and will review our assumptions as necessary. FORECASTING UNCERTAINTY All forecasts involve a degree of uncertainty particularly over longer periods. As a result our demand forecast is expected to be less accurate in the later years of the AMP period. The uncertainty will be greater where there are changing circumstances or the potential for new activities. Our development plans and corresponding investments may be amended in subsequent revisions of our AMP reflecting the emerging needs of our customers and stakeholders and changing circumstances on our network DEMAND FORECAST 2017 TO 2026 We expect to see small increases in localised peak demand caused by connection growth in residential subdivisions and the commercial/industrial sectors. We expect peak demand to modestly increase over the AMP period. Table shows the individual GXP forecast and the demand forecast for the AMP period. GXP Hamilton 11kV Hamilton 33kV Huntly 33kV Te Kowhai 33kV System Peak Table GXP demand forecast to ZONE SUBSTATION DEMANDS Table shows the expected peak demand at each of our zone substations. The zone substations where growth is expected to exceed the firm capacity are highlighted. In the table firm capacity means the 4 hour emergency thermal chain rating. ZONE SUBSTATION SECURITY FIRM (N-1) CAPACITY 7 (MVA) Avalon Dr N Borman N Bryce St N Chartwell N Claudelands N Based on emergency thermal chain rating
133 ZONE SUBSTATION SECURITY FIRM (N-1) CAPACITY (MVA) Cobham N Finlayson Rd N Glasgow St N Gordonton N* Hampton Downs N Horotiu N Kent St N Kimihia** N Latham Court N Hoeka Rd N Ngaruawhia N Peacockes Rd N Pukete-Anchor N Pukete - 11kV N Raglan N HAM11 N Sandwich Rd N Tasman N Te Kauwhata N Te Uku N Wallace Rd N Weavers** N* Whatawhata N Table Zone Substation demand forecast to 2025 * Substations run at N Security, however these substations have an N-1 capacity of: Gordonton 5MVA and Weavers 7.5MVA. ** If the mines operated by Solid Energy (in receivership) close then there will be a reduction in the load of Kimihia and Weaver substations. This reduction has not be factored into Table as the future of these mines is unclear at this stage. 7 Based on emergency thermal chain rating 133
134 7.3 OVERVIEW OF NETWORK DEVELOPMENT PLANS Our network development plan is comprised of three component plans: GXP investment Urban development Rural development These reflect the performance requirements described in Chapter 6 and align with our stakeholder expectations discussed in Chapter 4. The following sections discuss each plan component. 7.4 GXP INVESTMENT Table below shows the firm capacity at each GXP and the forecast peak demand in 2017 and GXP INSTALLED CAPACITY 8 (MVA) FIRM (N-1) CAPACITY 9 (MVA) PEAK DEMAND FORECAST (MVA) Hamilton 11kV Hamilton 33kV Huntly Te Kowhai Table GXP Capacity and Demand Forecast Our peak demand forecast shows a need to augment the supply capacity at the Hamilton GXP. To address the capacity issue at the Hamilton 33kV GXP the following measures have been undertaken or will be investigated and implemented:. Improved load management. Initial investigations indicate that reductions in the peak demand can be achieved by improving the reinstatement of our load control. The Gordonton load has been shifted from the Hamilton GXP to the Huntly GXP (coincident peak demand of approximately 3MVA). One of the two transformers at Hamilton (T5) is smaller than the other and due to be upgraded. Transpower s life cycle replacement of T5 will add additional firm capacity of 9MVA. The replacement is scheduled for PLANNED INVESTMENT The option of transferring ownership of the equipment listed below from Transpower to WEL was investigated: Hamilton 11kV GXP switchgear Hamilton 33kV GXP switchgear Te Kowhai 33kV GXP switchgear This analysis indicated that this would not have been an economic transfer for WEL and was therefore removed from the 10 year plan. There are no further GXP investments planned over the AMP period Based on continuous rating 9 Based on emergency thermal chain rating
135 7.5 URBAN DEVELOPMENT PLAN Our Urban Development Plan addresses the need for additional capacity and security in localised areas of growth within Hamilton City. It also reflects additional needs including: improvement in network control and automation identified safety related network investments investments specifically requested by individual customers. This section describes the identified development needs, the options considered, and the resulting investment required over the AMP period. It is structured as follows: Subtransmission Zone Substation Distribution LV Other system fixed Assets Customer driven works SUB-TRANSMISSION One subtransmission investment need has been identified over the AMP period. Residential, commercial and industrial growth expected within the Tasman area (between The Base and Rotokauri) will require additional subtransmission capacity by Options to address this included: increasing the subtransmission capacity to the Tasman substation developing a new zone substation and offloading to neighbouring zone substations. The preferred option is the installation of additional capacity to the Tasman substation (TAS). This option includes increasing the capacity at TAS as discussed in Section below. Work undertaken this year determined that the capacity of the TAS substation could be increased by installing additional cables between the transformers and the 11kV board. This will increase the firm capacity of the substation to 32MVA, thereby delaying the need for increased capacity in sub-transmission until The installation of a new sub-transmission cable is expected to take two years and therefore the physical works are scheduled to start in The subtransmission project for the period is summarised in Table PROJECT / PROGRAMME Te Kowhai (TWH) GXP TAS 33kV link INVESTMENT NEED /OPTIONS CONSIDERED ESTIMATED COST ($000) Investment Need: Increased demand growth at TAS substation due to increased industrial commercial development. 4,207 Options Considered: Upgrade the capacity to Tasman, develop a new zone substation, or off load to existing substations. Table Urban subtransmission development projects 2017 to 2026 TIMING 2017 to
136 Table summarises the expected subtransmission investment over the AMP period. SUBTRANSMISSION ($000) Subtransmission ,200 2,947 - Table Urban subtransmission development projects forecast expenditure profile ZONE SUBSTATIONS Categories of urban zone substation investment needs have been identified during the AMP period. These are: Additional capacity for localised demand growth in the Tasman area. As discussed in Section above, forecast growth in the Tasman area requires additional capacity to be installed by Safety related investments. A number of projects are planned to improve the safety of the equipment and operation of that equipment. They also ensure that access to potential hazardous areas is controlled. The planned safety projects include: - Garden Place switching station upgrade: the Garden Place switching station has limited space, the equipment is old and the substation is damp. Together these characteristics make substation safety complex to manage. Therefore, to improve the safety for our employees an upgrade will occur to improve the conditions listed above. - Substation Site Security Access Project: we are planning to upgrade the access control in all zone substations with an improved card reader system. - Arc Flash protection upgrade: arc flash protection detects the flash of light produced by an electrical arc and then automatically trips the effected equipment. This greatly reduces the energy released during such events and reduces the risk and severity of injury for the equipment operator. The upgrade of Latham 33kV switchgear to improve network security. The current legacy switchgear at the Latham 33kV zone substation does not interface with our proposed protection upgrade (as discussed in Section 7.5.4). Therefore, an upgrade of the switchgear began in 2016 and will be completed in The table on page 118 summarises the zone substation projects, options considered, projected investment and timing. 136
137 PROJECT / PROGRAMME INVESTMENT NEED /OPTIONS CONSIDERED ESTIMATED COST ($000) TIMING Tasman 3rd Transformer Investment Need: Demand growth of Rotokauri structure development Options Considered: New Zone substation, or increase capacity, or transfer demand 4, to 2025 Garden Place Switching Station Refurbishment Investment Need: Safety Issue, complex management Options Considered: Upgrade existing GAR Switching Station, Establish new 11kV switching station to 2019 Substation Site Security Access Project Investment Need: Improve security of the substation sites Options Considered: Improve security or do nothing to 2019 Arc Flash Implementation Latham 33kV GIS outdoor to indoor conversion Investment Need: Improved operator safety Options Considered: Provide full-cover flash protection PPE, or Install arc flash protection. Investment Need: Security upgrade of switchgear Options Considered: Upgrade of switchgear to be compatible with protection or do nothing to Table Urban zone substation development projects for 2017 to 2026 Table summarises the zone substation investment required over the AMP period. ZONE SUBSTATIONS ($000) Zone substations ,000 1,853 - Table Urban zone substation projects forecast spend profile DISTRIBUTION Four categories of urban distribution network investment needs have been identified over the AMP period. These are: Improved network security. These projects address distribution feeders that don t meet our security criteria based on the number of customers supplied. It also includes the upgrade of LV circuits which have become underrated due to demand growth. The security projects include: - Transfer of customers between Peacockes feeders (PEACB3 to PEACB6) - Upgrade Avalon feeder AVACB4; and - Transfer of customers between Horotiu and Ngaruawahia (HORCB6 to NGACB5) Air-conditioning for substations. A number of substations have issues with high humidity and temperature. This results in insulation determination and faults. Therefore it has been proposed to address the issue by installing air conditioning units. Demand growth capacity projects. These projects include: - Distribution network reinforcement of feeders that have identified loading issues. 137
138 Embedded generation. Network issues resulting from the installation of small scale embedded generation. The table below summarises the distribution level projects, options considered, projected expenditure and timing. PROJECT / PROGRAMME INVESTMENT NEED /OPTIONS CONSIDERED ESTIMATED COST ($000) TIMING Upgrade CBD Distribution Ring Feeders Reduce customers on PEACB3 by transferring to PEACB6 Upgrade AVACB4 Distribution Network Reinforce - Ongoing Reduce customers on HORCB6 by transferring to NGACB5 Investment Need: Feeder weak sections limits feeder capacity and ability to supply under contingency Options Considered: Replace weak sections to increase feeder capacity. Install new feeder. Investment Need: PEACB3 exceeds network standard on number of connected customers Options Considered: Transfer some customers to PEACB6, Do nothing Investment Need: AVACB4 have exceeded customer number standard (1,200) which resulted in high SAIDI impact Options Considered: Transfer some customers to AVACB1, upgrade feeder to increase capacity and install automated switch, Do nothing Investment Need: Feeders identified with loading and/or security issue Options Considered: Upgrade feeder, Install new 11kV cables, Install automated switch Investment Need: Large number of customers on a long rural line, therefore a large number of customers on a section of line that is prone to faults Options Considered: Transfer some customers to NGACB5, Do nothing , to Network Upgrade Due To Distributed Generation applications Air-conditioning for substations Investment Need: Capacity and security issues due to distributed generation connections to the network Options Considered: Upgrade network to rectify pre-existing issues Investment Need: A number of substations have high humidity and temperature issues Options Considered: Install air conditioning, ventilation, due nothing Table Urban distribution level network projects for 2017 to to to
139 Table summarises the distribution investment required over the AMP period. DISTRIBUTION ($000) Distribution ,371 3,072 3, ,550 Table Urban distribution level network projects forecast spend profile OTHER SYSTEM FIXED ASSETS Eight investment needs have been identified for other system fixed assets during the AMP period. These are: Smart Box investments. Continuation of Smart Boxes installation at customers meter boards. These provide information on the network and assist in network management. Consenting for projects. Ongoing subdivision development within the northwest and northeast areas of Hamilton requires that land access for utility services is secured. Therefore, we have allowed for consenting costs within these areas for future subtransmission supply routes. Automatic Under Frequency Load Shedding (AUFLS) scheme changes. AUFLS is used by the SO to shed load to prevent total failure of the power system. The way in which AUFLS will be set is changing and changes will be required to comply with the new national requirements. Provision covers the cost of new assets required to meet the SO requirements. Access and Monitoring - Video IP Camera. With improved communication circuits to many of our zone substations cameras can be installed, which can be used to remotely determine what is happening at a zone substation prior to fault staff entering. Mesh control of critical streetlight control. By replacing the controls for some critical streetlight controls with smart boxes it will be possible to remotely switch these should there be a failure of the ripple plant. Protection upgrade. Replacement of old and less reliable distance protection is planned for The improved system will provide a simpler protection system, improving safety and will result in less false tripping and a corresponding improvement in network performance. Fibre routes. This is a communications enhancement project to allow for the protection upgrade and improved operational flexibility. There is also an allowance to install fibre when other work is being undertaken.load monitoring of distribution transformers. Demand monitoring of distribution transformers will improve modelling of network voltages. This project includes the installation of additional 11 LV transformer demand monitoring devices. The following table summarises the projects, options considered, projected expenditure and timing. 139
140 PROJECT / PROGRAMME INVESTMENT NEED /OPTIONS CONSIDERED ESTIMATED COST ($000) TIMING Smart Boxes Investment Need: Smart meters provide the opportunity to provide information on the network that can identify power quality issues. 3, to 2026 Options Considered: Continue with Smart Box roll out, do nothing Consenting costs for projects AUFLS scheme changes Access & Monitoring - Video IP Camera 33kV Protection Upgrade distance to differential Mesh control of critical streetligthing circuits Fibre Routes Opportunistic fibre installations Installation of LV transformer demand monitoring device Investment Need: Secure access within development areas to support future supply options to 2026 Options Considered: Process resource consent, do nothing Investment Need: Compliance to new AUFLS regime Options Considered: Comply with to 2018 regulatory requirement, do nothing Investment Need: Provide visibility on Substation s building and yard Options Considered: Install Video IP Camera, Install standard video camera, do nothing Investment Need: Existing distance protection does not provide proper tripping discrimination on some types of faults in a meshed network causing security issues Options Considered: Do nothing, Review settings to reduce permissive over-reach, Install differential protection on circuits, Install open points in the 33kV mesh. Investment Need: Provide backup to streetlighting control given a failure of the ripple plant to 2019 Options Considered: Provide backup, do nothing Investment Need: Install new fibre to provide redundancy and replace existing pilot wires 2, to 2022 Options Considered: Install new fibre, Install radio, remain on pilot wire Investment Need: Opportunity to install fibre cable or duct when there is Council or third party road and footpath works Options Considered: Install fibre cable or to 2026 duct when there is Council or third party road and footpath works Investment Need: Lack of monitoring devices. Old devices have faulted to 2019 Table Urban other system fixed assets projects for 2017 to
141 Table summarises the expected other system fixed asset investment required over the AMP period. OTHER SYSTEM FIXED ASSETS ($000) Other system Fixed Assets , , Table Urban other system fixed assets projects forecast expenditure profile CUSTOMER DRIVEN WORKS Three customer driven needs have been identified during the AMP period. These are: New connections and upgrades. Investment required to connect new customers and upgrades for customers that have a step change in demand. A provision based on the historical levels has been made to account for these works. Relocations. These are predominantly relocations of our assets associated with the continuing development of the Waikato expressway (Huntly and Hamilton sections. Undergrounding. In some circumstances and upon request we convert overhead lines to underground cables. We fund up to 50% of the total project cost, up to a total WEL contribution of $500k. The following table summarises the projects, options considered, projected expenditure and timing. PROJECT / PROGRAMME New Connections and upgrades Relocations Undergrounding INVESTMENT NEED Investment Need: Network existing capacity is compromised with the additional demand Investment Need: relocation of assets to support the expressway development Investment Need: undergrounding of overhead lines ESTIMATED COST ($000) TIMING 88, to , to , to 2026 Table Urban customer driven works projects for 2017 to 2026 Table summarises expected customer driven works investment over the AMP period. CUSTOMER DRIVEN WORKS ($000) Customer Driven Works ,942 12,159 10,394 9,757 9,616 9,616 9,616 9,616 9,616 9,616 Table Urban customer driven works forecast expenditure profile 141
142 7.5.6 SUMMARY OF 10 YEAR EXPENDITURE PLAN Table summarises the expected urban area growth and security expenditure required over the AMP period. URBAN EXPENDITURE ($000) Subtransmission ,200 2,947 - Substation ,000 1,853 - Distribution ,371 3,072 3, ,550 Other system Fixed assets Customer Driven Works 890 1, , ,942 12,159 10,394 9,757 9,616 9,616 9,616 9,616 9,616 9,616 Urban Total 14,523 14,484 12,345 11,384 11,951 13,430 13,216 14,033 14,978 11,508 Table Urban development expenditure forecast expenditure profile 7.6 RURAL DEVELOPMENT PLAN Our Rural Development Plan addresses the need to improve voltage performance and security on our rural network. There are no growth related rural investments required within the AMP period. The reliability performance of the rural network is predominantly addressed by our asset renewal programme, as discussed in Chapter 8. There are a number of projects planned to address rural network security which will also contribute to improved reliability performance. This section is structured by network level. Subtransmission Zone Substation. Distribution. Other SUBTRANSMISSION There is no investment planned for rural subtransmission over the AMP period ZONE SUBSTATIONS Three investment needs have been identified for rural zone substations over the AMP period. These are: Improved network security and reliability: These projects include upgrades of the Te Uku substation, Weavers protection and Gordonton Substation. Safety and security: This programme is primarily concerned with the seismic strengthening of substations and switching stations. The aim of the project is to bring zone substations up to the requirements for Importance Level 4 (IL4) buildings. 142
143 Completion of the Hoeka Rd Zone Substation: This commenced in 2015 and is expected to be completed in The second stage of the Hoeka Rd substation is scheduled for late in the AMP period. The following table summarises the projects, options considered, projected expenditure and timing. PROJECT / PROGRAMME INVESTMENT NEED /OPTIONS CONSIDERED ESTIMATED COST ($000) TIMING Te Uku substation upgrade Weavers Protection Upgrade Hoeka Rd Zone Substation Seismic strengthening of substations and switching stations Gordonton Substation upgrade Investment Need: Asset replacement and safety improvements Options Considered: Upgrade substation to present standards, transfer demand, do nothing Investment Need: Upgrade the aged protection relays Options Considered: Upgrade protection, do nothing Investment Need: Increase capacity to cater for future demands. Options Considered: New zone substation to cater for demands on the far south east, do nothing Investment Need: Safety and compliance Options Considered: Strengthen buildings to comply Investment Need: Asset replacement and existing configuration is only one circuit breaker for two transformers Options Considered: Upgrade substation to present standards, transfer demand, do nothing 3, to , to , to 2021 Table Rural Zone substation growth and security projects 2016 to 2025 Table summarises the rural zone substation investment required over the AMP period. ZONE SUBSTATION ($000) Zone Substation ,890 1,598 2, ,695 Table Rural Zone substation projects forecast expenditure profile DISTRIBUTION Four distribution investment needs have been identified during the AMP period. These are: Improved network security: Along with the asset renewals detailed in section 8, these project have been included to achieve the rural reliability improvements outlined in section These projects include: - Network Automation. By automating selected devices significant improvements in fault restoration times can be achieved; and 143
144 - Security projects. Network investigations will continue to identify opportunities to improve reliability by adding additional feeders and feeder interconnections to the network. Voltage Levels: There are a number of areas within the rural network that experience low voltages during peak demand times. A number of projects are planned to rectify these issues and improve the voltage within the rural network. Identification of these projects include where Smart Boxes or network modelling has indicated an issue with voltage this is investigated and solutions determined and where a customer complaint is related to power quality issues network investment is often required. Ground Fault Neutralisers or line renewal: Commissioning of the Weavers GFN, to reduce interruptions to customers in the area due to earth faults caused by contact with trees or other such events. The following table summarises the rural distribution projects, projected investment and timing. PROJECT / PROGRAMME INVESTMENT NEED /OPTIONS CONSIDERED ESTIMATED COST ($000) TIMING Investment Need: Minimise SAIDI impact Reliability projects Voltage upgrade projects due to monitoring Power Quality - Works required to correct customer complaints Options Considered: Addition of new equipment, line reconfiguration, automation, do nothing Investment Need: ICPs identified by smart boxes with power quality issues Options Considered: Install new transformer and/or LV circuits, upgrade existing transformer and/or LV circuits Investment Need: Power quality issues identified within the network through customer complaints Options Considered: Install new distribution transformer and/or LV circuits to transfer customers, upgrade existing distribution transformer and/or LV circuits 9, to , to to 2026 GFN Investment Need: Loss of supply during single phase to earth faults Options Considered: Commission the Weaver s GFN, Do nothing Table Rural distribution projects for 2017 to 2026 Table summarises the rural distribution investment required over the AMP period. DISTRIBUTION EXPENDITURE ($000) Distribution 1,250 2,682 2,534 2,598 2,568 2,490 2,532 2,562 2,580 2,532 Table Rural distribution projects forecast expenditure profile OTHER SYSTEM FIXED ASSETS One investment need has been identified for other system fixed assets during the AMP period. This is to improve our radio network
145 Table summarises the expected other system fixed asset investment required over the AMP period. OTHER SYSTEM FIXED ASSETS ($000) Other system Fixed Assets Table Urban other system fixed assets projects forecast expenditure profile EXPENDITURE SUMMARY Table summarises the rural area growth and security expenditure required over the AMP period. RURAL EXPENDITURE ($000) Subtransmission Substation ,890 1,598 2, ,695 Distribution 1,250 2,682 2,534 2,598 2,568 2,490 2,532 2,562 2,580 2,532 Other system Fixed assets Rural Total 1,800 2,822 3,234 5,488 4,166 4,490 2,583 2,562 2,580 4,227 Table Rural development forecast profile 7.7 SUMMARY NETWORK CAPITAL INVESTMENT The 10 year Network Capital Investment forecast is shown in table 7.7. Work has been undertaken to spread the required capital over the AMP period. 10 YEAR NETWORK DEVELOPMENT EXPENDITURE GXP URBAN RURAL $000 20,000 18,000 16,000 14,000 12,000 10,000 8,000 6,000 4,000 2, Figure 7.7 Network development forecast profile
146 7.8 NON-NETWORK INVESTMENTS This section describes our non-network related projects. These projects focus on enabling a higher level of efficiency across the company and enabling the delivery of services to our customers. Our policy for the development, renewal and maintenance of our non-network assets is to ensure that they remain fit for purpose at the lowest overall lifecycle cost. The non-network expenditure falls into two categories: Non-network capital expenditure and Non-network operational expenditure. Each of these are addressed in the following page NON-NETWORK CAPITAL EXPENDITURE The non-network capital expenditure addressed in this section covers: Computer Software Capital Expenditure. This covers the periodic upgrades of existing software applications and the development of new business tools. Examples include: - Major version upgrades for our industry standard software applications including SAP, Intergraph GeoIS, Microsoft Office, desktop and server platforms, our document management system (Content Manager) and the NMS; - Implementation of the mobility project, which provides direct in-field to SAP connectivity, resulting in significant productivity gains; - A revenue billing project will provide increased revenue assurance, by identifying exceptions and anomalies between retail and wholesale billing; and - Mobile GeoIS platform which will provide a range of services to our staff, partners and customers, by allowing access to key asset information such as service plans, fault details and outages in real time. Computer Hardware Capital Expenditure. This covers the physical computing infrastructure including servers, storage, switches, firewalls and desktops. Our server systems have an expected lifespan of 3-4 years and will need to be updated in Desktop, laptop, and tablet computing devices are also on a three year replacement cycle. We will also continue to monitor and review the use of on-premises infrastructure, versus moving hosting into the cloud. It is highly likely that relatively non-critical systems (e.g. Office, PABX, Exchange, and even SAP) could migrate into the cloud over the timeframe of this plan, with transfer of costs into operating expenditure. Plant and Equipment. A replacement of existing testing equipment is forecast for 2016 to facilitate putting in place a new testing regime by the Asset Management team. Motor Vehicles. The forecast reflects the programme to replace leased vehicles with owned. The replacement schedule of leased vehicles will conclude in In addition, several rebuilds of trucks are due to be completed in A high number of owned vehicles will be replaced due to age and anticipated kilometres in The forecast reflects the advantage of owning our vehicles as the asset can be retained for longer periods than leasing legislation allows and that is demonstrated in the lower forecast for 2019 to NON-NETWORK OPERATIONAL EXPENDITURE The non-network operational expenditure addressed in this section covers: Systems operations and network support. This covers areas of the business functions including: - Asset Management which includes Asset Information and Strategy, Network Planning, Maintenance Strategy, Network Design, Customer Projects, Development and Automation, System Control and Engineering. - WEL Services which includes, Field Services, Distribution Design, Capital Projects. - Customer Support and Procurement 146
147 Business support. This covers areas of the business functions including: - Finance, Commercial and Technology which includes, Information Services, GIS, Procurement, Business Assurance, Regulatory and Metering Services. - People and Performance which includes Health and Safety, Organisational Development and Human Resources. The spend profile over the AMP period remains flat due to a stable level of activities SUMMARY OF NON-NETWORK EXPENDITURE The table below summarises the expected non-network expenditure required over the AMP period. NON-NETWORK CAPITAL EXPENDITURE ($000) Computer Hardware Computer Software 2,094 1,958 1,085 1, ,109 1, Plant and Equipment Motor Vehicles 650 1, Total 3,804 4,014 1,905 2,786 2,355 1,902 3,127 2,677 1,621 1,621 Table Non-Network Capital Expenditure NON-NETWORK OPERATIONAL EXPENDITURE ($000) System operations and network support 3,400 3,449 3,498 3,547 3,597 3,648 3,699 3,751 3,804 3,857 Business support 13,222 13,367 13,514 13,663 13,813 13,965 14,119 14,274 14,431 14,590 Total 16,622 16,817 17,012 17,211 17,411 17,613 17,818 18,026 18,235 18,447 Table Non-Network Operational Expenditure 147

148 8. RENEWALS AND MAINTENANCE
149 8. RENEWALS AND MAINTENANCE This chapter describes our renewal and maintenance approach for the AMP period. It details our planned renewals and maintenance work and how we have forecast the associated expenditure. The chapter is structured as follows. Overview of Maintenance and Renewals (8.1) provides an overview of our approach to renewals and maintenance and how it fits within our asset management framework. Maintenance (8.2) describes how we ensure that we undertake an appropriate level of maintenance on our assets. Renewals (8.3) describes our approach to determining an appropriate level of renewal expenditure on our assets. Asset Life Cycle Management (8.4) describes the maintenance and renewal challenges we face and how we will address these during the AMP period. Expenditure Summary (8.5) summarises our renewal and maintenance expenditure during the AMP period. 8.1 OVERVIEW OF MAINTENANCE AND RENEWALS Delivering our performance objectives, as described in Chapter 6, requires the right balance between expenditure on maintenance and investment in renewals. In striking this balance, we have considered the whole of life cost of our assets, and required interventions during their lifecycle. As established by our asset management framework, described in Chapter 4, we have taken a risk based approach to renewals with the implementation of CBRM. All major asset groups are now contained within the CBRM model. The largest change that resulted in the implementation of the CBRM model was the quantification of the risk associated with the 16mm 2 conductor. This has driven us to increase our renewal program for the conductor replacement to mitigate this risk. This has significantly reduced the number of faults resulting from broken conductors since the implementation of the renewal program, however due to the variable nature of conductor faults it is too early to fully quantify the extent of the improvements. The use of CBRM has also allowed us to better quantify the risk of other asset groups and improve our capital replacement programs as detailed in section The resulting maintenance works and renewal plans are described below. 8.2 MAINTENANCE Our maintenance activity is first and foremost safety focused. After which, it is structured to minimise the whole of life costs of our assets while managing their performance over time. This is achieved by selecting maintenance techniques and processes that: Ensure safety risks are identified and mitigated; Optimise the costs of maintenance together with renewal expenditure; Meet any regulatory requirements; and Where possible improve network availability. These techniques are described for each asset category in Section
150 8.2.1 ASSUMPTIONS AND INPUTS A number of assumptions and inputs inform the level of maintenance undertaken on our assets. The key assumptions and inputs are described below. INDUSTRY STANDARDS AND ANALYSIS TOOLS Maintenance tasks are determined by the use of industry maintenance standards, support tools and analysis. ASSET INSPECTIONS We regularly inspect our assets and the surrounding vegetation. The frequency at which an asset is inspected or monitored is determined by potential risk, manufacturer s recommendations and legislative requirements. During an asset inspection, the condition is assessed and recorded along with any defects found in the Computerised Maintenance Management System (CMMS). CONDITION ASSESSMENT Asset condition influences the extent of servicing required, the necessary repairs required and provides vital data to inform our asset renewal decisions. Our condition assessment is based on a 0 to 5 rating system, as set out in Table below. CONDITION SCORE REMAINING LIFE DESCRIPTION DEFINITION 5 Early Life As newly installed or equivalent 4 Mid Life Normal ageing and use 3 Near End of Life Likely to meet replacement criteria at the next inspection 2 End of Life Meets replacement criteria. Schedule for replacement within 18 months 1 Unserviceable Unserviceable but not hazardous. Replace within 14 days 0 Hazard Immediate action is required to eliminate hazard Table Asset Condition Assessment Ratings DEFECT NOTIFICATIONS Defects are identified during inspections. If an asset has a defect, the asset inspector will assess the severity of the defect and assign a defect rating as specified in Table below. DEFECT RATING DEFECT CLASSIFICATION DELIVERY PERIOD DEFINITION 1 Red 2 days Faults / Urgent work required immediate temporary repairs may be required to make safe 2 2 weeks No customer outages or door knock for low volume of customers. 3 Amber 4 weeks Major customer consulted if outage required, typically Plant Maintenance will be priority weeks Long lead material consideration 5 Green 12 months Typically asset replacement works or jobs which could be undertaken as part of capital projects. Table Defect Classifications 150
151 8.2.2 MANAGEMENT OF SF 6 SF 6 is a gas used in modern switchgear as an insulating and arc quenching material. We have initiated a review of equipment that could be used as an alternative to SF 6 -filled switchgear. In the meantime we are required by law to disclose the quantity we have installed in our network. We record and monitor the volumes of SF 6 gas installed, disposed and emitted into the environment. As at November 2015 the volume of SF 6 utilised by our switchgear was 1.26 tonnes VEGETATION MANAGEMENT Vegetation management is the process of managing vegetation in and around our assets that have the potential to interfere with the safe and reliable supply of electricity to our customers. We have increased our inspection rates and maintain a vegetation growth model to predict when future work will be required for different vegetation types. Vegetation expenditure is based on our vegetation growth model. Based on current cutting rates our model predicts expenditure will reduce towards the end of the AMP period as shown in Table VEGETATION MANAGEMENT ($000) Operational Expenditure Vegetation Management 1,316 1,316 1,316 1,316 1,021 1, Total 1,316 1,316 1,316 1,316 1,021 1, Table Vegetation Management Expenditure SERVICE INTERRUPTION AND EMERGENCY MANAGEMENT Service interruption and emergency management relates to required faults work. The decrease in the projected faults costs as shown in Table is mainly due to efficiency gains with the introduction of the new Faults team, proactive repairs on defects due to the enhanced diagnostic testing we have introduced and reduction in line breaks due to the conductor renewal programme. SERVICE INTERRUPTION AND EMERGENCY MANAGEMENT ($000) Operational Expenditure Service Interruption and Emergency Management ,500 2,500 2,450 2,450 2,331 2,240 2,149 2,058 1,967 1,967 Total 2,500 2,500 2,450 2,450 2,331 2,240 2,149 2,058 1,967 1,967 Table Service Interruption and Emergency Expenditure 151
152 8.2.5 MAINTENANCE FORECASTING Our maintenance activities and associated expenditure have been forecast by asset category. The basis of the forecast includes estimates of asset quantity, maintenance type (preventive, predictive and corrective) and relevant unit costs. Unit costs are based on historical maintenance task costs adjusted for known changes e.g. increases in labour costs. The maintenance forecast for each asset category is shown at the end of each section below INNOVATIONS AND IMPROVEMENTS IN MAINTENANCE PRACTICES Innovation and continuous improvements are necessary to meet our cost efficiency objectives. The maintenance related improvements and innovations we have recently implemented include: Development of mobility solutions to record asset information in the field and transfer it directly into our office systems; Improved inspection strategies that enhance risk identification, asset condition and population data; Implementation of accelerated inspection programmes for overhead line assets and LV pillars; Improvement of asset data quality and accuracy through the field verification programme; Introduction of diagnostic testing on primary assets; Specification of strategic spare requirements for emergency preparedness; and Development of a modular substation used for equipment testing, spares and training of technical staff. The application of these innovations and improvements is discussed in Section 8.4 below. 8.3 RENEWALS We have used CBRM to develop a risk based approach to planning our asset renewals. This approach prioritises the renewal of assets that present the highest risk to safety, network performance, environment and financial loss. The methodology is used by numerous electricity distribution companies internationally to deliver effective risk related asset management. CBRM is a process that combines asset information, engineering knowledge and practical experience to estimate future condition and performance of network assets. Specific risks for each asset category are identified and quantified. We have developed CBRM models for all of our key assets. Further detail on the CBRM process is described in Appendix B. REPLACEMENT CAPITAL EXPENDITURE (REPEX) REVIEW An independent review of our proposed renewal expenditure has been undertaken using a Repex modelling approach. 10 The review provided assurance that our proposed expenditure (developed using CBRM) is appropriate INVESTMENT SCENARIOS To determine the optimal level of renewal expenditure across our key asset categories we considered four alternative investment scenarios. Figure below shows indicative 10-year risk profiles for each scenario. The scenarios are: Scenario 1 Do nothing models a hypothetical base case to understand the effects of not undertaking renewals. By year ten the risk is expected to increase rapidly; Scenario 2 Model of expenditure previously planned in our 2015 AMP; The Repex model benchmarks expenditure forecasts against other Electricity Distribution Businesses.
153 Scenario 3 Is a slight risk reduction over our 2015 plan. However this outcome can be achieved with less renewal expenditure through the further optimisation and prioritisation of critical assets; and Scenario 4 is included for completeness and the relative risk profile of the hypothetical maximum renewal expenditure. It seeks to illustrate that even with maximum expenditure not all risks can be eliminated. ASSET RENEWAL SCENARIOS SCENARIO 1 - Do Nothing SCENARIO 3 - Proposed Strategy SCENARIO AMP SCENARIO 4 - Max Investment -Min Risks R I S S K Figure Asset Renewal Scenario Risk Profiles Our renewal programme is based on scenario 3 as it maintains a stable level of risk over the AMP period as our renewal expenditure will be optimised by prioritising highest risk assets ASSUMPTIONS AND INPUTS There are a range of assumptions and inputs necessary for establishing our renewal plan and CBRM models. These are described below. ASSET HEALTH AND CONDITION INFORMATION The accuracy of asset age and condition is critical to determining when an asset is due for renewal. For this reason improved specifications for condition assessment, field data verification and the mobility solution to improve data accuracy has been implemented in our inspection programs. ASSET MONITORING Diagnostic measurement techniques such as ultrasonic surveys on overhead lines, PD acoustic surveys on switchgear, and SFRA on zone transformers provide better asset condition information than simple visual inspections. These techniques help eliminate failures proactively through early intervention programmes and can be used to defer premature asset renewal. DESIGN LIFE ASSUMPTIONS The expected design lives of assets are based on manufacturers guidance and our own practical experience managing the assets. 153
154 8.4 ASSET LIFE CYCLE MANAGEMENT This section describes how we manage our assets over their full lifecycle. For each asset category we have: Identified the routine and corrective maintenance tasks; Described the inspection policy and programme employed; Identified any systemic problems and described our approach to addressing these problems; Identified the replacement programme and drivers; Described the innovations we have made to defer asset replacements; and Listed the projects underway or planned. The remainder of this section is structured by the following asset categories with details of included assets and expenditure summaries. Subtransmission Lines (8.4.1 to 8.4.4) Zone Substations (8.4.5 to 8.4.8) Distribution and LV Lines (8.4.9 to ) Distribution and LV Cables ( to ) Distribution Substations and Transformers ( to ) Distribution Switchgear ( to ) Other System Fixed Assets ( to ) SUBTRANSMISSION LINES RISKS AND ISSUES The principal risks and issues associated with subtransmission lines are: Cars colliding with poles can result in outages and public safety risk from falling poles or uncontrolled live conductors; Insulator failures or tree debris blown onto the lines during high wind or storm events; External influences such as possums or birds causing flashovers; and Insulator type issues on our urban meshed network. MAINTENANCE UNDERTAKEN Inspections on subtransmission lines include: Detailed inspections every six months for critical feeders not meshed with other lines; Detailed inspections every five years for all other lines; and Visual inspections on an annual basis. During detailed inspections, tests are carried out on all earth banks. Recently ultrasonic surveys using a multi-functional PD instrument have also been undertaken. Thermo graphic surveys are carried out on selected critical subtransmission feeders. Other diagnostic measurement techniques such as Corona surveys are currently being evaluated. Maintenance tasks are undertaken to correct any defects identified. ASSET RENEWAL PROGRAMME No renewal of these assets is planned during the AMP period as they are well within their life expectancy and have an acceptable risk profile, based on their condition. 154
155 8.4.2 SUBTRANSMISSION CABLES RISKS AND ISSUES The principal risks and issues associated with subtransmission cables arise from: Mechanical damage due to third party excavations or directional drilling; and Cable joint failures. MAINTENANCE UNDERTAKEN Subtransmission cable maintenance is based on results from partial discharge testing as visual inspections are not possible for underground assets. Testing is carried out: Annually for selected critical circuits; and More frequently where critical levels of discharges are identified. Analysis has been undertaken to determine suspected cable joints which may have similar failure modes. These feeders have been prioritised for on-line partial discharge testing and further monitoring. Joints identified as defective following testing are replaced. ASSET RENEWAL PROGRAM No renewal of subtransmission cables is planned during the AMP period SUBTRANSMISSION CIRCUIT BREAKERS (CBS) RISKS AND ISSUES There have been no significant issues identified with our subtransmission CBs. MAINTENANCE UNDERTAKEN CBs are inspected and tested every three years. Tests undertaken include PD tests and dynamic tests such as the first-trip test using a CB profile analyser. The level of servicing is increased where multiple trips have occurred. Major servicing is also undertaken every six years. Servicing includes changing the insulating oil in oil filled CBs, testing for turbulator erosion, trip-timing tests, trip circuit integrity checks, close circuit integrity checks, SCADA alarm and control checks and testing of all functional parts (both electrical and mechanical) to ensure they meet the manufacturer s minimum requirements and recommended industry minimum acceptance criteria. ASSET RENEWAL PROGRAMME CBs scheduled for renewal due to the age and condition include those at; Alexandra St (2017), Claudelands (2018), Ngaruawahia (2019), Massey St (2021), Gordonton (2023) and Te Uku(2024). Renewing CBs involves considerable resource and outages on the network. Therefore where possible other co-located asset renewals are co-ordinated at the same time. This includes protection, battery and SCADA systems. A CBRM model has been implemented to assist in renewal prioritisation and forecasting the required level of investment for subtransmission CBs. 155
156 8.4.4 SUMMARY OF SUBTRANSMISSION RENEWAL AND MAINTENANCE EXPENDITURE Table summarises the Subtransmission expenditure for the AMP period. SUBTRANSMISSION EXPENDITURE ($000) Capital Expenditure 33kV Circuit Breaker kv Overhead Lines kV Subtransmission cable Capital Expenditure Total Operational Expenditure kV Circuit Breaker kv Overhead Lines kV Subtransmission cable Operational Expenditure Total Table Subtransmission Expenditure Capital renewal expenditure for subtransmission cables in the above table is a provision for cable replacement following issues identified as part of other maintenance activities. Operational expenditure in this area has increased mainly due to a review of the budget allocation for unplanned corrective work required in the subtransmission area and the implementation of the partial discharge testing program for 33kV cables and ultrasonic testing of pole top equipment ZONE SUBSTATION POWER TRANSFORMERS RISKS AND ISSUES The principal risks and issues associated with power transformers are: Debris on external or exposed bushings increase flashover risk. Poor insulation or degradation of the paper windings resulting in operational failure of the transformer. The condition of the insulation drives the HI and accordingly the life expectancy of the transformer. Unbunded transformers may result in uncontained oil spills and therefore soil contamination or other environmental damage. Systematic upgrading of transformer bunding has been included in this AMP. Vibration from external factors such as trains. Vibration can cause mal-operation of the mercury switches within the Buchholz relays causing tripping of the incomer CBs. The mercury switches are being progressively replaced with magnetic reed. 156
157 MAINTENANCE UNDERTAKEN Inspections are undertaken every two months. Testing and maintenance is specific to the subcomponent of the power transformer. This includes: Annual dissolved gas analysis and oil tests, these occur more frequently if evidence suggests there may be an issue that needs to be monitored more regularly; Minor maintenance e.g. cleaning, oil checks and visual inspection is carried out every three years; Major maintenance including acoustic partial discharge and dissipation factor analysis is undertaken with minor maintenance and servicing at six yearly intervals; and Tap changer maintenance is undertaken every three years. Zone transformers also undergo mid-life refurbishment. This work involves removing (de-tanking) the core, an internal inspection, dry out, testing and repairs as required. The remaining life is assessed at this time and we expect well maintained transformers with mid-life refurbishment will have a life exceeding 60 years. Table below summarises transformer maintenance plans and their corresponding frequencies. FREQUENCY MAINTENANCE OIL-OLTC 11 VACUUM-OLTC 2 Months Inspection X X Yearly Annual DGA X X 3 Yearly Transformer Minor X X 6 Yearly Transformer Major X X 3 Yearly X 6 Yearly OLTC 12 Servicing X Table Summary of Power Transformer Maintenance ASSET RENEWAL PROGRAMME No zone transformers will exceed their nominal lives within the AMP period. Transformer CBRM models were developed during 2016 and will be used to further analyse the risks and asset renewal requirements ZONE SUBSTATION SWITCHBOARDS We have AIS and GIS switchboards on our network. RISKS AND ISSUES The principal risks and issues for zone substation switchboards are: Fault flashover causing injury to staff and equipment damage; Surface discharges on voltage transformer compartments and vacuum bottles on older AIS switchboards. The cause is believed to be high humidity within the substations during winter. Expenditure to install suitable air-conditioning units in substations has been included during the AMP period; Mechanical misalignment of movable parts and damaged interlocks on AIS switchboards; A lack of spare parts for older equipment. A recent failure required the acquisition of a replacement Circuit Breaker (CB) from overseas; Incompatible designs on newer switchboards. Although similar types of switchboards are used, legacy CB units can be incompatible causing a lack of compatible spares. Design has subsequently been standardised; and On-Load Tap Changer 157
158 Operational handling and testing of SF 6 gas in GIS switchboards. Staff have been trained and testing equipment purchased to reduce our reliance on external service providers for this critical task. MAINTENANCE UNDERTAKEN Visual inspections on switchboards are undertaken every two months. Annual partial discharge and surveys are conducted on indoor switchboards. The following items are checked as part of the survey: CT/VT chambers; Cable terminations in the switchgear; Cable end boxes and cable sealing ends; and Outdoor switchyard connections e.g. insulators, busbars. Major maintenance is carried out on AIS equipment every nine years, and every 12 years on GIS equipment. Main tasks include: Bus maintenance for AIS e.g. general cleaning; Insulation resistance tests on the main busbar and connected VTs; Contact resistance tests on the main busbar; and Gas pressure checks and HV withstand tests on GIS. ASSET RENEWAL PROGRAMME Renewal of indoor switchboards is generally undertaken in conjunction with CB replacements. A CBRM model has been implemented to assist in replacement prioritisation and forecasting the required level of investment in switchboards ZONE SUBSTATION BUILDINGS The zone substation buildings category also includes subtransmission switching stations, indoor and outdoor transformer bays and earthing systems. RISKS AND ISSUES The principal risks and issues associated with zone substation buildings include: Physical and environmental risks such as fires and oil spills. Substations with outdoor switchyards have higher physical and environmental risk than indoor switch rooms; Vandalism and graffiti; Theft of copper earth wire is a significant safety and cost issue; Humidity and high temperatures causing damage to electronic devices and switchboards; Water causing damage to control cables at our older sites. Our newer sites are installed with sump pumps which remove water accumulated in trenches and basements; and Records of earth test results and earthing design are lacking on some of our older sites and it is therefore difficult to confirm the integrity of the earthing system on those sites. A programme to assess these sites has been implemented. MAINTENANCE UNDERTAKEN Grass cutting, pest control and general cleaning of substation buildings is conducted monthly. Substation buildings are inspected every two months. Tasks include inspection of soil erosion surrounding the building, visual cracks, paintwork, building condition and transformer bunding. Site specific safety risks and defects are recorded in the hazard identification and defect notification systems. 158
159 Electrical compliance checks, testing and inspection of LV installations are carried out annually. Every three years earthing systems are tested. ASSET RENEWAL PROGRAMME No zone substations are scheduled for renewal in the AMP period. The renewal programme for zone substations equipment includes the continuation of the security system upgrade project to deter copper conductor theft. Zone substations located in rural areas with outdoor switchyards have been prioritised SUMMARY OF ZONE SUBSTATION RENEWAL AND MAINTENANCE EXPENDITURE Table summarises Zone Substation expenditure for the AMP period. ZONE SUBSTATION EXPENDITURE ($000) Capital Expenditure 11kV Switching Station/ Zone Sub Alexandra Street Station Replacement Gordonton Zone transformer Replacement Zone Substation Transformer Capital Expenditure Total Operational Expenditure 11kV Switching Station/ Zone Sub Zone Substation Transformer Operational Expenditure Total Table Zone Substation Expenditure The capital renewal expenditure for each asset class in the above table is based on the results of the CBRM modelling and resulting Health Index (HI) and Risk profiles for: Replacement of 11kV switchgear in Alexandra switching station in 2017; 11kV switchboard replacement in Claudelands substation in 2018; Battery charger and battery bank replacements over the planning period; and Lawn replacements with stone chip for outdoor substation switchyards. 159
160 8.4.9 DISTRIBUTION AND LV POLES RISKS AND ISSUES The principal risks and issues associated with poles are: Falling poles pose a staff and public safety risk or can cause damage to property. The risk of failure is greatest with the remaining hardwood poles; and Third party damage to poles e.g. car vs pole. The most common failure modes for distribution and LV poles are: Rotten bases and splitting on the heads for wooden poles; and Spalding of concrete in concrete poles. MAINTENANCE UNDERTAKEN Inspections are undertaken every five years. Gamma ray imaging is used to determine the condition of the base of wooden poles. This measures wood density and remaining pole strength. Poles are classified and assigned a renewal date based on results from the imaging. Maintenance of poles includes the repair of possum guards. ASSET RENEWAL PROGRAMME Informed by a CBRM model, between 70 and 80 poles are planned to be replaced annually over the next 10 years DISTRIBUTION AND LV CROSSARMS RISKS AND ISSUES The principal risks and issues associated with crossarms are insulator failure due to pin corrosion or wood rot around the insulator pin hole. Insulator failure can cause wooden crossarms to burn or break causing the conductor to fall to the ground resulting in a public safety hazard and poor network performance. MAINTENANCE UNDERTAKEN Visual inspections of crossarms are undertaken every five years coinciding with pole and conductor inspections. As faulty insulators are difficult to detect by visual inspection, new ultrasonic diagnostic testing is being introduced as part of the inspection process. This technology has proved reliable in detecting early signs of insulator cracking or high levels of partial discharge. ASSET RENEWAL PROGRAMME Informed by a CBRM model, approximately 1,000 crossarms per year will be replaced in the first two years of the plan, increasing to 1,500 per year. This expenditure is another key component of our rural reliability improvement strategy as indicated in section DISTRIBUTION AND LV CONDUCTORS RISKS AND ISSUES The principal risks and issues associated with conductors are: Public safety and property damage from live lines falling to the ground; Our 16mm 2 copper conductor fleet is failing earlier than expected because of damaged strands from conductors clashing as a result of high wind, bird contact or tree debris predominately in rural areas. This has contributed to poor network performance; and 160
161 Due to higher safety risks associated with 16mm 2 copper conductors prone to breaking while being handled we have ceased live line work on these conductors. This will result in a greater number of planned outages to renew this conductor during the AMP period than included in our previous plans. MAINTENANCE UNDERTAKEN Inspections for distribution and LV conductors are undertaken as follows: Thermal imaging and ultrasonic testing is completed annually on critical sections of distribution conductors; The only inspections undertaken on the remaining distribution and all LV conductors are visual inspections every five years; More detailed inspections and condition data capture is conducted every five years; and Thermal imaging is also used after major faults to check conductor and joint integrity. Corona discharge inspection is used to check feeders with incidences of insulator failure. It is not practical to proactively service Distribution and LV conductors but failures are reactively repaired. ASSET RENEWAL PROGRAMME The CBRM-based programme for the AMP period includes targeted renewal of the Weavers, Silverdale, Wallace, Finlayson, Gordonton, Raglan, Te Uku and Te Kauwhata feeders. This expenditure is another key component of our rural reliability improvement strategy as indicated in section
162 SUMMARY OF DISTRIBUTION AND LV LINE RENEWAL AND MAINTENANCE EXPENDITURE Table summarises Distribution and LV Lines expenditure for the AMP period. DISTRIBUTION AND LV LINES EXPENDITURE ($000) Capital Expenditure Crossarms and Insulators 2,582 2,582 3,392 3,392 3,392 3,392 3,392 3,392 3,287 3,287 Distribution Lines 3,297 2,647 3,627 3,627 3,527 3,627 3,627 3,627 3,627 3,627 LV Lines Medium mixed Projects Poles Capital Expenditure Total Operational Expenditure Crossarms and Insulators 7,246 6,490 8,180 7,980 7,880 7,980 7,980 7,980 7,875 7, Distribution Lines LV Lines Poles Operational Expenditure Total 632 1,124 1,138 1, ,108 1,021 1,202 1,248 1,244 Table Distribution and LV Line Expenditure The capital renewal expenditure for each asset class in the above table is based on the results of the CBRM modelling and resulting Health Index (HI) and Risk profiles as discussed in Chapter 3. For:- Crossarms and Insulators modelling shows an increasing rate of failures over the planning period and therefore to reduce this risk an increasing investment strategy has been adopted. Replacements are prioritised on highest risk items combined into geographical areas for delivery efficiency. Distribution and 11kV OH Lines has a significant renewal expenditure over the planning period. It was clear that previous renewal investment strategies would result in increasing failure rates and consequential health and safety risks. The main area of concern being the failure of the 16mm 2 copper conductor. The above investment strategy would ensure the current risk value for this asset class will not increase. 162
163 DISTRIBUTION CABLES RISKS AND ISSUES The principal risks and issues associated with distribution cables are damage caused by excavations or directional drilling. Network outages can be extensive while cable jointing repair work is undertaken. MAINTENANCE UNDERTAKEN No routine maintenance is undertaken on distribution cables. However, a number of critical trunk feeder circuits have been identified for Partial Discharge (PD) testing. When failures have occurred samples of cable sections are retrieved to assess the internal condition of the cable. ASSET RENEWAL PROGRAMME No renewal is planned during the AMP period, however an allowance has been made to replace sections of cable following a fault LV CABLES RISKS AND ISSUES The principal risks and issues for LV cables are cable failure caused by third party excavations or directional drilling and water ingress causing breach joints to fail. MAINTENANCE UNDERTAKEN Due to their inaccessibility there is no routine maintenance performed on LV cables. ASSET RENEWAL PROGRAMME There is no renewal programme for LV cables. Where cables are replaced this occurs as part of other projects such as upgrades or further LV reticulation development. However an allowance has been made to replace sections of cable following a fault. 163
164 SUMMARY OF DISTRIBUTION AND LV CABLES RENEWAL AND MAINTENANCE EXPENDITURE Table summarises Distribution and LV cables expenditure for the AMP period. DISTRIBUTION AND LV CABLES EXPENDITURE ($000) Capital Expenditure Distribution Cables LV Cables Capital Expenditure Total Operational Expenditure Distribution Cables LV Cables Operational Expenditure Total Table Distribution and LV Cables Expenditure Capital renewal expenditure for distribution and LV cables in the above table is a provision for cable replacement following issues identified as part of other maintenance activities DISTRIBUTION SUBSTATIONS AND TRANSFORMERS RISKS AND ISSUES The principal risks and issues associated with distribution substations and transformers are: Insulator cracks; Poor conductor connections; and External factors such as lightning strikes, birds, possums, and vegetation. We have not identified any systemic problems with any particular manufacturer or model of transformer. Copper theft from our distribution substations and transformers is a serious public safety issue and is costly to identify and replace. Incidences are identified from staff and public reporting and during the network inspection program. We have implemented a security system upgrade across all our substation sites. Our rural sites with outdoor switchyards have been prioritised for this work. MAINTENANCE UNDERTAKEN Our pole mounted and pad mounted transformers are inspected every five years. Maintenance and testing includes: Testing of earth banks; Security checks; External panel deterioration or damage; Vegetation control; 164
165 Cleaning of HV and LV cubicles; and Thermal imaging of connections and busbars. For larger ground based CBD and industrial distribution transformers the maintenance programme includes: Downloading of maximum demand data annually, timed to occur at peak load times; Annual inspection; Thermal imaging inspections of all links, bus bars and connections; Maintenance checks on tank and cubicles; Cleaning equipment and building internal areas; and Oil tests conducted on a condition basis for transformers 750kVA and above. Transformers may be refurbished after being replaced by larger transformers due to growth and prior to being redeployed back into the network. An economic model has been developed to determine if a transformer should be scrapped or refurbished. Data loggers are fitted to all new ground mounted transformers 300kVA and over. Loggers record three phase voltage, transformer temperature, three phase transformer currents and one phase of the outgoing circuit current. This data enables more accurate evaluation of transformer loading over time. It is envisaged that data loggers will be replaced by smart meters in the future. A project to retrofit existing transformers has been implemented with the corresponding expenditure included in our forecasts. ASSET RENEWAL PROGRAMME Renewal of distribution transformers only occurs on failure. A programme of works has been included to renew these as failures occur. A CBRM model has been implemented to assist in renewal prioritisation and level of investment for distribution substations and transformers SUMMARY OF DISTRIBUTION SUBSTATIONS AND TRANSFORMERS RENEWAL AND MAINTENANCE EXPENDITURE Table summarises Distribution Substation and Transformer expenditure for the AMP period. DISTRIBUTION SUBSTATIONS AND TRANSFORMERS EXPENDITURE ($000) Capital Expenditure Distribution Transformers (11kV/400V) Capital Expenditure Total Operational Expenditure Distribution Transformers (11kV/400V) Operational Expenditure Total ,308 1, ,308 1, Table Distribution Substations and Transformers Expenditure 165
166 The capital renewal expenditure for distribution transformers in the above table is based on the results of the CBRM modelling and resulting Health Index (HI) and Risk profiles as discussed in Chapter DISTRIBUTION SWITCHGEAR RISKS AND ISSUES Distribution switchgear includes RMUs, ABSs, CBs, reclosers, sectionalisers, and distribution overhead line fuse units. The principal risks and issues associated with distribution switchgear are: RMUs: The possibility of SF 6 gas leakage from GIS units. High levels of partial discharges and mechanical interlock failures have been observed on the older oil-filled RMUs; ABS: Older, manually operated ABSs are a safety risk to the operator during switching. The most common failure for ABS is the main contacts being stuck in either an opened or closed position; CBs: There have been no major issues with our distribution CBs; Reclosers and Sectionalisers: Problems have been experienced with electronic drop out sectionalisers that have been installed over recent years. These units have not operated reliably, increasing fault restoration times; and Distribution Overhead Line Fuses: Failure due to the deterioration of the fuse element normally occurs from age and weather conditions. MAINTENANCE UNDERTAKEN Maintenance and testing is undertaken on switchgear as follows. RMUs RMUs are inspected and tested every three years. Inspection and testing consists of visual inspections, earth testing, vegetation control, oil level, SF 6 gas pressure and through-fault indicator checks. During inspections checks are also made on the operating handles, earth conductor, tank condition, pitch box leaks, panel steelwork, labels, and warning signs. This work is undertaken in association with distribution transformer inspections. RMUs with busbar extension units also include partial discharge testing and visual inspection of busbar boxes. Oil type RMUs are also subject to major maintenance every 12 years. ABSs Inspections are undertaken every five years and include visual inspections of insulators, arc horns/chutes, contacts and handles. Earth testing is undertaken at the same time. CBs CBs are inspected and tested every three years. Tests undertaken include PD tests, and dynamic tests such as the first-trip test using a CB profile analyser. Tests are also undertaken during servicing. The level of servicing is increased where multiple trips have occurred. Major servicing is undertaken every six years. Servicing includes changing the insulating oil in oil filled circuit breakers, trip-timing tests, trip circuit integrity checks, close circuit integrity checks, SCADA alarm and control checks and testing of all functional parts (both electrical and mechanical) to ensure they meet the manufacturer s minimum requirements and recommended industry minimum acceptance criteria. Reclosers, Sectionalisers and HV Overhead Line Fuses Inspection and maintenance is undertaken every five years. This includes visual inspection, reporting on condition of insulators, handles, earth conductor rating and steelwork, operational verification of line recloser, SCADA and communications signalling, earth test, thermal vision, ultrasound tests and reporting of results. For older oil filled type models, removal of the recloser from service is required for workshopbased maintenance and testing. 166
167 ASSET RENEWAL PROGRAMME The renewal programme for distribution switchgear is as follows: RMUs: Targeted renewal of oil filled RMUs with SF 6 is included within the AMP period; ABSs: approximately 25 units each year, prioritised by risk, are planned to be renewed. In addition, a programme has been implemented to replace manually operated ABSs with SF 6 gas-insulated switches over the AMP period. Vacuum switch units will also be considered due to environmental risk posed by possible SF 6 leaks. Many ABSs associated with 2 pole transformer structures are being removed completely and in other situations cable end switches are being replaced with solid isolating links; CBs: The CBs that exceed their life expectancy in the AMP period will be renewed. These are Alexandra St (2017), Claudelands (2018), Ngaruawahia (2019), Massey St (2021), Gordonton (2023) and Te Uku(2024). Replacing CBs involves considerable resource and outages on the network. Therefore where possible other asset renewals are co-ordinated at the same time. This includes protection upgrades, battery and SCADA systems; Reclosers and Sectionalisers: A small number of older oil-filled hydraulic reclosers will be systematically renewed based on our CBRM assessment. They will be replaced with new electronic controlled units over the AMP period. In addition, a number of sectionalisers installed during recent years have not worked as expected, increasing the risk to the network. These will be proactively replaced over the first two years in the AMP period; and HV Overhead Line Fuses: Renewal of these assets is primarily driven by the need to renew other larger components, primarily crossarms SUMMARY OF DISTRIBUTION SWITCHGEAR RENEWAL AND MAINTENANCE EXPENDITURE Table summarises Distribution Switchgear expenditure for the AMP period. DISTRIBUTION SWITCHGEAR EXPENDITURE ($000) Capital Expenditure 11kV Air Break Switch kV Circuit Breaker kV Reclosers and Sectionalisers kV Ring Main Unit Capital Expenditure Total Operational Expenditure 11kV Air Break Switch 1,684 1,366 1,512 1,512 1,670 1,445 1,400 1,456 1,388 1, kV Circuit Breaker kV Reclosers and Sectionalisers kV Ring Main Unit Operational Expenditure Total Table Distribution Switchgear Expenditure 167
168 The capital renewal expenditure for each asset class in the above table is based on the results of the CBRM modelling and resulting Health Index (HI) and Risk profiles as discussed in Chapter 3 and detailed in section above SERVICE AND DISTRIBUTION PILLARS RISKS AND ISSUES The principal risks and issues for Service and Distribution Pillars are: Damaged LV pillars may pose a risk to public safety; and Fibreglass type pillars are fragile and prone to damage. LV pillars are part of the LV underground network and have been identified as having the highest public safety risk among our asset classes. This is due to the higher accessibility to the public. Safety risks include the probability of electrocution following damage to the unit and live parts being exposed to public contact. Minor issues involve vegetation build up around the pillar, obsolete types of pillars and location installed e.g. inside a private property. MAINTENANCE UNDERTAKEN LV pillars are inspected every three years. Inspections determine the physical condition, accessibility, vegetation and location. Maintenance on LV pillars includes lid repairs or renewal. ASSET RENEWAL PROGRAMME LV Pillars will be renewed based on their type, age and condition with priority given to fibreglass type pillars. Service and Distribution Pillar CBRM models were developed during 2016 and will be used to further analyse the risks and asset renewal requirements PROTECTION RELAYS RISKS AND ISSUES The principal risks and issues associated with protection relays are: A lack of spares; The significant cost of maintenance; A lack of more complex protection functionality in older electromechanical relays; and The inability to test electromechanical relays. MAINTENANCE UNDERTAKEN Inspections are undertaken every three years. Tests undertaken during inspections are dependent on the type of relay: For line differential relays using copper pilots three yearly tests include primary injection testing, pilot resistance checks, and insulation checks; Arc flash schemes, that require access to the light sensors in the switchgear, are maintained at nine yearly intervals to coincide with bus maintenance; and For all other relays, maintenance is undertaken on a three year interval to coincide with circuit breaker CB maintenance. 168
169 Modular Substation We have set up a modular substation to expand our in-house knowledge and skills in protection and communications technology. This includes real-time simulation using similar equipment and devices found in our substations and integration with our NMS. The installed devices can be used as spares in an emergency. ASSET RENEWAL PROGRAMME Our renewal programme for protection relays over the AMP period includes: Replacement of electromechanical relays with modern numerical relays. This work will typically be undertaken in conjunction with other upgrade work at the zone substation or switching station. Priority will be on the CBD area where a substantial number of electromechanical relays operate on critical zone substation feeders; and Replacement of Solkor pilot wire protection on 11kV trunk feeders with numerical line differential relays. Fibre and patch panels will be installed on these sites to cater for new differential communication requirements. In consideration of the complex nature of the works, an integrated renewal programme has been developed that will ensure timely integration of protection, SCADA/communications and switchgear renewals. This is reflected in the proposed 10-year spend profile. A CBRM model for relays has been developed during 2016 and will be used to further analyse the risks and asset renewal requirements SCADA AND COMMUNICATION DEVICES RISKS AND ISSUES The principal risks and issues associated with our SCADA and communication devices are primarily related to weak signals. Weak signals can be caused by incorrect positioning of antenna, vegetation interference, failed RTUs and batteries, the degradation of pilot communication cables and the incompatibility of certain components. MAINTENANCE UNDERTAKEN SCADA and communications devices are inspected every four months. The tests and maintenance conducted on all remote station equipment include: Visual inspections, dusting, cleaning and minor repairs; Operational checks and measurements; Testing, calibration checks, and adjustments; Meter reading and downloading of data; Checking and reporting status indications and software error logs; and Maintenance of databases related to the location, maintenance history and status of equipment and completing test sheets and reports. Additional comprehensive SCADA point-to-point indication testing is also undertaken in conjunction with CB and protection testing to minimise outage windows. Protection interface integrity is tested through insulation resistance testing on pilot cables and loop-back checks on fibre cables. ASSET RENEWAL PROGRAMME The Conitel Protocol RTUs are scheduled for replacement with DNP-IP RTUs over the next five years. 169
170 LOAD CONTROL EQUIPMENT RISKS AND ISSUES The principal risks and issues associated with our load control injection equipment are: long lead-times on replacement parts and compatibility issues with the SFU-G type ripple control converter. MAINTENANCE UNDERTAKEN The load control injection equipment is inspected twice a year. Inspections involve plant testing, visual checks and signal strength tests. Additionally each year the static plants undergo a condition assessment and maintenance by the supplier. ASSET RENEWAL PROGRAMME Renewal of the SFU-G type control converters has been incorporated into the plan. The load control injection plant will not be renewed as this technology has been superseded by smart metering technology BATTERY AND CHARGER SYSTEMS RISKS AND ISSUES The principal risks and issues associated with our battery and charger systems are: loss of control of primary equipment when battery or charger systems fail and environmental factors such as high humidity and high temperature that can reduce life expectancy. MAINTENANCE UNDERTAKEN Due to their criticality, battery and charging systems are inspected bi-monthly. Tests carried out during these inspections include impedance tests, alarm tests, float voltage and condition. Additionally, discharge tests are carried out every two years on all zone substation and switching station battery banks to ensure that battery performance is up to standard. Other than testing, no other maintenance is undertaken on batteries and charger systems. Faulty systems are renewed. ASSET RENEWAL PROGRAMME Distribution equipment batteries are renewed when they fail discharge and impedance tests. During the AMP period we will renew old or poor condition battery bank and power supplies. Where appropriate, some units will be replaced with dual battery banks and power supplies with higher capacities to provide greater reliability. A standardised design is now utilised for these systems. CBRM models have been developed for battery and charger systems in It is expected that the outcomes of the risk analysis will enable further mitigation of risks in this asset category SUMMARY OF OTHER SYSTEM FIXED ASSET RENEWAL AND MAINTENANCE EXPENDITURE Table summarises Other System Fixed Assets expenditure for the AMP period. 170
171 OTHER SYSTEM FIXED ASSETS EXPENDITURE ($000) Capital Expenditure Protection Relays SCADA & Comms Service and Distribution Pillars Capital Expenditure Total Operational Expenditure , , Other Protection Relays SCADA & Comms Service and Distribution Pillars Operational Expenditure Total ,034 1,127 1,099 1,127 1,088 1,204 1,134 1,211 1,229 1,227 Table Other System Fixed Asset Expenditure The capital renewal expenditure for each asset class in the above table is based on the results of the CBRM modelling and resulting Health Index (HI) and Risk profiles as discussed in Chapter 3 and as detailed in the previous sections. 8.5 OVERALL EXPENDITURE SUMMARY PROPOSED 10-YEAR MAINTENANCE EXPENDITURE The 10 year maintenance expenditure forecast increases slightly in the first few years with a lower level of maintenance expenditure in the later periods as shown in Figure The increase in the first few years is mainly due to:- Voltage investigation and corrective works required following smart meter data analysis; Field data verification and accelerated inspections to improve the accuracy of asset condition data; Increased diagnostic testing resulting in a slight increase in preventive maintenance costs across the AMP period; and Proactive repairs on WEL s LV network. The decrease in the later expenditure years is mainly due to: Implementation of new technology e.g. diagnostic measurements and mobility solutions resulting in more efficient maintenance delivery and result in slightly decreased operational costs across the AMP period; Better asset data and condition information that will assist in maintenance prioritisation is expected to reduce maintenance costs and reduce corrective works in the latter part of the AMP period; 171
172 Vegetation expenditure is based on our tree growth model. It predicts that fewer sites will require vegetation to be cut towards the end of the AMP period; and Reactive fault repair costs are expected to decrease over the planning period due to work plan efficiency initiatives. 10 YEAR MAINTENANCE, VEGETATION AND FAULTS EXPENDITURE Vegetation Service interruptions and emergencies Maintenance 9,000 8,000 7,000 6,000 $000 5,000 4,000 3,000 2,000 1, Figure Maintenance, Vegetation and Faults Expenditure Profile PROPOSED 10-YEAR RENEWAL EXPENDITURE The 10 year renewal expenditure forecast is predominately driven by the CBRM models for most of the asset categories. The major variances over the planning period as shown in Figure are due to: Distribution Switchgear an increase in 2017, 2019 and 2021 for circuit breaker replacements; Distribution Substations and Transformers decreasing spend from 2019 onwards in transformer replacements due to CBRM modelling results; and Distribution and LV Lines an increasing spend mainly due to our 16mm 2 copper conductor replacement programme. 10 YEAR RENEWAL EXPENDITURE $000 14,000 12,000 10,000 8,000 6,000 4,000 2, Other system fixed assets Distribution switchgear Distribution Substations and transformers Distribution and LV cables Distribution and LV lines Zone Substations Subtransmission Figure Renewal Expenditure Profile 172

173 9. SUMMARY OF EXPENDITURE FORECASTS 173
174 9. SUMMARY OF EXPENDITURE FORECASTS This chapter provides a summary of the expenditure forecasts presented and discussed in previous chapters. It provides an overview of our expenditure in a number of categories over the AMP period. The chapter is structured as follows. Introduction (9.1) describes the financial assumptions used to determine the expenditure forecasts; Capital Expenditure (9.2) provides an overview of total capital expenditure during the AMP period as described in Chapters 7 and 8; and Operational Expenditure (9.3) provides an overview of total operational expenditure during the AMP period as described in Chapter 8. Unless otherwise stated, figures in this chapter are on a nominal basis (i.e. include an allowance for expected price inflation). 9.1 INTRODUCTION This section describes the inputs and assumptions used to forecast our capital and operational expenditure INTERPRETING THE FORECASTS The forecasts presented in this chapter are a summary of the expenditure described in previous sections. They are presented here to provide a consolidated view of our expenditure across our business. The expenditure profiles cover the 10 year period of the AMP, 1 April 2016 to 31 March As explained previously, the notation adopted in each table refers to financial year-end. For example, the 1 April 2016 to 31 March 2017 financial year is referred to as The forecasts are also presented in nominal dollars. This means an allowance has been made for expected price inflation FORECAST INPUTS AND ASSUMPTIONS Our forecasts rely on a number of inputs and assumptions. These include: Capital contributions; Cost of financing (FDC); Inflation; and Managing forecast uncertainty. CAPITAL CONTRIBUTIONS The customer works expenditure shown are the gross amounts i.e. capital contributions have not been netted out from the forecast. COST OF FINANCING (FDC) The cost of financing has been included in accordance with 2.2 (11) of the Electricity Distribution Services Input Methodologies Determination
175 INFLATION The forecasts, unless stated otherwise, are shown in nominal terms. In this case it means we have adjusted our estimates to account for expected cost inflation. There are two main cost components to the delivery of our operations, maintenance, renewal and capital development expenditures. These are labour and materials. The per annum inflation adjustments used for each are: Labour we have assumed 2% throughout the AMP period; and Materials we have assumed 2.5% throughout the AMP period Each expenditure category is impacted according to the composition or proportion of labour and materials required to deliver the service or asset. The table below shows the composition and resulting inflation factor used in each case. PROPORTION OF LABOUR IN TOTAL COST PROPORTION OF MATERIALS IN TOTAL COST WEIGHTED INFLATION ASSUMPTION APPLIED Operations 100% 0% 2.00% Maintenance 90% 10% 2.05% Renewals 50% 50% 2.25% Capital Development 50% 50% 2.25% Table Inflation adjustment for each expenditure category While the assumed inflation rates provide a general trend for future labour rates and material costs, there is always an inherent level of uncertainty in such aspects. By way of example, market conditions and pricing can change with relative supply and demand pressures. For the purposes of this AMP, we have assumed the change in labour and material is limited to the assumed inflationary pressures rather than modelling specific trends in network components or specific trades in the labour market. 9.2 CAPITAL EXPENDITURE This section provides an overall summary of the forecast capital expenditure by category CAPITAL EXPENDITURE SUMMARY The expenditure is shown in two formats. The first is a breakdown according to the network level and asset classes as described in Chapters 7 and 8 and then secondly according to the regulatory categories specified by the Commerce Commission. Forecast capital expenditure is further broken down into network development, renewals and non-network capital expenditure in sections to
176 Table shows a summary of capital expenditure over the period by development plan and by asset class. CAPITAL EXPENDITURE ($000) GXP Urban Sub transmission ,497 3, Zone Substations 1,471 1, ,657 2, Distribution and LV lines Distribution and LV cables Distribution Substations and transformers ,065 1,089 1,672 3,424 3,515 1, , Distribution switchgear Other system fixed assets 1,669 2,266 1,581 1,765 1,664 1,130 1,083 1,108 1, Other Assets Customer 13,233 12,713 11,112 10,666 10,748 10,990 11,237 11,490 11,749 12,013 Urban Total 18,750 17,776 15,621 14,794 16,158 17,549 17,818 19,278 20,711 16,720 Rural Sub transmission Zone Substations ,179 1,806 2, ,140 Distribution and LV lines 6,477 7,517 9,503 9,520 9,623 9,953 10,177 10,406 10,512 10,749 Distribution and LV cables Distribution Substations and transformers 2,336 2,892 2,318 2,440 2,461 2,428 2,531 2,624 2,705 2,706 Distribution switchgear 1,368 1,065 1,092 1,117 1,192 1,146 1,157 1,202 1,206 1,214 Other system fixed assets Other Assets Rural Total 11,311 12,203 14,226 16,782 15,701 16,350 14,465 14,785 15,005 17,352 Total Network Capital Expenditure Non-network Capital Expenditure 30,061 29,979 29,847 31,576 31,859 33,900 32,283 34,063 35,716 34,072 3,890 4,196 2,036 3,045 2,632 2,174 3,654 3,199 1,980 2,025 Grand Total 33,951 34,175 31,883 34,621 34,491 36,073 35,937 37,262 37,696 36,097 Table Total Capital Expenditure Forecast 176
177 Table shows a summary of capital expenditure over the period according to the Commerce Commission s expenditure categories. CAPITAL EXPENDITURE ($000) Consumer connection ,258 9,539 9,804 9,746 9,630 9,847 10,069 10,295 10,527 10,764 System Growth 935 1,504 2,250 4,773 4,283 5,990 4,207 5,217 6,489 4,418 Asset Replacement and Renewal 13,371 11,885 13,193 13,133 13,846 13,420 13,821 14,235 14,265 14,416 Asset relocations 2,976 3,174 1, ,118 1,143 1,169 1,195 1,222 1,249 Quality of supply 1,278 1,811 1,693 1,801 1,808 1,760 1,849 1,926 1,991 1,976 Legislative and regulatory Other reliability, safety and environment Total Network Capital Expenditure Non-network Capital Expenditure ,172 1,826 1,599 1,093 1,118 1,739 1,169 1,195 1,222 1,249 30,061 29,979 29,847 31,576 31,859 33,900 32,283 34,063 35,716 34,072 3,890 4,196 2,036 3,045 2,632 2,174 3,654 3,199 1,980 2,025 Grand Total 33,951 34,175 31,883 34,621 34,491 36,073 35,937 37,262 37,696 36,097 Table Total Capital Expenditure Forecast NETWORK DEVELOPMENT CAPITAL EXPENDITURE This section provides an overview of network development capital expenditure. As discussed in detail within Chapter 7, localised areas of forecast growth and the need for quality improvements are driving network development expenditure. To illustrate the respective expenditure required for urban and rural development, the expenditure has been split. Note that rural reliability is largely addressed through our renewal programme, as discussed in Chapter 8. Table shows the breakdown of GXP, urban and rural network development capital expenditure by asset class. 177
178 NETWORK DEVELOPMENT CAPITAL EXPENDITURE ($000) GXP Urban Sub transmission ,434 3,600 - Zone Substations ,390 2,264 - Distribution and LV lines Distribution and LV cables Distribution Substations and transformers Distribution switchgear Other system fixed assets ,118 2,857 2, , , , Other Assets Customer 10,258 9,539 9,804 9,746 9,630 9,847 10,069 10,295 10,527 10,764 Urban Total 11,874 11,969 11,889 11,525 12,240 14,206 14,275 15,572 17,077 13,127 R u r a l Sub transmission Zone Substations ,159 1,786 2, ,117 Distribution and LV lines Distribution and LV cables Distribution Substations and transformers Distribution switchgear Other system fixed assets 51 1,046 1,069 1,093 1,118 1,143 1,169 1,195 1,222 1, ,227 1,759 1,640 1,747 1,753 1,703 1,790 1,866 1,930 1, Other Assets R u r a l T o t a l 1,841 2,950 3,457 5,999 4,656 5,131 3,018 3,061 3,152 5,280 G r a n d T o t a l 13,714 14,920 15,346 17,523 16,896 19,337 17,293 18,633 20,229 18,407 Table Total Network Development Capital Expenditure Forecast 178
179 Table shows network development capital expenditure over the period according to the Commerce Commission s expenditure categories. A more detailed breakdown of expenditure within the Commerce Commission s expenditure categories can be found in Tables to NETWORK DEVELOPMENT CAPITAL EXPENDITURE ($000) Consumer connection ,258 9,539 9,804 9,746 9,630 9,847 10,069 10,295 10,527 10,764 System Growth 935 1,504 2,250 4,773 4,283 5,990 4,207 5,217 6,489 4,418 Quality of supply 1,278 1,811 1,693 1,801 1,808 1,760 1,849 1,926 1,991 1,976 Legislative and regulatory Other reliability, safety and environment ,172 1,826 1,599 1,093 1,118 1,739 1,169 1,195 1,222 1,249 Total 13,714 14,920 15,346 17,523 16,896 19,337 17,293 18,633 20,229 18,407 Table Total Network Development Capital Expenditure Forecast CONSUMER CONNECTION Forecast customer connection capital expenditure is summarised in the table below. CONSUMER CONNECTION CAPITAL EXPENDITURE ($000) New Connections <100 amp New Connections >=100 amp ,849 3,778 3,863 3,950 4,039 4,130 4,223 4,318 4,415 4,515 2,781 2,579 2,637 2,697 2,758 2,820 2,883 2,948 3,014 3,082 Subdivisions 3,628 3,181 3,035 2,771 2,834 2,897 2,963 3,029 3,097 3,167 Asset Specific Pricing Customer Driven Jobs Total 10,258 9,539 9,804 9,746 9,630 9,847 10,069 10,295 10,527 10,764 Table Total Customer Connection Expenditure Forecast 179
180 SYSTEM GROWTH Urban and rural system growth capital expenditure by asset class is summarised in the table below. SYSTEM GROWTH CAPITAL EXPENDITURE ($000) GXP Urban Subtransmission ,434 3,600 - Zone Substations ,390 2,264 - Distribution and LV lines Distribution and LV cables Distribution Substations and transformers Distribution switchgear Other system fixed assets , , , , Other Assets Customer ,286 1, Urban Total 935 1,462 1,502 1,724 2,553 3,705 4,148 5,217 6,489 2,301 Rural Subtransmission Zone Substations ,050 1,730 2, ,117 Distribution and LV lines Distribution and LV cables Distribution Substations and transformers Distribution switchgear Other system fixed assets Other Assets Rural Total ,050 1,730 2, ,117 Grand Total 935 1,504 2,250 4,773 4,283 5,990 4,207 5,217 6,489 4,418 Table Total System Growth Capital Expenditure Forecast 180
181 QUALITY OF SUPPLY Quality of supply capital expenditure by activity is summarised in the table below. QUALITY OF SUPPLY CAPITAL EXPENDITURE ($000) Network Upgrades due to DG applications Power Quality - Works required to correct customer complaints Voltage upgrade projects ,549 1,533 1,692 1,697 1,646 1,732 1,807 1,869 1,851 Total 1,278 1,811 1,693 1,801 1,808 1,760 1,849 1,926 1,991 1,976 Table Total Quality of Supply Capital Expenditure Forecast LEGISLATIVE AND REGULATORY Legislative and regulatory capital expenditure by activity is summarised in the table below. LEGISLATIVE AND REGULATORY CAPITAL EXPENDITURE ($000) Seismic upgrades of substations AUFLS scheme changes Total Table Total Legislative and Regulatory Capital Expenditure Forecast 181
182 RELIABILITY, SAFETY AND ENVIRONMENT (RSE) Urban and rural RSE capital expenditure by asset class is summarised in the table below. RSE CAPITAL EXPENDITURE ($000) Urban Subtransmission Zone Substations Distribution and LV lines Distribution and LV cables Distribution Substations and transformers Distribution switchgear Other system fixed assets Other Assets Urban Total Rural Subtransmission Zone Substations Distribution and LV lines Distribution and LV cables Distribution Substations and transformers Distribution switchgear Other system fixed assets 51 1,046 1,069 1,093 1,118 1,143 1,169 1,195 1,222 1, ,227 1,759 1,640 1,747 1,753 1,703 1,790 1,866 1,930 1, Other Assets Rural Total 1,841 2,909 2,709 2,949 2,926 2,846 2,959 3,061 3,152 3,163 Grand Total 2,522 3,877 3,292 3,004 2,982 3,499 3,017 3,121 3,213 3,225 Table Total Reliability, Safety and Environment Capital Expenditure Forecast 182
183 9.2.3 RENEWAL CAPITAL EXPENDITURE This section provides an overview of our renewal capital expenditure during the AMP period. As discussed in Chapter 8 our renewal expenditure has been targeted at high risk components in the network, with a particular focus on those affecting rural performance. To illustrate the respective expenditure required in urban and rural areas our expenditure has been split. Urban and rural renewal capital expenditure by asset class is summarised in the table below. RENEWAL CAPITAL EXPENDITURE ($000) Urban Subtransmission Zone Substations Distribution and LV lines Distribution and LV cables Distribution Substations and transformers Distribution switchgear Other system fixed assets Other Assets Customer 2,976 3,174 1, ,118 1,143 1,169 1,195 1,222 1,249 Urban Total 6,876 5,806 3,733 3,269 3,919 3,344 3,543 3,707 3,634 3,593 Rural Subtransmission Zone Substations Distribution and LV lines 6,426 6,471 8,434 8,427 8,505 8,811 9,009 9,211 9,290 9,499 Distribution and LV cables Distribution Substations and 1,109 1, transformers Distribution switchgear 1,368 1,065 1,092 1,117 1,192 1,146 1,157 1,202 1,206 1,214 Other system fixed assets Other Assets Rural Total 9,471 9,253 10,768 10,783 11,045 11,219 11,447 11,723 11,853 12,072 Grand Total 16,347 15,059 14,501 14,053 14,963 14,563 14,990 15,430 15,486 15,665 Table Total Renewal Capital Expenditure Forecast 183
184 Table shows renewal capital expenditure over the period according to the Commerce Commission s expenditure categories. A more detailed breakdown of expenditure within the Commerce Commission s expenditure categories can be found in Tables and RENEWAL CAPITAL EXPENDITURE ($000) Asset Replacement and Renewal ,371 11,885 13,193 13,133 13,846 13,420 13,821 14,235 14,265 14,416 Asset relocations 2,976 3,174 1, ,118 1,143 1,169 1,195 1,222 1,249 Total 16,347 15,059 14,501 14,053 14,963 14,563 14,990 15,430 15,486 15,665 Table Total Renewal Capital Expenditure Forecast 184
185 ASSET REPLACEMENT AND RENEWAL (ARR) The breakdown of urban and rural ARR capital expenditure by asset class is summarised in the table below. ARR CAPITAL EXPENDITURE ($000) Urban Sub transmission Zone Substations Distribution and LV lines Distribution and LV cables Distribution Substations and transformers Distribution switchgear Other system fixed assets Other Assets Urban Total 3,900 2,632 2,425 2,350 2,801 2,201 2,374 2,512 2,412 2,344 Rural Sub transmission Zone Substations Distribution and LV lines Distribution and LV cables Distribution Substations and transformers Distribution switchgear Other system fixed assets 6,426 6,471 8,434 8,427 8,505 8,811 9,009 9,211 9,290 9, ,109 1, ,368 1,065 1,092 1,117 1,192 1,146 1,157 1,202 1,206 1, Other Assets Rural Total 9,471 9,253 10,768 10,783 11,045 11,219 11,447 11,723 11,853 12,072 Grand Total 13,371 11,885 13,193 13,133 13,846 13,420 13,821 14,235 14,265 14,416 Table Total Asset Replacement and Renewal Capital Expenditure Forecast 185
186 ASSET RELOCATION Asset relocation capital expenditure by activity is summarised in the table below. ASSET RELOCATION CAPITAL EXPENDITURE ($000) Relocations Undergrounding Transit Hamilton Bypass Transit Huntly Bypass 864 1, Longswamp Total 2,976 3,174 1, ,118 1,143 1,169 1,195 1,222 1,249 Table Total Asset Relocation Capital Expenditure Forecast NON-NETWORK CAPITAL EXPENDITURE The breakdown of non-network capital expenditure by asset type is summarised in the table below. NON-NETWORK CAPITAL EXPENDITURE ($000) Computer Equipment Computer Software Plant and Equipment ,141 2,047 1,159 1, ,113 2,464 1,836 1,116 1, Motor Vehicles 665 1, Total 3,890 4,196 2,036 3,045 2,632 2,174 3,654 3,199 1,980 2,025 Table Non-Network Capital Expenditure Forecast 9.3 OPERATIONAL EXPENDITURE This Section provides an overall summary of the forecast operational expenditure by category OPERATIONAL EXPENDITURE SUMMARY The expenditure is shown in two formats. The first is a breakdown according to the network level and asset classes as described in Chapter 8 and then secondly according to the regulatory categories specified by the Commerce Commission. Forecast operational expenditure is further broken down into network and non-network in sections and
187 Table shows a summary of operational expenditure over the AMP period by development plan and by asset class. OPERATIONAL EXPENDITURE ($000) Urban Subtransmission Zone Substations Distribution and LV lines Distribution and LV cables Distribution Substations and transformers Distribution switchgear Other system fixed assets ,733 2,880 2,879 2,960 2,884 2,917 2,835 2,834 2,820 2,877 Other Assets Urban Total 4,376 4,631 4,663 4,768 4,637 4,848 4,748 4,915 4,975 5,073 Rural Subtransmission Zone Substations Distribution and LV lines Distribution and LV cables Distribution Substations and transformers Distribution switchgear Other system fixed assets , ,144 1,217 1, ,217 2,268 2,292 2,347 2,029 2,126 1,772 1,851 1,874 1,912 Other Assets Rural Total 3,693 4,168 4,231 4,308 3,802 4,187 3,772 4,114 4,239 4,321 Total Network Operational Expenditure Non- Network Operational Expenditure 8,069 8,799 8,894 9,077 8,440 9,035 8,520 9,029 9,214 9,394 16,955 17,496 18,054 18,629 19,223 19,836 20,468 21,120 21,793 22,487 Grand Total 25,023 26,295 26,948 27,706 27,663 28,870 28,988 30,149 31,007 31,881 Table Total Operational Expenditure Forecast 187
188 Table below shows total operational expenditure by Commerce Commission expenditure category. OPERATIONAL EXPENDITURE ($000) Service interruptions and emergencies Vegetation management Routine and corrective maintenance and inspection Asset replacement and renewal T o t a l N e t w o r k Operational E x p e n d i t u r e Non- Network Operational Expenditure ,551 2,604 2,604 2,657 2,580 2,530 2,477 2,421 2,361 2,410 1,343 1,371 1,399 1,428 1,129 1, ,760 2,664 2,708 2,794 2,758 2,797 2,799 2,880 2,939 2,999 1,414 2,161 2,183 2,197 1,973 2,555 2,421 2,889 3,057 3,110 8,069 8,799 8,894 9,077 8,440 9,035 8,520 9,029 9,214 9,394 16,955 17,496 18,054 18,629 19,223 19,836 20,468 21,120 21,793 22,487 Grand Total 25,023 26,295 26,948 27,706 27,663 28,870 28,988 30,149 31,007 31,881 Table Total Operational Expenditure Forecast NETWORK OPERATIONAL EXPENDITURE This section provides an overview of network operational expenditure. The breakdown of the network operational expenditure by activity is summarised in the table below. A more detailed breakdown of expenditure within the Commerce Commission s expenditure categories can be found in Tables to NETWORK OPERATIONAL EXPENDITURE ($000) Service interruptions and emergencies Vegetation management Routine and corrective maintenance and inspection Asset replacement and renewal ,551 2,604 2,604 2,657 2,580 2,530 2,477 2,421 2,361 2,410 1,343 1,371 1,399 1,428 1,129 1, ,760 2,664 2,708 2,794 2,758 2,797 2,799 2,880 2,939 2,999 1,414 2,161 2,183 2,197 1,973 2,555 2,421 2,889 3,057 3,110 Total 8,069 8,799 8,894 9,077 8,440 9,035 8,520 9,029 9,214 9,394 Table Total Network Operational Expenditure Forecast 188
189 SERVICE INTERRUPTION AND EMERGENCY MAINTENANCE (SIE) The breakdown of SIE maintenance expenditure by voltage level is summarised in the table below SIE OPERATIONAL EXPENDITURE ($000) High Voltage Network Low Voltage Network ,964 2,005 2,005 2,046 1,987 1,948 1,907 1,864 1,818 1,855 Total 2,551 2,604 2,604 2,657 2,580 2,530 2,477 2,421 2,361 2,410 Table Total Network Operational Expenditure Forecast VEGETATION MANAGEMENT Forecast vegetation management over the AMP period is summarised in the table below. VEGETATION OPERATIONAL EXPENDITURE ($000) Distribution and LV lines 1,343 1,371 1,399 1,428 1,129 1, Total 1,343 1,371 1,399 1,428 1,129 1, Table Total Vegetation Management Operational Expenditure Forecast 189
190 ROUTINE AND CORRECTIVE MAINTENANCE AND INSPECTION (RCI) The breakdown of RCI operational expenditure between urban and rural network and asset class is summarised in the following table. RCI OPERATIONAL EXPENDITURE ($000) Urban Subtransmission Zone Substations Distribution and LV lines Distribution and LV cables Distribution Substations and transformers Distribution switchgear Other system fixed assets Other Assets Urban Total 1,414 1,341 1,363 1,416 1,435 1,455 1,450 1,491 1,521 1,552 Rural Subtransmission Zone Substations Distribution and LV lines Distribution and LV cables Distribution Substations and transformers Distribution switchgear Other system fixed assets Other Assets Rural Total 1,346 1,323 1,345 1,378 1,323 1,342 1,348 1,389 1,417 1,446 Grand Total 2,760 2,664 2,708 2,794 2,758 2,797 2,799 2,880 2,939 2,999 Table Total Routine and Corrective Maintenance and Inspection Operational Expenditure Forecast 190
191 ASSET REPLACEMENT AND RENEWAL (ARR) MAINTENANCE The breakdown of ARR operational expenditure between urban and rural network and asset class is summarised in the table below. ARR OPERATIONAL EXPENDITURE ($000) Urban Subtransmission Zone Substations Distribution and LV lines Distribution and LV cables Distribution Substations and transformers Distribution switchgear Other system fixed assets Other Assets Urban Total 783 1,067 1,074 1, ,250 1,195 1,400 1,475 1,501 Rural Subtransmission Zone Substations Distribution and LV lines Distribution and LV cables Distribution Substations and transformers Distribution switchgear Other system fixed assets Other Assets Rural Total 631 1,093 1,109 1, ,305 1,226 1,489 1,582 1,609 Grand Total 1,414 2,161 2,183 2,197 1,973 2,555 2,421 2,889 3,057 3,110 Table Total Asset Replacement and Renewal Operational Expenditure Forecast 191
192 9.3.3 NON-NETWORK OPERATIONAL EXPENDITURE The breakdown of non-network operational expenditure by Commerce Commission expenditure category is summarised in the table below. The spend profile over the 10 years remains relatively flat in real terms with increases mainly driven by underlying inflation. NON-NETWORK OPERATIONAL EXPENDITURE ($000) System operations and network support ,468 3,589 3,712 3,840 3,972 4,108 4,249 4,395 4,546 4,702 Business support 13,486 13,907 14,342 14,789 15,251 15,727 16,218 16,725 17,247 17,785 T o t a l 16,955 17,496 18,054 18,629 19,223 19,836 20,468 21,120 21,793 22,487 Table Total Non-Network Operational Expenditure Forecast 192

193 APPENDICES
194 APPENDIX A: GLOSSARY ABBREVIATION AAAC AAC ABS AC ACSR AHI AIS AMMAT AMP AUFLS CB CBRM CDEM DESCRIPTION All Aluminium Alloy Conductor All Aluminium Conductor Air Break Switch Alternating Current Aluminium Conductor Steel Reinforced Asset Health Index Air Insulated Switchgear Asset Management Maturity Assessment Tool Asset Management Plan Automatic Under Frequency Load Shedding Circuit Breaker Condition Based Risk Management Civil Defence Emergency Management Code Electricity Industry Participation Code 2010 CoF DC DGA DMS Consequences of Failure Direct Current Dissolved Gas Analysis Distribution Management System DRC EDB ENA ERP EV FDC FMEA GFN GIS GeoIS Disaster Recovery Centre Electricity Distribution Business Electricity Networks Association Enterprise Resource Planning Electric Vehicle Cost of financing Failure Modes and Effects Analysis Ground Fault Neutraliser Gas Insulated Switchgear Geographic Information System 194
195 ABBREVIATION GWh GXP HI HILP HV ICP IT kv kw LTIFR LV MVA MW N N-1 NMS NPV OH DESCRIPTION Gigawatt Hour Grid Exit Point Health Index High Impact Low Probability High Voltage Installation Control Point Information Technology Kilovolts Kilowatt Lost-time Injury Frequency Rates Low Voltage Mega Volt Ampere Megawatt N system security means that the system is not able to tolerate the failure of any single component in the network. Any failure will result in a loss of supply N-1 means that the system must be able to tolerate the failure of any single component in the network without affecting the supply of electricity Network Management System Net Present Value Overhead Lines OLTC On-Load Tap Changer OMS Outage Management System P1 Priority 1 PCD Post Contingent Demand PCR Post Contingent Rating PD Partial Discharge PDD Project Definition Document PILC Paper insulated, lead covered PoF Probability of Failure PPE Personal Protective Equipment 195
196 ABBREVIATION PV RAMC RCA RCM RFP RMU RTU SAIDI SAIFI SAP SCADA SF 6 SFRA SO TRIFR Trust UG VoLL WEL WLUG DESCRIPTION Photovoltaic Risk and Audit Management Committee Root Cause Analysis Reliability Centred Maintenance Request for Proposals Ring Main Unit Remote Terminal Unit System Average Interruption Duration Index System Average Interruption Frequency Index Systems Applications and processes Supervisory Control and Data Acquisition Sulphur Hexafluoride Sweep Frequency Response Analysis System Operator Total Recordable Injury Frequency Rate WEL Energy Trust Underground Assets Value of Lost Load WEL Networks Ltd Waikato Lifelines Utilities Group XLPE Cross linked polyethene 196
197 APPENDIX B: CBRM CBRM is a methodology for establishing the optimum level of renewals developed by EA Technology, a UK based energy consultancy. The methodology assists electricity distribution businesses to deliver effective asset related risk management. CBRM is a structured process that combines asset information, engineering knowledge and practical experience to estimate future condition, performance and risk of network assets. The CBRM process can be summarised as follows: 1. Asset condition Health indices for individual assets are derived and built for different assets categories. Current health indices are measured on a scale of 0 to 10, where 0 indicates the best condition and 10 the worst. 2. Link current condition to performance Health indices are calibrated against relative probability of failure (PoF). The health index / PoF relationship for an asset class is determined by matching the health index profile with the recent failure rate. 3. Estimate future condition and performance Knowledge of asset degradation is used to age health indices. The ageing rate for an individual asset is dependent on its initial health index and operating conditions. Future failure rates can then be calculated from aged health index profiles and the previously defined health index / PoF relationship. 4. Evaluate potential interventions in terms of PoF the effect of potential renewal, refurbishment or changes to maintenance regimes can then be modelled and the future health index profiles and failure rates modified accordingly. 5. Define and weigh consequences of failure (CoF) a consistent framework is defined and populated in order to evaluate consequences in significant categories such as network safety, performance, financial and environment. The consequence categories are weighted to relate them to a common relative monetary ($) unit. 6. Build risk model For an individual asset, its probability and consequence of failure are combined to quantify risk. The total risk associated with an asset category is then obtained by summing the risk of the individual assets. 7. Evaluate potential interventions in terms of risk the effect of potential renewal, refurbishment or changes to maintenance regimes can be modelled to quantify the potential relative risk reduction associated with different strategies. 8. Review and refine information and process Building and managing a risk-based process on the basis of asset specific information is not a one-off process. The initial application will deliver results based on available information and, crucially, identify opportunities for ongoing improvement that can be used to progressively build an improved asset information framework. It is important to emphasise that the methodology is flexible enough to address the specific characteristics and operational context for each category of assets. How we approach the key components of the CBRM process is described below. DEFINE ASSET CONDITION The first stage in the CBRM process is to derive a numeric representation of the condition of each asset in the form of an AHI. Essentially, the AHI is a means of combining information that relate to its age, environment, risk and duty, as well as specific condition and performance information to give comparable measure of condition for individual assets in terms of proximity to end of life and PoF. 197
198 Figure B.1 below illustrates the AHI. CONDITION HEALTH REMNANT LIFE PROBABILITY INDEX OF FAILURE 10 Bad At EOL (<5 years) High Poor 5-10 years Medium Fair years Low Good 0 >20 years Very low Figure B.1 CBRM Health Indices The AHI represents the extent of degradation as follows: Low values (in the range 0 to 4) - represent some observable or detectable deterioration at an early stage. This may be considered as normal ageing, i.e. the difference between a new asset and one that has been in service for some time but is still in good condition. In such a condition, the PoF remains very low and the condition and PoF would not be expected to change significantly for some time. Medium values (in the range 4 to 7) - represent significant deterioration, with degradation processes starting to move from normal ageing to processes that potentially threaten failure. In this condition, the PoF, although still low, is just starting to rise and the rate of further degradation is increasing. High values (in the range >7) - represent serious deterioration; i.e. advanced degradation processes now reaching the point that they actually threaten failure. In this condition the PoF is significantly higher and the rate of further degradation will be relatively rapid. The detail of the AHI formulation is inevitably different for each asset category, reflecting the different information and the different rates of degradation. CONDITION RELATED PROBABILITY OF FAILURE (POF) The second important relationship in CBRM is that between the AHI and the condition related PoF. This relationship is shown schematically (solid line) in Figure B.2. RELATIONSHIP BETWEEN AHI AND POF PROBABILITY OF FAILURE (PoF) Measurable deterioration but no significant increase in PoF PoF constant up to HI lim Significant deterioration, small increase in PoF 0 HI lim HEALTH INDEX Figure B.2 Relationship between AHI and PoF Serious deterioration, significant increase in PoF 198
199 The relationship between the AHI and the PoF is non-linear. Under normal conditions, an asset can accommodate significant degradation with very little effect on the risk of failure. Conversely, once the degradation becomes significant or widespread, the risk of failure rapidly increases. ASSET END OF LIFE Adopting a consistent scale for the initial definition of condition for all asset types provides a basis for calibrating the AHI values and a basis for defining end of life. In CBRM terminology, end of life can be defined as when the condition related probability of failure becomes unacceptable. CONSEQUENCES The risk associated with any asset is a function of the PoF and the CoF. Four categories capture the key (quantifiable) CoF that affect all distribution businesses. These are shown in Figure B.3 together with their units of measurement. CONSEQUENCE CATEGORY Network performance Safety Financial (e.g. cost of repairs / replacement) Environmental impact CONSEQUENCE UNITS Potential loss of system availability Number of fatalities Number of major injuries Number of minor injuries Money ($) Volume of oil spilled Volume of SF 6 lost Number of fires with significant smoke / pollution Volume of waste created Scale of disturbance (traffic / noise) Figure B.3 Consequences Categories and their Units CRITICALITY The severity of the consequences associated with an event will vary depending on factors such as the physical location of the asset, the potential load interrupted by the fault, the accessibility of the asset for repair and the cost of replacement. In order to estimate the relative significance of a fault or failure, it is necessary to establish the criticality of an individual asset for each consequence category. This has been achieved for each asset group and consequence category by initially identifying the significant factors that affect the relative criticality, and then defining the factors using a number of levels or bands. Within CBRM criticality factor values are determined based on the relative weighting of the parameter compared to the average. RISK Risk can be described as the effect of uncertainty on objectives and is generally defined as the combination of: the probability / likelihood of an event occurring; and the resulting consequences / impacts if the event occurs. The outcome from CBRM models is a risk analysis for each individual asset category. Different risk outcomes arise from different renewal scenarios over the AMP period. The scenarios considered included: Do nothing this scenario assumes no investment within the planning period Current this scenario shows the current year s investment 199
200 Re-prioritised this scenario shows optimum investment using CBRM outcomes with the current year s investment Higher spend, No risk increase this scenario simulates that year-10 (Y10) risks are maintained in the current year s (Y0) level with higher investment requirement Highest spend, Minimum risks this scenario assume maximum investment to get the risks to the minimum level in year 10. Using the scenarios above, the optimal renewal programme is identified for each individual asset category. The Do nothing scenario generally demonstrates the level of risks involved per asset category and provides a good indication on the required level of investment priority. Individual asset risk profiles with their corresponding mitigation programmes are aggregated to determine the overall risk profile for an asset category. 200
201 APPENDIX C: INFORMATION DISCLOSURE COMPLIANCE REFERENCE REQUIREMENT REF Summary 3.1 The AMP must include a summary that provides a brief overview of the AMP contents and highlights information that the EDB considers significant. Plan Summary Background and Objectives 3.2 The AMP must include details of the background and objectives of the EDB s asset management and planning processes Purpose Statement 3.3 The AMP must include a purpose statement that: Makes clear the purpose and status of the AMP in the EDB s asset management practices. The purpose statement must also include a statement of the objectives of the asset management and 1.1 planning processes States the corporate mission or vision as it relates to asset management Identifies the documented plans produced as outputs of the annual business planning process States how the different documented plans relate to one another with specific reference to any plans specifically dealing with asset 1.1 management Includes a description of the interaction between the objectives of the AMP and other corporate goals, business planning processes 1.1 and plans. AMP Period 3.4 The AMP must state that the period covered by the plan is 10 years or more from the commencement of the financial year The AMP must state the date on which the AMP was approved by the Board of Directors. 1.1 Stakeholder Interests The AMP must include a description of stakeholder interests 3.6 (owners, consumers etc) which identifies important stakeholders and indicates: The AMP must include a description of how the interests of stakeholders are identified The AMP must include a description of what these interests are The AMP must include a description of how these interests are accommodated in asset management practices The AMP must include a description of how conflicting interests are managed Accountabilities and Responsibilities The AMP must include a description of the accountabilities and 3.7 responsibilities for asset management on at least three levels, including:
202 REFERENCE REQUIREMENT REF Assumptions Governance a description of the extent of director approval required for key asset management decisions and the extent to which asset management outcomes are regularly reported to directors. Executive an indication of how the in-house asset management and planning organisation is structured. Field operations an overview of how field operations are managed, including a description of the extent to which field work is undertaken in-house and the areas where outsourced contractors are used. 3.8 The AMP must include all significant assumptions All significant assumptions must be quantified where possible. All significant assumptions must be clearly identified in a manner that makes their significance understandable to interested persons. The identification of significant assumptions must include a description of changes proposed where the information is not based on the EDB s existing business. The identification of significant assumptions must include a description of the sources of uncertainty and the potential effect of the uncertainty on the prospective information. The identification of significant assumptions must include a description of the price inflator assumptions used to prepare the financial information disclosed in nominal New Zealand dollars in the Report on Forecast Capital Expenditure set out in Schedule 11a and the Report on Forecast Operational Expenditure set out in Schedule 11b. Material Difference in Information ; 5.3.1; ; 8.2.1; 8.3.2; ; ; ; 8.2.1; 8.3.2; ; The AMP must include a description of the factors that may lead to a material difference between the prospective information disclosed and the corresponding actual information recorded in future disclosures ; Asset Management Strategy and Delivery 3.10 The AMP must include an overview of asset management strategy and delivery. 4.2 Systems and Information Management Data 3.11 The AMP must include an overview of systems and information management data The AMP must include a statement covering any limitations in the availability or completeness of asset management data and disclose any initiatives intended to improve the quality of this data ; 8.4 Asset Management Processes 3.13 The AMP must include a description of the processes used within the EDB for: Managing routine asset inspections and network maintenance. 8.1; 8.2; Planning and implementing network development projects. 5.1; 5.2; Measuring network performance. 6.3; The AMP must include an overview of asset management documentation, controls and review processes
203 REFERENCE REQUIREMENT REF Communication Processes 3.15 The AMP must include an overview of communication and participation processes. 4.4 Financial Values 3.16 The AMP must present all financial values in constant price New Zealand dollars except where specified otherwise Disclosure Requirements 3.17 The AMP must be structured and presented in a way that the EDB Throughout the considers will support the purposes of AMP disclosure set out in document clause of the determination. Assets covered 4 The AMP must provide details of the assets covered, including: 4.1 A high-level description of the service areas covered by the EDB and the degree to which these are interlinked, including: The region(s) covered Identification of large consumers that have a significant impact on network operations or asset management priorities A description of the load characteristics for different parts of the network Peak demand and total energy delivered in the previous year, broken down by sub-network, if any Network Configuration 4.2 The AMP must provide a description of the network configuration, including: Identifying bulk electricity supply points and any distributed generation with a capacity greater than 1 MW. State the existing firm supply capacity and current peak load of each bulk electricity supply point A description of the subtransmission system fed from the bulk electricity supply points, including the capacity of zone substations and the voltage(s) of the subtransmission network(s). The AMP must identify the supply security provided at individual 2.3.1; 7.2 zone substations, by describing the extent to which each has n-x subtransmission security or by providing alternative security class ratings A description of the distribution system, including the extent to which it is underground A brief description of the network s distribution substation arrangements ; A description of the low voltage network including the extent to which it is underground ; 3.1; An overview of secondary assets such as protection relays, ripple injection systems, SCADA and telecommunications systems. 3.8; 3.9 Sub-networks 4.3 If sub-networks exist, the network configuration information referred to in subclause 4.2 above must be disclosed for each sub-network. No sub-networks exist that meet disclosure threshold in definitions Network Asset Information The AMP must describe the network assets by providing the following information for 4.4 each asset category by Voltage levels
204 REFERENCE REQUIREMENT REF Description and quantity of assets Age profile A discussion of the condition of the assets, further broken down into more detailed categories as considered appropriate. Systemic issues leading to the premature replacement of assets or parts of assets should be discussed Network Asset Information by Asset Category 4.5 The asset categories discussed in subclause 4.4 above should include at least the following asset categories: The categories listed in the Report on Forecast Capital Expenditure in Schedule 11a (iii) Assets owned by the EDB but installed at bulk electricity supply points owned by others EDB owned mobile substations and generators whose function is to increase supply reliability or reduce peak demand Other generation owned by the EDB Service Levels The AMP must clearly identify or define a set of performance indicators for which annual performance targets have been defined. The annual performance targets must be consistent with business strategies and asset management objectives and be provided for each year of the AMP planning period. The targets should reflect what is practically achievable given the current network configuration, condition and planned expenditure levels. The targets should be disclosed for each year of the AMP planning period. The AMP must include performance indicators for which targets have been defined in clause 5 above must include SAIDI and SAIFI values for the next five disclosure years. The AMP must include performance indicators for which targets have been defined in clause 5 above should also include: Consumer oriented indicators that preferably differentiate between different consumer types. Indicators of asset performance, asset efficiency and effectiveness, and service efficiency, such as technical and financial performance indicators related to the efficiency of asset utilisation and operation. The AMP must describe the basis on which the target level for each performance indicator was determined. Justification for target levels of service includes consumer expectations or demands, legislative, regulatory, and other stakeholders requirements or considerations. The AMP should demonstrate how stakeholder needs were ascertained and translated into service level targets. Targets should be compared to historic values where available to provide context and scale to the reader. Where forecast expenditure is expected to materially affect performance against a target defined in clause 5 above, the target should be consistent with the expected change in the level of performance ; ; 6.1; ; ;
205 REFERENCE REQUIREMENT REF Network Development Planning 11 AMPs must provide a detailed description of network development plans, including 11.1 A description of the planning criteria and assumptions for network development Planning criteria for network developments should be described logically and succinctly. Where probabilistic or scenario-based planning techniques are used, this should be indicated and the 7.1 methodology briefly described A description of strategies or processes (if any) used by the EDB that promote cost efficiency including through the use of standardised assets and designs The use of standardised designs Network Efficient Operation 11.5 A description of strategies or processes (if any) used by the EDB that promote the energy efficient operation of the network Equipment Capacity A description of the criteria used to determine the capacity of 11.6 equipment for different types of assets or different parts of the network Project Prioritisation A description of the process and criteria used to prioritise network 11.7 development projects and how these processes and criteria align with the overall corporate goals and vision. 5.1; 5.2 Demand Forecasts The AMP must provide details of demand forecasts, the basis on 11.8 which they are derived, and the specific network locations where constraints are expected due to forecast increases in demand The AMP must explain the load forecasting methodology and indicate all the factors used in preparing the load estimates The AMP must provide separate forecasts to at least the zone substation level covering at least a minimum five year forecast period. Discuss how uncertain but substantial individual projects/ developments that affect load are taken into account in the forecasts, making clear the extent to which these uncertain increases in demand are reflected in the forecasts The AMP must identify any network or equipment constraints that may arise due to the anticipated growth in demand during the AMP planning period The AMP must discuss the impact on the load forecasts of any anticipated levels of distributed generation in a network, and the projected impact of any demand management initiatives Network Development Options The AMP must provide analysis of the significant network level 11.9 development options identified and details of the decisions made to satisfy and meet target levels of service, including: The reasons for choosing a selected option for projects where decisions have been made The alternative options considered for projects that are planned to start in the next five years and the potential for non-network solutions described
206 REFERENCE REQUIREMENT REF The consideration of planned innovations that improve efficiencies within the network, such as improved utilisation, extended asset lives, and deferred investment. Network Development Programme A description and identification of the network development programme including distributed generation and non-network solutions and actions to be taken, including associated expenditure projections. The network development plan must include- A detailed description of the material projects and a summary description of the non-material projects currently underway or planned to start within the next 12 months. A summary description of the programmes and projects planned for the following four years (where known). An overview of the material projects being considered for the remainder of the AMP planning period Distributed Generation A description of the EDB s policies on distributed generation, including the policies for connecting distributed generation. The impact of such generation on network development plans must also be stated Non-network solutions A description of the EDB s policies on non-network solutions, including Economically feasible and practical alternatives to conventional network augmentation. These are typically approaches that would 7.1 reduce network demand and/or improve asset utilisation The potential for non-network solutions to address network problems or constraints ; 7.1 Lifecycle Asset Management Planning (Maintenance and Renewals) 12 The AMP must provide a detailed description of the lifecycle asset management processes, including: 12.1 The key drivers for maintenance planning and assumptions. 8.2 Maintenance Programme Identification of routine and corrective maintenance and inspection policies and programmes and actions to be taken for each asset category, including associated expenditure projections. This must include- The approach to inspecting and maintaining each category of assets, including a description of the types of inspections, tests and condition monitoring carried out and the intervals at which this is done. Any systemic problems identified with any particular asset types and the proposed actions to address these problems. Budgets for maintenance activities broken down by asset category for the AMP planning period
207 REFERENCE REQUIREMENT REF Renewal Programme Identification of asset replacement and renewal policies and 12.3 programmes and actions to be taken for each asset category, 8 including associated expenditure projections. This must include The processes used to decide when and whether an asset is replaced or refurbished, including a description of the factors on which decisions are based, and consideration of future demands on the network and the optimum use of existing network assets A description of innovations made that have deferred asset replacement A description of the projects currently underway or planned for the next 12 months A summary of the projects planned for the following four years (where known) An overview of other work being considered for the remainder of the AMP planning period The asset categories discussed in subclauses 12.2 and 12.3 above should include at least the categories in subclause 4.5 above. 8.4 Non-network Development, Maintenance and Renewal AMPs must provide a summary description of material nonnetwork 13 development, maintenance and renewal plans, including 13.1 A description of non-network assets Development, maintenance and renewal policies that cover them ; 8; CBRM Appendix 5.1.1; 8; CBRM Appendix 13.3 A description of material capital expenditure projects (where known) planned for the next five years A description of material maintenance and renewal projects (where known) planned for the next five years Risk Management 14 AMPs must provide details of risk policies, assessment, and mitigation, including: 14.1 Methods, details and conclusions of risk analysis Strategies used to identify areas of the network that are vulnerable to high impact low probability events and a description of the resilience of the network and asset management systems to such events A description of the policies to mitigate or manage the risks of events identified in subclause Details of emergency response and contingency plans Evaluation of Performance 15 AMPs must provide details of performance measurement, evaluation, and improvement, including: 15.1 A review of progress against plan, both physical and financial. 6.6; 7.1.5; An evaluation and comparison of actual service level performance against targeted performance An evaluation and comparison of the results of the asset management maturity assessment disclosed in the Report on Asset Management Maturity set out in Schedule 13 against relevant objectives of the EDB s asset management and planning processes ;
208 REFERENCE REQUIREMENT REF An analysis of gaps identified in subclauses 15.2 and 15.3 above. Where significant gaps exist (not caused by one-off factors), 15.4 the AMP must describe any planned initiatives to address the situation. Capability to Deliver 16 AMPs must describe the processes used by the EDB to ensure that: The AMP is realistic and the objectives set out in the plan can be 16.1 achieved. The organisation structure and the processes for authorisation 16.2 and business capabilities will support the implementation of the AMP plans. 6.6 Throughout the document

209 APPENDIX D: INFORMATION DISCLOSURE SCHEDULES REPORT ON FORECAST CAPITAL EXPENDITURE 209
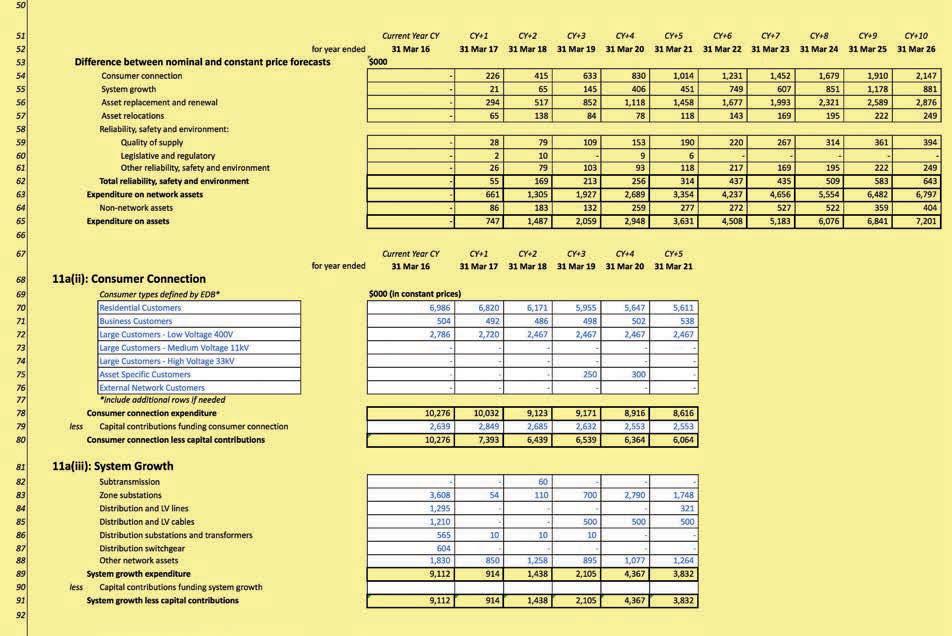
210 210
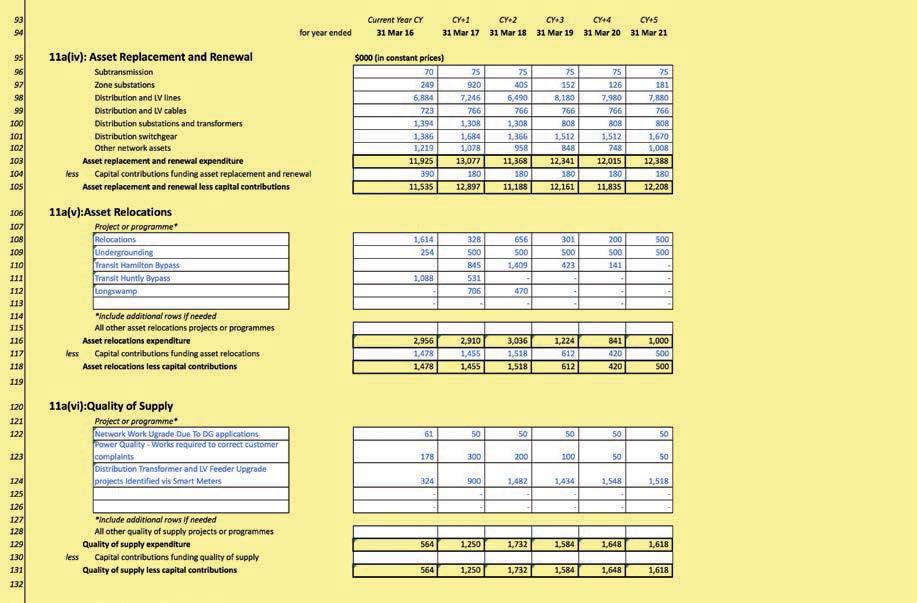
211 211
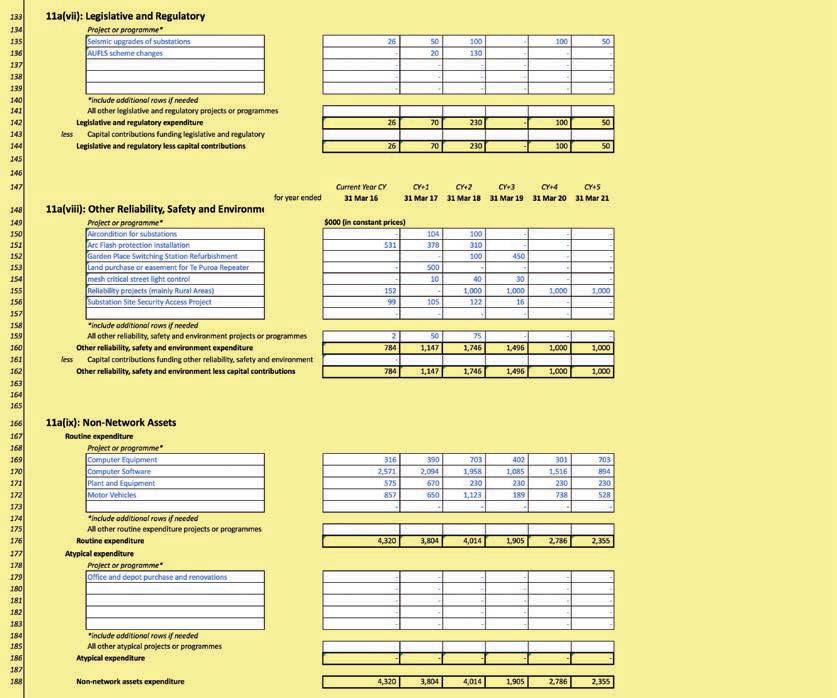
212 212

213 REPORT ON FORECAST OPERATIONAL EXPENDITURE 213

214 REPORT ON ASSET CONDITION 214
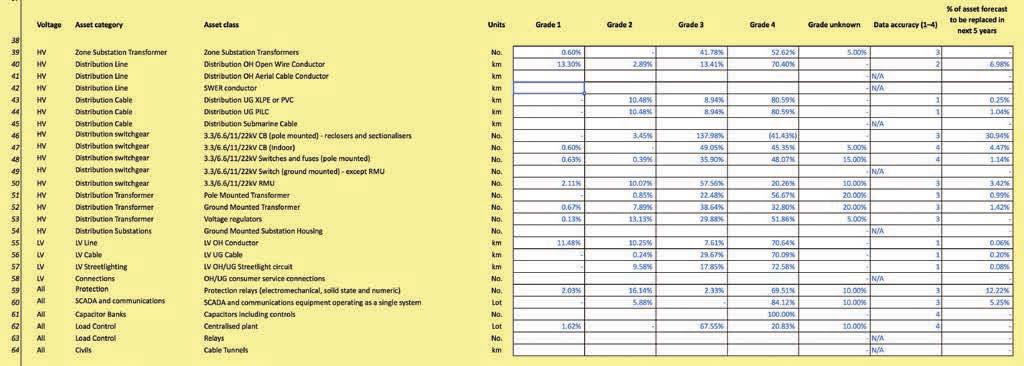
215 215
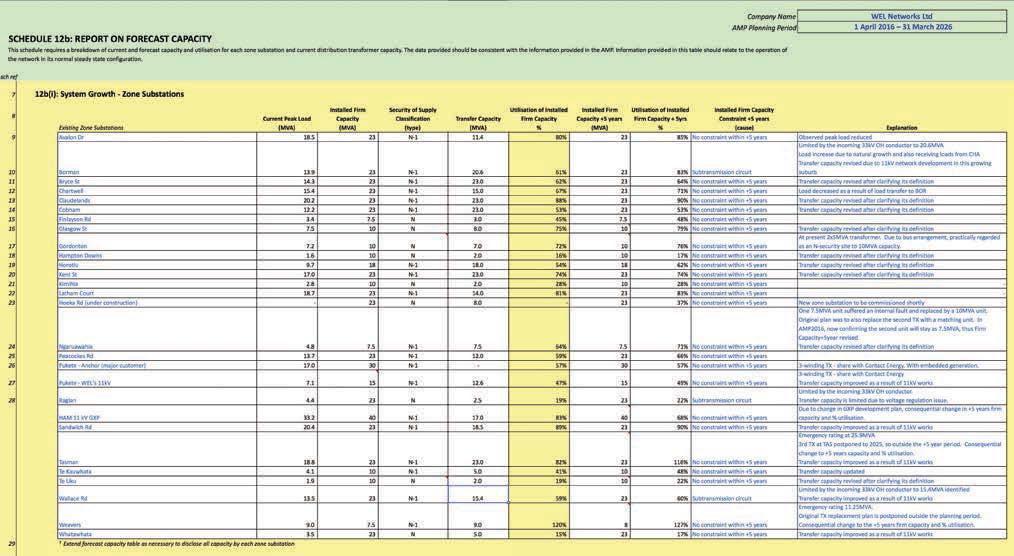
216 216
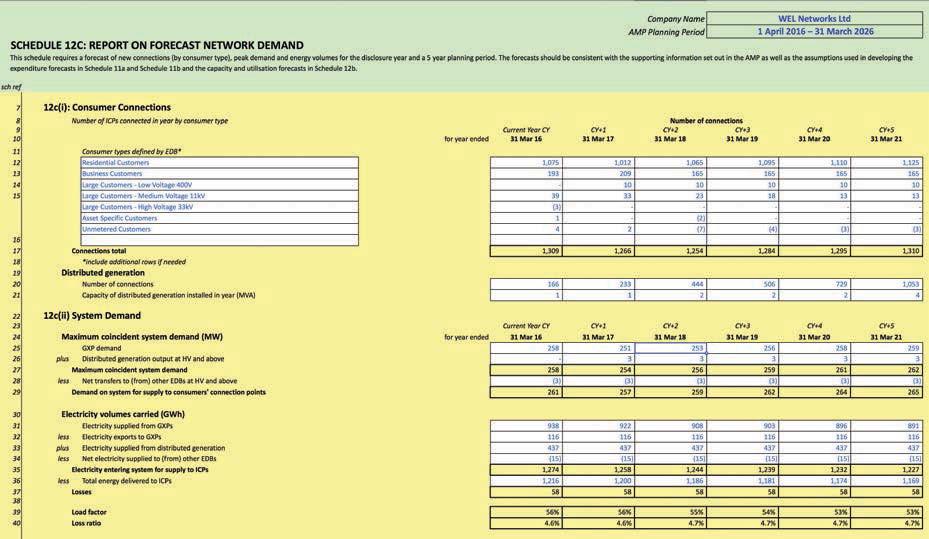
217 217

218 REPORT ON FORECAST INTERRUPTIONS AND DURATION 218
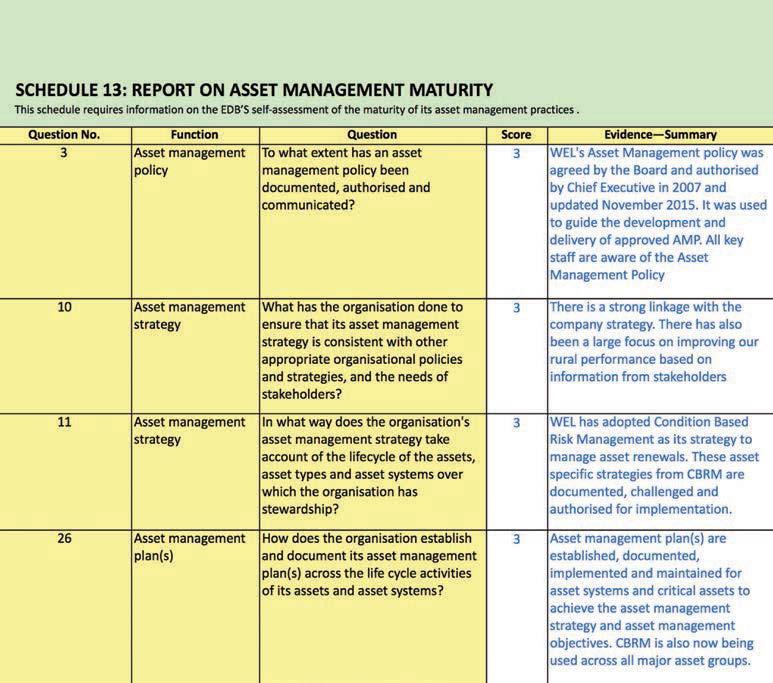
219 219
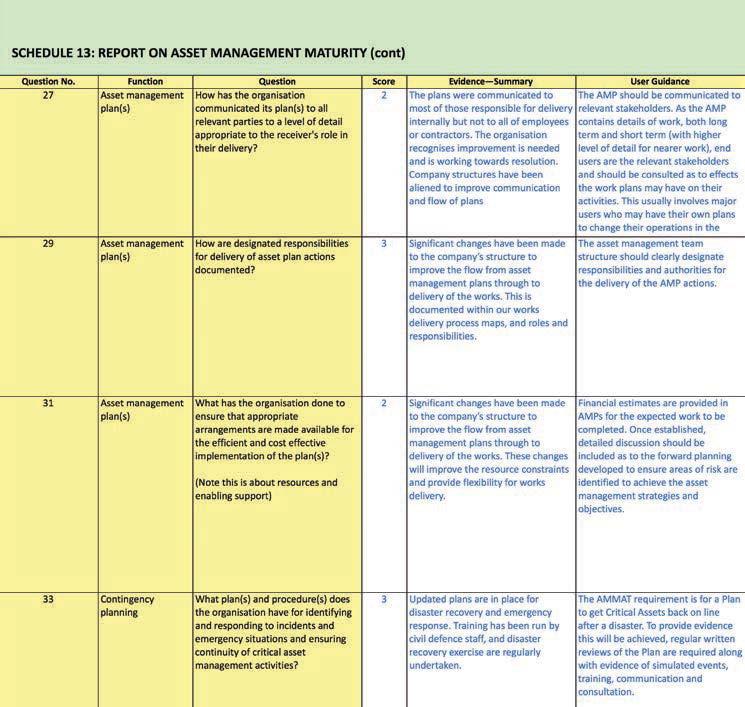
220 220
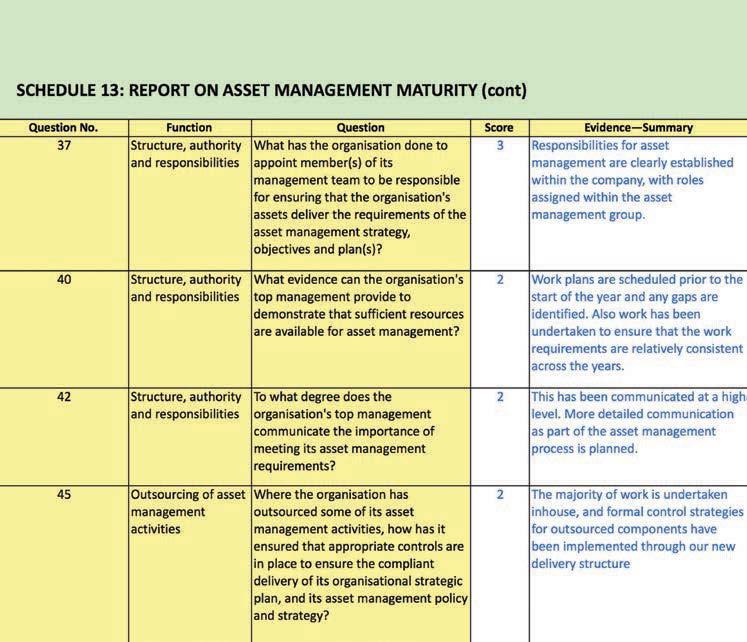
221 221
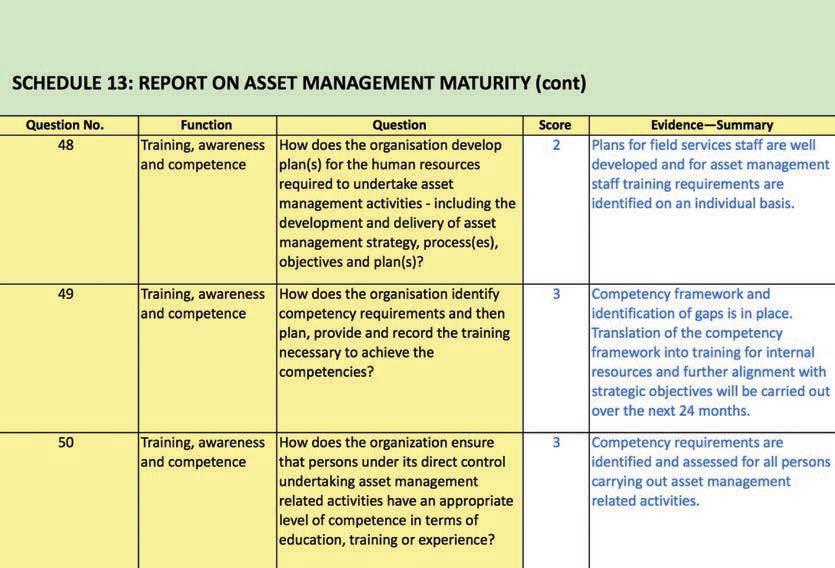
222 222
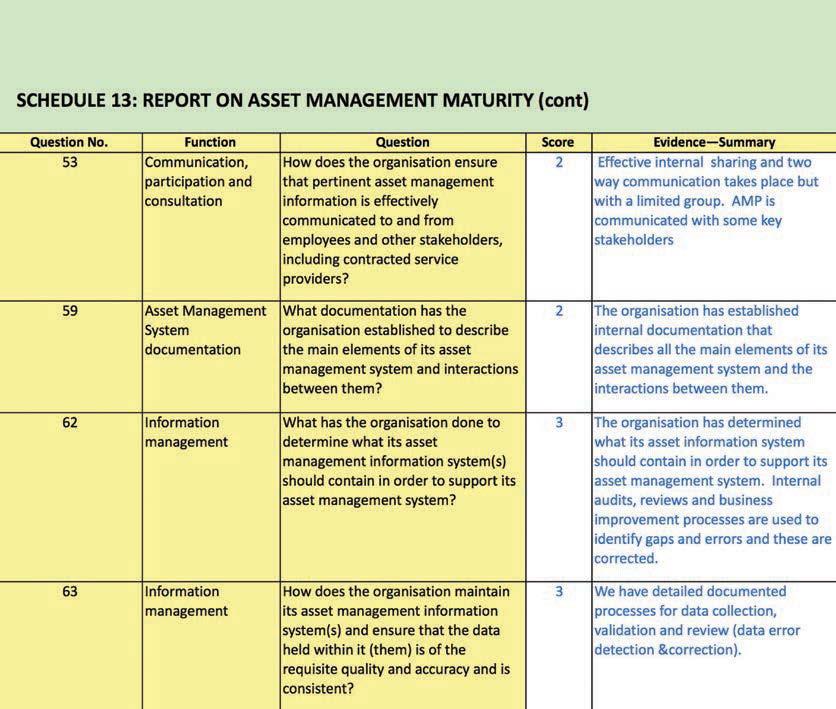
223 223
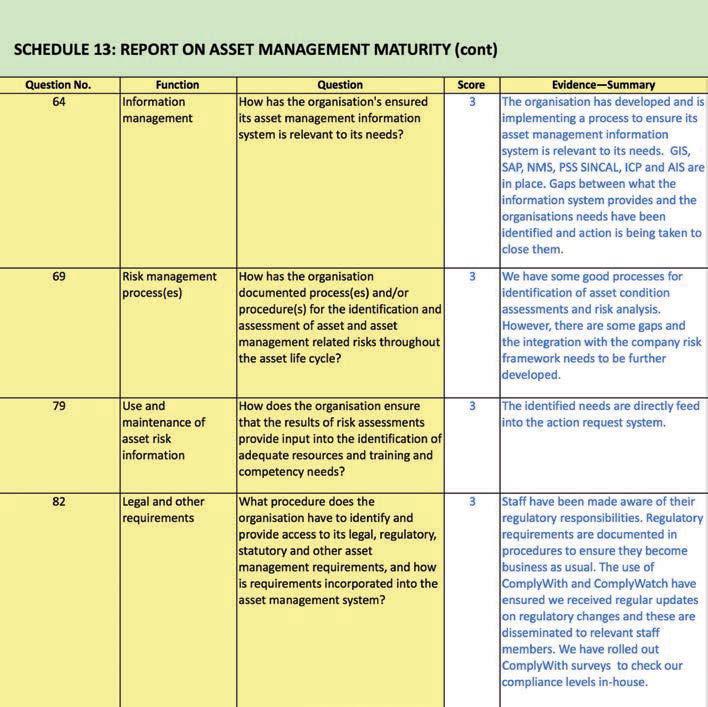
224 224
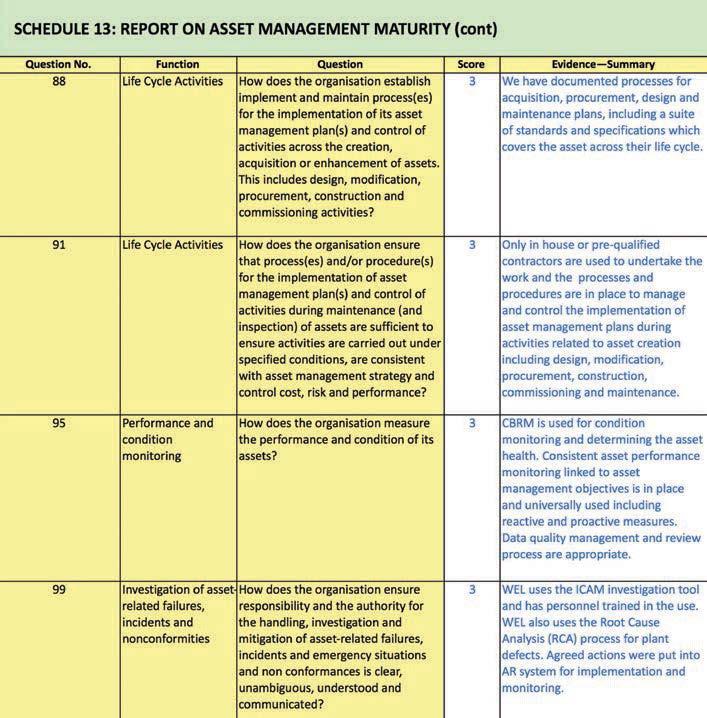
225 225
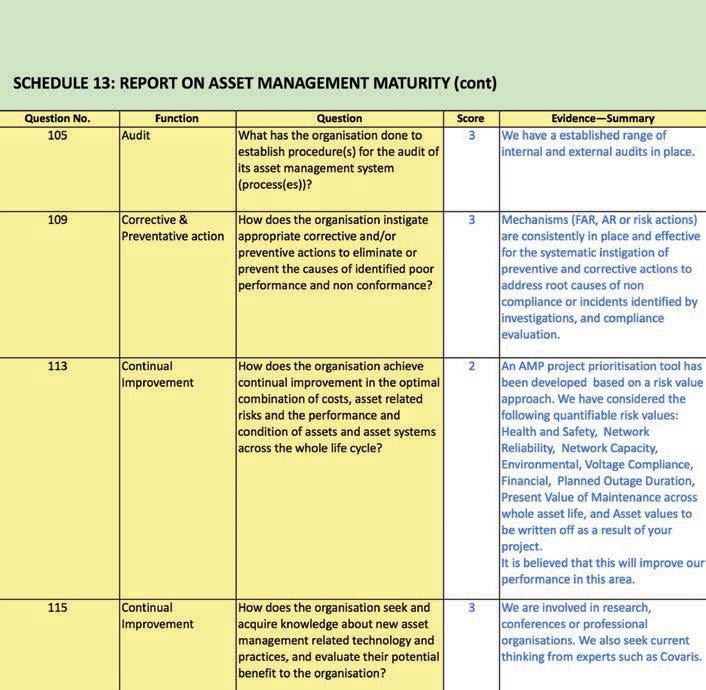
226 226
WEL Networks Asset Management Plan wel.co.nz
 WEL Networks 2018 Asset Management Plan 0800 800 935 wel.co.nz WEL Networks 2018 Asset Management Plan 01 FOREWORD 29 March 2018 Dear Stakeholders, Thank you for taking the time to review the WEL Networks
Counties Power Limited
 Counties Power Limited Electricity Distribution Business Pricing Methodology Disclosure 1 April 2018 to 31 March 2019 Pursuant to Electricity Information Disclosure Information for compliance with Part
Electricity Asset Management Plan Executive Summary
 Electricity Asset Management Plan 2016 2026 Executive Summary Vector Limited Section 1, Page 1 of 11 Summary of the Asset Management Plan Vector s strategic vision is to: Create a new energy future with
PRICING METHODOLOGY DISCLOSURE 2018/ February 2018
 PRICING METHODOLOGY DISCLOSURE 2018/19 21 February 2018 1 Revision Overview Date Version Changes 28/2/13 1.0 Initial publication 27/2/14 2.0 New section on tariff structure. Revisions to cost allocators;
Asset Management Policy
 Asset Management Policy January 2018 Introduction Our Asset Management Policy was last published in 2014. It is being updated to reflect our commitment to regularly review and improve all of our Asset
ASSET MANAGEMENT PLAN
 ASSET MANAGEMENT PLAN 2018-2028 Asset Management Plan 2018 2028 Section 1 Summary Section 1 Summary Summary MainPower New Zealand Limited (MainPower) is a consumer-trust owned electricity distribution
Response to Independent Review of Aurora Energy Network: Final Report. 20 December 2018
 Response to Independent Review of Aurora Energy Network: Final Report 20 December 1 Introduction In, Aurora Energy commissioned an independent review of the state of our electricity network. The main aims
TasNetworks Transformation Roadmap 2025
 DRAFT TasNetworks Transformation Roadmap 2025 JUNE 2017 Trusted by our customers to deliver today and create a better tomorrow 2 TasNetworks Transformation Roadmap 2025 June 2017 Purpose We deliver electricity
SUMMARY OF DISTRIBUTION BUSINESS
 Filed: 0-0- EB-0-0 Schedule Page of SUMMARY OF DISTRIBUTION BUSINESS.0 INTRODUCTION Hydro One Networks Inc. is licensed by the Ontario Energy Board (the Board ) to own, operate and maintain electricity
Asset Management Plan
 Asset Management Plan 2012-2022 1 April 2012 Summary Summary of ENL s AMP Purpose of the AMP This Asset Management Plan ( AMP ) has been prepared to meet regulatory compliance requirements, demonstrate
Supporting Document 03. Information to support our proposed base capital expenditure programme
 Supporting Document 03 Information to support our proposed base capital expenditure programme Information to support our proposed base capital expenditure programme Summary This document sets out Scottish
Asset Management Plan APRIL 2013 MARCH 2023
 Asset Management Plan APRIL 2013 MARCH 2023 Aurora Energy Asset Management Plan 2013-2023 Asset Management Plan No. 20 A 10 Year Management Plan for Aurora Energy Limited From 1 April 2013 to 31 March
GAS ASSET MANAGEMENT PLAN 2015
 GAS ASSET MANAGEMENT PLAN 2015 Disclaimer: The information in this document has been prepared in good faith and represents Powerco s intentions and opinions at the date of issue. Powerco however, operates
Scorecard - Hydro Ottawa Limited
 Scorecard - Hydro Ottawa Limited 9/16/2015 Performance Outcomes Performance Categories Measures 2010 2011 2012 2013 2014 Trend Industry Distributor Target Customer Focus Services are provided in a manner
Executive Summary. Transition to Time of Use Pricing
 Executive Summary This pricing methodology outlines the approach used by The Lines Company (TLC) to formulate our structure and to set our s. It has been prepared to meet the requirements of the Commerce
Asset Management Plan
 MainPower New Zealand Limited ( MPNZ ) Asset Management Plan 1st April 2013 31st March 2023 1 P age CERTIFICATE FOR YEAR-BEGINNING DISCLOSURE Pursuant to Clause 2.9.1 of section 2.9 We, WYNTON GILL COX
PRICING METHODOLOGY DISCLOSURE 2013/14
 PRICING METHODOLOGY DISCLOSURE 2013/14 27 March 2013 1 Revision overview Date Version Changes 28/2/13 1.0 27/3/13 1.1 Statement in V1.0 These subdivisions are operational in Auckland, Taupō, Wellington
Electricity Distribution Business Pricing Methodology
 Electricity Distribution Business Pricing Methodology 31 March 2014 1. GLOSSARY Commerce Commission (Commission) EDB Electricity Authority (EA) Responsible for the regulation of EDBs as provided for under
SA Water Strategic Plan Delivering water and wastewater services in efficient, responsive, sustainable and accountable ways
 SA Water Strategic Plan 2012-16 Delivering water and wastewater services in efficient, responsive, sustainable and accountable ways Contents 3 From the Chairman and Chief Executive 4 Our Business Context
ASSET MANAGEMENT PLAN
 ASSET MANAGEMENT PLAN 2015-2025 The photographs on the cover page illustrate the replacement of the Galatea 11kV overhead substation with a new indoor 11kV switchboard. A significant achievement in the
BR04 SERVICE PERFORMANCE MEASURES
 SERVICE PERFORMANCE MEASURES 1 October 2013 C O P Y R I G H T 2013 T R A N S P O W E R N E W Z E A L A N D L I M I T E D. A L L R I G H T S R E S E R V E D This document is protected by copyright vested
ASSET MANAGEMENT PLAN NETWORK TASMAN LIMITED
 ASSET MANAGEMENT PLAN 2012-2022 NETWORK TASMAN LIMITED CONTENTS 1 EXECUTIVE SUMMARY... 1 1.1 OVERVIEW AND PLAN PURPOSE... 1 1.2 CORPORATE OBJECTIVES AND ASSET MANAGEMENT DRIVERS... 1 1.3 STATUS OF PROGRAMMES
Direction and Priorities Paper
 Revenue Reset 2019 Direction and Priorities Paper Summary of Submissions and Key Themes November 2017 Tasmanian Networks Pty Ltd ABN 24 167 357 299 PO Box 606 Moonah TAS 7009 Enquiries regarding this document
Scorecard - Toronto Hydro-Electric System Limited
 Scorecard - Toronto Hydro-Electric System Limited 9/23/2015 Performance Outcomes Performance Categories Measures 2010 2011 2012 2013 2014 Trend Industry Distributor Target Customer Focus Services are provided
Electricity Industry Act Electricity Distribution Licence Performance Reporting Handbook
 Electricity Industry Act 2004 Electricity Distribution Licence Performance Reporting Handbook April 2018 Economic Regulation Authority 2018 This document is available from the Economic Regulation Authority
Asset Management Plan
 MainPower New Zealand Limited ( MainPower ) Asset Management Plan 1st April 2014 31st March 2024 1 P age 2 P age Contents EXECUTIVE SUMMARY... 7 1. Background and Objectives of the AMP... 17 1.1 Introduction...
AURORA ENERGY LTD. Use-of-System Pricing Methodology
 AURORA ENERGY LTD Methodology Applicable from 1 April 2009 Prices Applicable from 1 April 2009 1 INTRODUCTION 2 PRICING OBJECTIVES 3 COST STRUCTURE 4 REVENUE STRUCTURE 5 PRICING COMPONENTS 5.1 Distribution
Gas Distribution Asset Management Plan
 Gas Distribution Asset Management Plan 2015 2025 Table of Contents (Note that each section is individually numbered) SECTION 1 1. EXECUTIVE SUMMARY... 2 SECTION 2 2. BACKGROUND AND OBJECTIVES... 4 2.1
Power Retail Corporation (Trading as Jacana Energy) Statement of Corporate Intent Public Version
 Statement of Corporate Intent Public Version") Power Retail Corporation (Trading as Jacana Energy) Statement of Corporate Intent 2016-17 Public Version Contents 1. Jacana Energy Objectives... 2 2. The nature and scope of activities undertaken by Jacana
Power Retail Corporation (Trading as Jacana Energy) Statement of Corporate Intent 2016-17 Public Version Contents 1. Jacana Energy Objectives... 2 2. The nature and scope of activities undertaken by Jacana
PART A - The Proposal...IV PART B Justification Introduction...1
 Contents TABLE OF CONTENTS PART A - The Proposal...IV PART B Justification...1 1 Introduction...1 1.1 Purpose...1 1.2 Background to the Proposals...1 1.3 Document structure...1 1.4 Glossary/terminology...2
CEOP CONNECTION POLICY CONNECTION CHARGES. 1 July 2015
 CEOP2513.06 CONNECTION POLICY CONNECTION CHARGES 1 July 2015 Contents 1. Introduction... 3 1.1. General approach to funding connections... 3 1.1.1. Third party fees and charges... 3 1.1.2. Network Augmentations...
JULY 2015 INITIATIVES PLAN FOR REGULATED TRANSMISSION SERVICES
 JULY 2015 INITIATIVES PLAN FOR REGULATED TRANSMISSION SERVICES TABLE OF CONTENTS 1. INTRODUCTION... 3 1.1 Services Covered by the Initiatives Plan... 3 1.2 Activities Covered by the Initiatives Plan...
Head of IT Operations
 Principles Vision Purpose Statement Head of IT Operations healthalliance Purpose, Vision and Principles To be right behind better healthcare. Our role as provider of non-clinical services to the Northern
Improving the way we price our network services. Consultation paper
 Improving the way we price our network services Consultation paper October 2015 Table of Contents 1 Overview... 4 2 Background... 6 3 Purpose... 7 4 Network tariff strategy... 7 4.1 Network tariff reform
Electricity Industry Act Electricity Distribution Licence Performance Reporting Handbook
 Electricity Industry Act 2004 Electricity Distribution Licence Performance Reporting Handbook April 2017 Economic Regulation Authority 2017 This document is available from the Economic Regulation Authority
Head of Kent & Essex Estate Main purpose of the role: management of the joint Essex Status:
 Job title: Head of Kent & Essex Estate Main purpose of the role: Services Grade: SPS 9 Lead and direct the strategic Role code: E40835 management of the joint Essex Status: Police Staff Police & Kent Police
Senior Business/Implementation Analyst
 Principles Vision Purpose Statement Senior Business/Implementation Analyst healthalliance Purpose, Vision and Principles To be right behind better healthcare. Our role as provider of non-clinical services
LIVERPOOL MUTUAL HOMES GROUP 2015/ /20 CORPORATE PLAN
 LIVERPOOL MUTUAL HOMES GROUP 2015/16 2019/20 CORPORATE PLAN Version v2 January 2016 1 I LIVERPOOL MUTUAL HOMES GROUP CORPORATE PLAN 2015/16-2019/20 Introduction Liverpool Mutual Homes began, in 2008, as
Scorecard - Midland Power Utility Corporation 9/28/2018
 Scorecard - Midland Power Utility Corporation 9/28/218 Performance Outcomes Performance Categories Measures 213 214 215 216 217 Trend Industry Distributor Target Customer Focus Services are provided in
ASSET MANAGEMENT PLAN
 ASSET MANAGEMENT PLAN 2019-2029 Contents 1 EXECUTIVE SUMMARY... 5 1.1 OVERVIEW AND PLAN PURPOSE... 5 1.2 CORPORATE OBJECTIVES AND ASSET MANAGEMENT DRIVERS... 5 1.3 STATUS OF PROGRAMMES AND PROJECTS...
Alinta DEWAP Pty Ltd. Electricity Integrated Regional Licence (EIRL7) 2016 Asset Management System Review November 2016 report
 2016 Asset Management System Review November 2016 report") Alinta DEWAP Pty Ltd Electricity Integrated Regional Licence (EIRL7) 2016 Asset Management System Review November 2016 report Deloitte Touche Tohmatsu ABN 74 490 121 060 Tower 2 Brookfield Place 123 St
Alinta DEWAP Pty Ltd Electricity Integrated Regional Licence (EIRL7) 2016 Asset Management System Review November 2016 report Deloitte Touche Tohmatsu ABN 74 490 121 060 Tower 2 Brookfield Place 123 St
Pricing Methodology Disclosure
 Electricity Distribution Network Pricing Methodology Disclosure For prices effective 1 April 2014 Pursuant to: Electricity Distribution (Information Disclosure) Requirements 2012 and Distribution Pricing
Demand Side Engagement Strategy. Version 2.0 Effective Date: 08/02/18
 Demand Side Engagement Strategy Version 2.0 Effective Date: 08/02/18 Document management Version control Date Version Description Author 16/07/2013 0.1 Initial Draft. Y. Jayathilaka 23/07/2013 0.2 Revised
Alinta Energy Transmission (Roy Hill) Pty Ltd
 Pty Ltd") Alinta Energy Transmission (Roy Hill) Pty Ltd Electricity Integrated Regional Licence (EIRL6) 2016 Asset Management System Review December 2016 report Deloitte Risk Advisory Pty Ltd ACN 611 748 184 Tower
Alinta Energy Transmission (Roy Hill) Pty Ltd Electricity Integrated Regional Licence (EIRL6) 2016 Asset Management System Review December 2016 report Deloitte Risk Advisory Pty Ltd ACN 611 748 184 Tower
SERVICE ENGAGEMENT PAPER 2
 SERVICE ENGAGEMENT PAPER 2 April 2017 Contents Introduction... 2 Request for feedback... 2 Part A... 3 Engagement Process... 3 Feedback to date... 4 Part B... 6 Refresh and evolution of the performance
EDB Information Disclosure Requirements Information Templates for Schedules 11a 13
 EDB Information Disclosure Requirements Information Templates for Schedules 11a 13 Disclosure Date 31 March 2014 Start Date (first day) 1 April 2014 Templates for Schedules 11a 13 (Asset Management Plan)
POWERNET LIMITED LINE PRICING METHODOLOGY
 POWERNET LIMITED LINE PRICING METHODOLOGY FOR THE ELECTRICITY INVERCARGILL LIMITED NETWORK AS AT 1 APRIL 2018 THE ELECTRICITY INVERCARGILL LIMITED NETWORK AS AT 1 APRIL 2018 TABLE OF CONTENTS 1. GLOSSARY
Head of IT Operations
 Principles Vision Purpose Statement Head of IT Operations healthalliance Purpose, Vision and Principles healthalliance provides shared services to benefit NZ health organisations. We will deliver increasing
Health and safety objectives.
 2016-17 Health and safety objectives. Martin Baggs message. My commitment to the health, safety and wellbeing of our people is unwavering. This commitment is reflected across all teams within the business,
The purpose of this document is to define the overall IT Strategy for the period 2016 to 2021
 Information Technology IT STRATEGY The purpose of this document is to define the overall IT Strategy for the period 2016 to 2021 The IT Strategy will align with the wider University Strategy. It will be
Methodology for deriving delivery prices
 Methodology for deriving delivery prices For prices applying from 1 April 2018 Issued xx February 2018 DRAFT Please note that this document has not yet been certified by Orion s directors A certified version
ASSET MANAGEMENT PLAN 2017 SUPPORTING DOCUMENT OF: INTEGRATED MANAGEMENT PLAN
 ASSET MANAGEMENT PLAN 2017 SUPPORTING DOCUMENT OF: INTEGRATED MANAGEMENT PLAN CONTENTS 1. INTRODUCTION 1 2. PLAN SUMMARY 3 3. 4. POWERING NEW ZEALANDERS: TODAY AND INTO THE FUTURE 9 OUR APPROACH TO ASSET
ASSET MANAGEMENT PLAN 2017 SUPPORTING DOCUMENT OF: INTEGRATED MANAGEMENT PLAN
 ASSET MANAGEMENT PLAN 2017 SUPPORTING DOCUMENT OF: INTEGRATED MANAGEMENT PLAN CONTENTS 1. INTRODUCTION 1 2. PLAN SUMMARY 3 3. 4. POWERING NEW ZEALANDERS: TODAY AND INTO THE FUTURE 9 OUR APPROACH TO ASSET
Business Case Guidelines for Investment in Information Technology
 Business Case Guidelines for Investment in Information Technology Citation: Ministry of Health. 2004. Business Case Guidelines for Investment in Information Technology. Wellington: Ministry of Health.
For the year ended 30 June Statement of Intent Page 1 of 12
 Statement of Intent For the year ended 30 June 2015 Page 1 of 12 Table of Contents 1. Message from... 3 2. Background:... 5 3. Strategic Objectives... 5 4. TRCs Vision, Strategic Framework and Business
Monitoring Plan for
 Monitoring Plan for 2015-16 November 2015 MONITORING PLAN FOR 2015-16 Contents Foreword... 3 1 Our Vision and Strategy... 4 2 Industry Structure... 5 3 Adjusted Outputs for 2015-16 due to reduced funding...
Code of Corporate Governance
 Code of Corporate Governance 1 FOREWORD From the Chairman of the General Purposes Committee I am pleased to endorse this Code of Corporate Governance, which sets out the commitment of Cambridgeshire County
CitiPower Amended Revised Proposed Tariff Structure Statement
 CitiPower Amended Revised Proposed Tariff Structure Statement 2017 2020 This page is intentionally left blank. 2 CitiPower Amended Revised Proposed Tariff Structure Statement 2017 2020 Table of Contents
Helping you with all you need to know: Distribution Customer Charter Large Business
 Helping you with all you need to know: Distribution Customer Charter Large Business 1 October 2018 Table of Contents What is the Customer Charter? 2 What do we do for you? 2 Do you have any questions?
Manager Service Performance & Integration
 Manager Service Performance & Integration Technology Services & Solutions (TSS), Shared Services Branch (SSB) The Manager Service Performance and Integration (SP&I) is accountable for ensuring the seamless
Pursuant to the Electricity Distribution Information Disclosure Determination 2012
 Pricing Methodology 2014-2015 Pursuant to the Electricity Distribution Information Disclosure Determination 2012 & Electricity Authority Distribution Pricing Principles and Information Disclosure Guidelines
Recruitment Pack. Development Manager. Bromsgrove District Housing Trust. Building excellent communities with passion and pride.
 Recruitment Pack Development Manager Bromsgrove District Housing Trust Building excellent communities with passion and pride. Application for Development Manager 2 Contents Letter to Applicant Page 3 About
This Corporate Plan has been developed to balance the needs of today with the challenges and opportunities of the future.
 Contents 1. Executive summary... 3 2. Summary of financial and pricing forecasts... 5 3. Introduction... 8 4. Our customers... 9 5. An industry in transition... 10 6. Strategic goals... 14 7. Strategic
Pricing Methodology and Compliance with Pricing Principles
 Pricing Methodology and Compliance with Pricing Principles 1 April 2012 Table of Contents 1. Glossary... 3 2. Introduction... 5 3. Changes to the pricing methodology... 7 4. Pricing objectives... 8 5.
INTEGRATED TRANSMISSION PLAN 2016
 INTEGRATED TRANSMISSION PLAN 2016 FOREWORD ITP 2016 is our second standalone Integrated Transmission Plan (ITP). Building on ITP 2015, it provides an update on our business transformation process and provides
Value for Money Strategy
 Value for Money Strategy 2013-15 1 Version: 3 Ref: 1009 Lead Officer: Chief Executive Issue Date: July 2013 Approved by: Strategic Board Approval Date: July 2013 Supersedes: Version 2 Review Date: July
Eastland Network Limited. Pricing Methodology Disclosure
 Eastland Network Limited Pricing Methodology Disclosure Pursuant to: Requirements 22 and 23 of the Electricity Information Disclosure Requirements 2004 For Line Charges introduced on 31 March 2011 April
Asset Management Plan
 Asset Management Plan UPDATE, APRIL 2017 MARCH 2027 P age 1 Asset Management Plan No. 24 A 10 Year Management Plan for Aurora Energy Limited From 1 April 2017 to 31 March 2027 Aurora Energy Limited PO
CUSTOMER-FACING GRID PERFORMANCE MEASURES
 CUSTOMER-FACING GRID PERFORMANCE MEASURES CONSULTATION PAPER Transpower New Zealand Limited October 2012 CUSTOMER-FACING GRID PERFORMANCE MEASURES Transpower New Zealand Limited 2007. All rights reserved.
healthalliance Purpose, Vision and Principles
 Principles Vision Purpose Statement Planning Manager, Procurement healthalliance Purpose, Vision and Principles To be right behind better healthcare. Our role as provider of non-clinical services to the
IS Kawerau Electricity Resource Background Study
 1. Background IS Kawerau Electricity Resource Background Study New Zealand s electricity sector is broken down into four main parts: Generation: Various entities generate electricity at plants throughout
C5B Technical Annex 10 Leakage Investment Case: Technical Approach and Business Case
 C5B Technical Annex 10 Leakage Investment Case: NTPBP-INV-LEA-0535 Contents 1 FOREWORD... 1 2 EXECUTIVE SUMMARY... 2 3 BACKGROUND TO OUR INVESTMENT CASE... 5 3.1 CONTEXT... 5 3.2 STRATEGY... 5 3.3 CUSTOMER
Ergon Energy Investment Plans and restructure
 Ergon Energy Investment Plans and restructure 2014 About Us Distributor & Retailer 33 remote generators 1.7 million sq km area 97% of Queensland 160,000 km of line Small customer base 700,000 $3B Revenue
Transmission Pricing Methodology: CBA
 pwc.co.nz on Transmission Pricing Methodology: CBA Made on behalf of 22 Electricity Distribution Businesses PwC Submission on behalf of 22 EDBs 15 October 2013 Glossary i Submission on Transmission Pricing
Distribution Pricing Methodology Disclosure
 Distribution Pricing Methodology Disclosure CONTENTS Applicable from 1 st April 2018 until 31 March 2019 1 Purpose... 2 2 Definitions... 2 3 Background including Legal Requirements... 2 4 Pricing Strategy...
Work Profile Leadership Position. Purpose. Key Relationships / Interactions
 Work Profile Leadership Position Position Title: Director Growth Position Number: Responsible To: Council Portfolio: Classification Level: Chief Executive Officer Growth Executive Leadership Purpose The
Level 5 NVQ Diploma in Management and Leadership Complete
 Learner Achievement Portfolio Level 5 NVQ Diploma in Management and Leadership Complete Qualification Accreditation Number: 601/3550/5 Version AIQ004461 Active IQ wishes to emphasise that whilst every
Scorecard - Brantford Power Inc. 9/24/2018
 Scorecard - Brantford Power Inc. 9/24/218 Performance Outcomes Performance ategories Measures 21 214 215 216 217 Trend Industry Distributor Target ustomer Focus Services are provided in a manner that responds
Annual Pricing Proposal
 Annual Pricing Proposal for 1 July 2015 to 30 June 2016 Tasmanian Networks Pty Ltd Who is TasNetworks? Regulation of network charges TasNetworks commenced operations on 1 July 2014. It has been formed
POSITION DESCRIPTION
 POSITION DESCRIPTION Role Title: Reports To: Direct Reports: Location: Substation Maintainer Maintenance Supervisor Nil Invercargill POWERNET Our Purpose: Safe Efficient Reliable: Power to Communities
JOB APPLICATION PACK. Customer Experience Manager. Department: Property & Asset Management. 1 P a g e
 JOB APPLICATION PACK Job Title: Directorate: Customer Experience Manager Housing Department: Property & Asset Management Location: Twickenham 1 P a g e Dear Candidate Thank you for your interest in working
ASSET MANAGEMENT PLAN
 The photograph on the cover page illustrates the work and dedication of our line crew in maintaining our network. Contents 1 Executive Summary... 1 1.1 Introduction... 1 1.2 Our Asset Base... 1 1.3 Asset
Apprenticeship Standard for High Speed Rail and Infrastructure (HSRI) Advanced Technician
 Advanced Technician") Context Health and Safety Apprenticeship Standard for High Speed Rail and Infrastructure (HSRI) Advanced Technician Occupational Profile: High speed rail is a specialist occupational area of work. High
Context Health and Safety Apprenticeship Standard for High Speed Rail and Infrastructure (HSRI) Advanced Technician Occupational Profile: High speed rail is a specialist occupational area of work. High
JOB TITLE: Senior Planning and Portfolio Manager Planning Funding and Population Health
 JOB TITLE: Senior Planning and Portfolio Manager Planning Funding and Population Health 1. PURPOSE OF POSITION This position is a key role in the Planning and Funding team. The role is responsible for:
APPENDIX 1 DRAFT REVIEW AGAINST THE CODE OF CORPORATE GOVERNANCE
 APPENDIX 1 DRAFT REVIEW AGAINST THE CODE OF CORPORATE GOVERNANCE 2016-17 Introduction The main principle underpinning the development of the new Delivering Good Governance in Local Government: Framework
Job Description. Background. Date: April No. of reports: Nil. Delegated Financial Authority: (If applicable)
") Job Description Job Title: Management Accountant Date: April 2018 Responsible to: Location: Job Status: No. of reports: Delegated Financial Authority: (If applicable) Finance and Facilities Manager Wellington
Job Description Job Title: Management Accountant Date: April 2018 Responsible to: Location: Job Status: No. of reports: Delegated Financial Authority: (If applicable) Finance and Facilities Manager Wellington
Asset Management Plan.
 Asset Management Plan www.topenergy.co.nz Introduction It gives me great pleasure to present Top Energy Ltd s 2011-2021 Network Asset Management Plan (AMP). The 2011 plan continues directly from the 2010
How mature are electricity distributors asset management practices?
 How mature are electricity distributors asset management practices? Authors: Nick Russ and Tobias Maugg, Commerce Commission 1 Presenter: Nick Russ EEA Conference & Exhibition 2013 19-21 June, Auckland
Service Delivery Manager - CMDHB
 Principles Vision Purpose Statement Service Delivery Manager - CMDHB healthalliance Purpose, Vision and Principles To be right behind better healthcare. Our role as provider of non-clinical services to
Document History. Originator Section Update Details. Version Date Revision Class
 Document History Version Date Revision Class Originator Section Update Details 1.0 09/03/2014 N/A Adrian Searle N/A Initial version (ED1 March 2014 resubmission) Contents 1 Executive summary 3 2 Business
HR Systems Specialist
 HR Systems Specialist Human Resources, Shared Services The HR Systems Analyst is responsible for the upkeep of the HR Information System (HRIS) by Maintaining the HR Information System stability, integrity
CBRM Condition Based Risk Management
 CBRM Condition Based Risk Management Investing in optimal network performance Creating Value through Knowledge Condition Based Risk Management s greatest strength is that it enables users to make more
Scorecard - Centre Wellington Hydro Ltd.
 Scorecard - Centre Wellington Hydro Ltd. 9/28/215 Performance Outcomes Performance Categories Measures 21 211 212 213 214 Trend Industry Distributor Target Customer Focus Services are provided in a manner
Performance Reporting Criteria
 Revision Date: February 2012 Revision No.: 2 Document No.: DOC-131102-ADV Status: Approved by CER Date: 01/03/2012 ESB Networks Ltd. Contents 1. Background... 3 2. Report Headings... 4 3. Criteria... 5
A SUPPORTING DOCUMENT TO OUR 2015 INTEGRATED TRANSMISSION PLAN SERVICES REPORT 2015
 A SUPPORTING DOCUMENT TO OUR 2015 INTEGRATED TRANSMISSION PLAN SERVICES REPORT 2015 Services Report September 2015 ii TABLE OF CONTENTS 1. INTRODUCTION... 1 1.1. Purpose... 1 1.2. Services covered by this
BOARD CHARTER. Owner: Vector s board of directors Approved: August 2016 Review: by August 2018
 BOARD CHARTER Owner: Vector s board of directors Approved: August 2016 Review: by August 2018 Vector Limited is a leading New Zealand network infrastructure company with a portfolio of businesses delivering
ORION NEW ZEALAND LIMITED NOTICE OF REQUIREMENT BROMLEY ZONE SUBSTATION, CHRISTCHURCH
 ORION NEW ZEALAND LIMITED NOTICE OF REQUIREMENT BROMLEY ZONE SUBSTATION, CHRISTCHURCH Date of Issue: 15 July 2014 ORION NEW ZEALAND LIMITED NOTICE OF REQUIREMENT BROMLEY ZONE SUBSTATION, CHRISTCHURCH Prepared
Team Leader Application Services
 Principles Vision Purpose Statement Team Leader Application Services healthalliance Purpose, Vision and Principles To be right behind better healthcare. Our role as provider of non-clinical services to
Quick Guide: Meeting ISO Requirements for Asset Management
 Please visit the NAMS.org.nz website for downloading the digital version of this quick guide. Supplement to the IIMM 2011 Quick Guide: Meeting ISO 55001 Requirements for Asset Management Using the International
DISTRIBUTION SYSTEM ASSET MANAGEMENT APPROACH
 EB-0-0 Exhibit D Schedule Page of DISTRIBUTION SYSTEM ASSET MANAGEMENT APPROACH This document provides a summary of THESL s asset management approach. The first two sections introduce the scope of asset