Visualisations & Active Reports
|
|
|
- Maximillian Franklin
- 5 years ago
- Views:
Transcription

1 Visualisations & Active Reports


2 Presenters James Salmon Marketing Manager Andy Ellis Senior BI Consultant

3 Want to ask a question? We will answer as many as time permits or directly by
4 About Budgeting Solutions Established in 2005 IBM Business Analytics Premier Business Partner Worked with over 200 Blue-Chip Clients Area s we specialise in: Sales, Operations & Finance Extensive expertise working within Finance departments Issues we solve: Planning Budgeting Forecasting Consolidation Reporting Analysis Services we offer: Management Consulting Consulting Training Helpdesk Support


5 Our Customers
6 Agenda Why Visualisations are necessary What do IBM RAVE Visualisations look like What can we do with them Active Reports What are they How are they developed LIVE Deployment Summary Q & A
7 Background Data visualization is not a new concept. How many different ones do you use or see in a day? It has been used for centuries to distil and communicate information. Think about all the maps, graphs and charts in existence, and the popularity of this form of data analysis will quickly become clear. However, with advancements in technology, data visualizations are taking on more complex forms than ever before. They are being used to unravel the meaning behind big data sets that would otherwise be too difficult to understand.

=1000 Gigabytes Petabyte (PB)= 1 Million Gigabytes Exabyte= 1 Billion")
8 Really Big Data Business users are dealing with more data than ever Created by companies: 25% Created by individuals: 75% YouTube: 8.6TB 21PB Twitter: 4TB Facebook: 15TB Daily Amount of Data Created in 2012 = 2.5 exabytes Terabyte (TB)=1000 Gigabytes Petabyte (PB)= 1 Million Gigabytes Exabyte= 1 Billion Gigabytes Source:
9 ..or put another way 90% of the data in the world today has been created in the last two years alone. This data comes from everywhere: sensors used to gather climate information, posts to social media sites, digital pictures and videos, purchase transaction records, road traffic information, and cell phone GPS signals to name a few. This data is big data Data is only as good as the intelligence we can glean from it, and that entails effective data analytics Banks only use a third of their available data because it often sits in databases that are hard to access. We need to find ways to make this data more easily accessible & understandable The best insights come from questions that aren t known until you start to interact with the data.

10 In 60 seconds

11 Visualisations Data locked in a spreadsheet Could have hundreds of pages of similar data printed out to review and make sense of What story is your data telling you? We need something better than traditional BI reporting that is easier to digest


12 Visualisations Anscombe s Quartet A great visualization is worth a million data points Data represented via visualization. Shows the importance of graphing data before analysing it
13 Visualisations

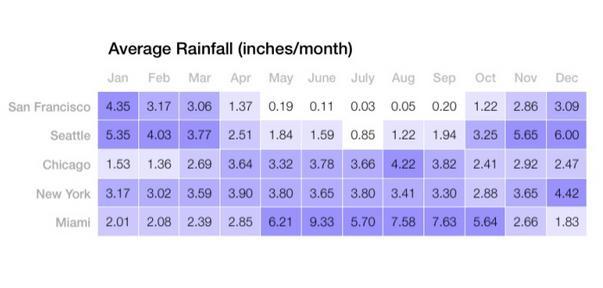
14 Visualisations 60 rows x 28 columns = 1680 pieces of information x 413 pages = plus colour combinations used

15 Visualisation Options Charts Maps RAVE Visualisations

16 Visualisations IBM s new Rapidly Adaptive Visualisation Engine (RAVE) gives us the ability to use new chart types that are more flexible and even animate when used in an Active Report. These are being continually enhanced and are free to download directly from Your Cognos Administrator will be able to install them without going through any upgrade process involving downtime for users Can be used in conjunction with existing chart types in Report Studio, not meant as replacement


17 Visualisations

18 Visualisations Using a Tag Cloud visualisation is very easy requiring one value and one category We can very quickly see that Eyewear is the biggest selling Product Type we have and Sunscreen and First Aid are the weakest.
19 Active Reports
20 What is an Active Report? - Provides an interactive analytics experience in a self-contained Cognos application for browsing and exploring data offline - Report authors can build reports targeted to users needs, keeping the user experience simple and engaging - Mobile workers can take their data with them to discover opportunities and analyze trends even when they are nowhere near a network - Should be used for summarised reports, not large transaction files - Created in Report Studio but different considerations for where it is deployed


21 Active Report Samples available from IBM Cognos Mobile Apple App Store or Google Play Store


22 Collaboration empowers efficient decision-making by bridging insight into action Other vendors: "Users want to share a visualization or a chart for further collaboration, to identify potential places for root-cause analysis or to make recommendations for resolution. At this point in development, however, most of the technology in visual discovery is not able to easily associate comments or bullets to a specific view and then enable sharing or collaboration on it electronically. 1 IBM: Equips business users with easy-touse collaboration capabilities via ability to annotate and share electronically Integrates best-in-class social collaboration techniques Mobile and offline access allows for efficient decision-making at all times Source: Ventana:

23 Active Report Example to build

24 Active Report Example to build

25 Active Report Example to build
26 Active Report Example to build Can be ed to relevant staff Can use report bursting options Open on ipad, iphone, android devices Can look at, navigate and comment upon data and send back Finished version available on request, with accompanying step-by-step notes, to allow you to build back on own systems
27 Summary Why Visualisations are necessary What do IBM RAVE Visualisations look like What can we do with them Active Reports What are they How are they developed LIVE Deployment Summary Q & A
28 Technical Webinar Series Dates in Crosstabs within Reports 30 th July 11am
29 Training Academy Prices start from 995 per day for up to 6 people on site, or hosted at our Nottingham central office. To view more of our training courses visit the website: amanda.gibson@budgetingsolutions.co.uk Call:

30 Q&A