Seattle City Light Outage Management System. May 2014
|
|
|
- Horace Snow
- 5 years ago
- Views:
Transcription

1 Seattle City Light Outage Management System May
2 Objectives for this Presentation Overview of the drivers for the Outage Management System Describe the system and the implementation Summarize the lessons learned Going forward 2

3 Service Area Population 780,800 Service Area Size sq. mi. Personnel 1,811 Meters 410,474 Customers Residential 362,572 Non-Residential 39,964 Major Substations 15 Unit Substations 5 Commercial and Industrial Substation Transformers 57 Transmission Circuit Miles 656 Distribution Circuit Miles 2,308 3

4 Remember the Storm of 2006? Account Executive: I can t tell our major customers when the power will be restored. Communications: I need a quicker and bigger picture of the storm situation. Call Center: The same customers keep calling yet I don t have the updates for them. Field Operations: I cannot predict how many crews are needed and I would like to better plan for Mutual Aid. 4
5 Scope of Damage and Repairs 49% of customers lost power 65 feeders were down 89 poles down 34 miles of wire down 100 transformers replaced 40 line Crews mobilized and 10 tree crews 58,00 hours logged over 8 days for restoration operations 5

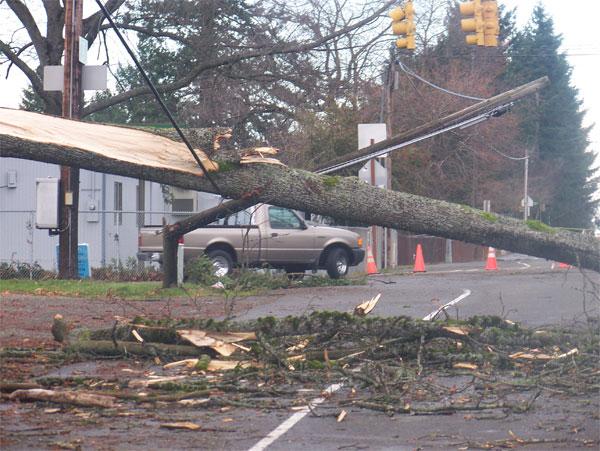
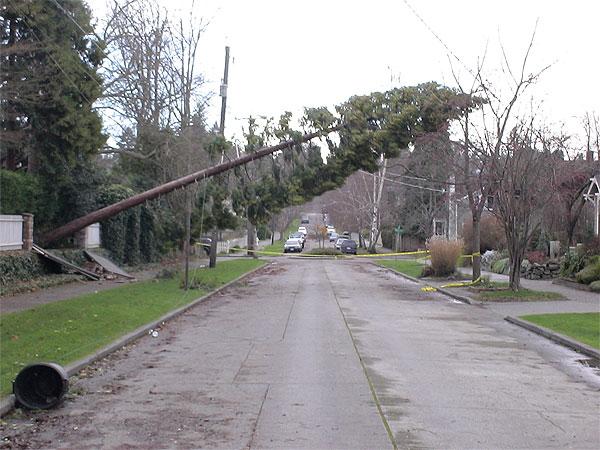
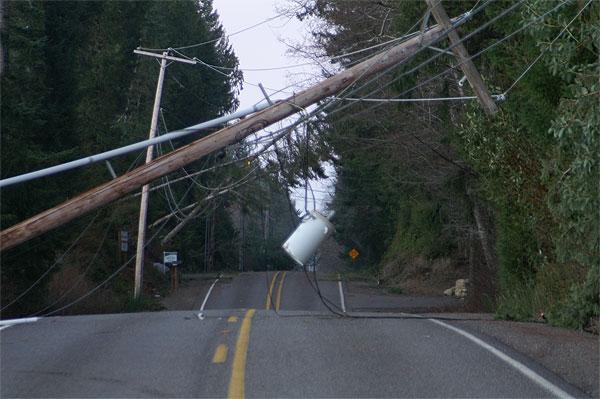
6 2006 Storm Event 6
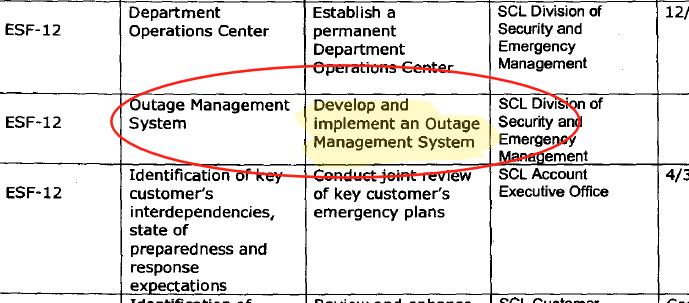

7 Recommendations from post storm evaluation 7
 Outage assignment and dispatch to crews Map viewing of outage")
8 Key Functionalities Management of daily planned and unplanned outages Management of major storm events Mutual aid analysis Predictive model of Estimated Time of Restoration (ETOR) Outage assignment and dispatch to crews Map viewing of outage information 8

9 Benefits of OMS Internal Benefits Enables a Utility wide view of outage restoration activities Sorts and prioritizes outage information automatically Includes "predictive" engine to refine *ETOR Optimizes dispatch of crews Customer Benefits Provides more current information about an outage or service call Provides improved *ETOR to customers Supports better use of the **IVR system for outage information Provides for customer call backs when requested Reduces restoration times for major storm events * ETOR = Estimated Time of Restoration ** IVR = Interactive Voice Response 9

10 Data and System Integration 10
11 Service Alerts for Major Customer 11

12 System Status Map 12
13 Capabilities Gained Outage map visible to all customers to see current outages, predictions for restoration time, and causes of the outage. The dispatchers update the OMS including the maps as the operators record device operations, record causes, and estimate restoration time. IVR provides outage status, estimated restoration time, allows them to report outages that go directly into the System, allows callbacks when power is restored. OMS provides faster outage information to users outside of the System Control Center to avoid calls to them during outages. Alerts go out instantly to Utility personnel as outage calls come in and the system groups outages to devices, thus predicting scope of the outages. 13
14 Some Challenges to the Project Aggressive project schedule Many new technologies implemented eg, for the integration points, Service Oriented Architecture. City Light had 2 Geographical Information Systems one an ESRI system for the looped radial distribution system and a home gown system for the downtown network. Only one was implemented. The model build process takes an extensive amount of time due to an old integration and laborious extract, load and validation process. Inadequate BI tool, so system didn t provide viable reports; result redundant entries for the dispatchers. Concurrent with another major implementation for work and asset management. 14
15 Lessons Learned Training: best developed with user involvement GIS incremental build should have been tested earlier in the process. Staffing determine who should manage further development of the process and the product after go live. Permanent position should have been created from business groups. Processes Should be reviewed and continually improved e.g., the ETOR updating process. 15
16 More lessons learned Business Intelligence: Verify the functionality that the vendor is promising early on in the project. You don t always get what you thought you were getting! BI is technically challenging and it s hard to get vendor support with BI expertise. BI should have been an integral part of the original planning Reporting should have been part of project design work 16
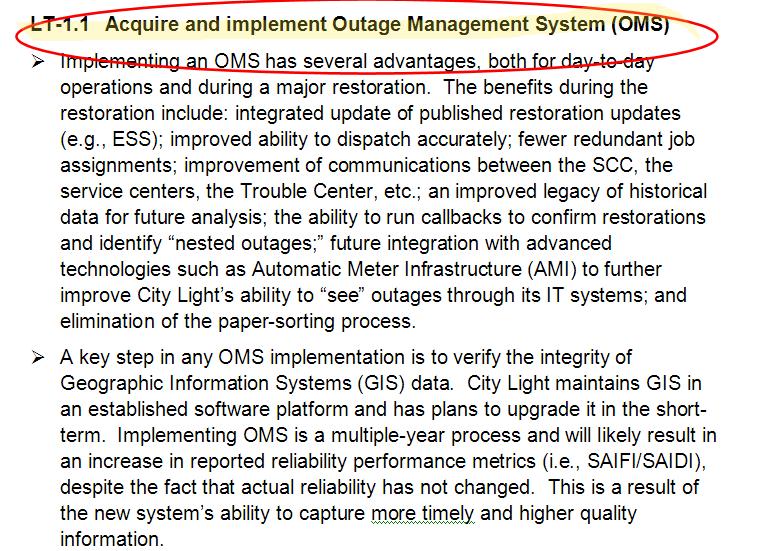
17 Planned and Current Implementations Upgrade OMS to version 1.12 implement 2016 Switching module Upgrade looped radial GIS implement 9/14 Upgrade Network GIS implement 12/14 Enterprise GIS: unify both systems implement 2018 Energy Management System implement 2016 Mobile Workforce implement 2016 New billing system go live 10/15 Meter Data Management go live 10/15 Automated Metering Infrastructure implement 2017 Autocad Utility Design implement 2016 Substation Automation implement
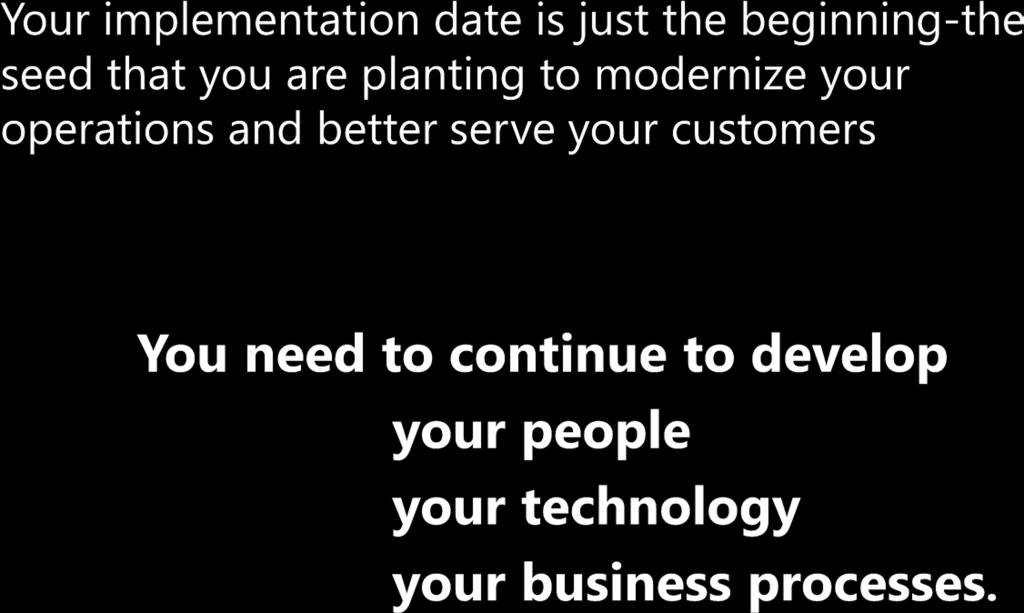
18 Challenges of Moving Technology Targets Challenge for internal resources Will need more technical people and seasoned project managers Integrating the projects to minimize impact; planning for dependencies between them Budgetary strain Managing numerous vendors and contracts Planning for the maintenance of all these systems how to staff? 18


19 Final Points 19