Turning Insight into Action
|
|
|
- Jasmine Phelps
- 5 years ago
- Views:
Transcription

1 Turning Insight into Action Presented by Don Smith OSIsoft 1
2 What we have been doing Highlights of the PI System Scaling Reliability/HA Portal, rich client Partners 2
3 Insight tools Trends Analytics Context, PI AF, PI Batch 3


4 Data Connectivity Servers Data Access Information Analytics Trending Graphics Reports Insight Humans Models Systems Action Autonomous Workflows Schedule Hard work 4

5 . 5
6 Business are faced with challenges Production and operation costs Sustainability in all aspects of their business Respond to customer demands Innovate on products, operations, marketing Act on emerging opportunities 6
7 Today s Business Faces Exponential quantities of data Need to respond and make decisions in real-time Global demand and competition Rapidly changing technology Are you listening to your data? 7


8 PI System 2010 Windows Integrated Security PI Notifications PI Asset Framework PI Analytics PE Totalizer PI ACE PI Archives High Availability 64-bit product Real-time Interfaces Virtualization Real-Time Data DCS / PLC / SCADA / OPC HISTORIANS / INTERFACES Custom Data APIs / SDKs IT Data IT MONITOR Relational Data OLEDB / ODBC SQL SERVER / ORACLE Web Services SOA / EXTERNAL DATA LEGACY APPS 8
9 Smart Grid Enabled by Real-time Data Optimized Asset Operations and Maintenance Asset operating conditions Enterprise-wide access to all real-time operational data Fuel Optimization Transformer Load Monitoring Condition Based Maintenance from operational data across Generation, T&D and Renewable Fuel Vendors Transport Equipment Vendors Asset Safety & Compliance Environmental data monitoring and alerting Wide Area Grid Monitoring -Phasor monitoring of Transmission Lines Asset Management Asset Owners External Services Production Asset Visibility & Performance Production Management Trader Regulator Transmission System Operator Operation decision support considering technical constraints as well demand and economic data Energy Portfolio Management Support trading and ISO boards for overall demand response data analysis 9
10 Utility Business Model Evolution Energy Delivery Energy Delivery + Energy Information Management 10

11 Data, Data, and More Data Potential data growth from Smart Grid including home networks AMI and Smart Grid will increase the amount of measurement and control points far beyond anything we have today. How can we leverage this data to compete? 11


12 Proliferation of People & Devices 2013 There Will Be ONE TRILLION Devices Connected to the Network, up from 35 BILLION in 2010 Cisco IBSG 12

13 Saudi Aramco 13

14 Saudi Aramco 14


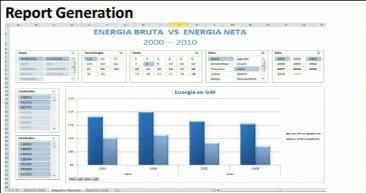
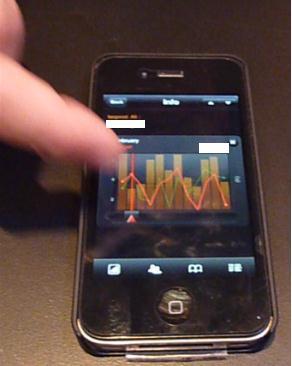
15 PI System Clients Visualization Tools 15

16 California ISO Monitoring Center 16

17 California ISO Monitoring Center 17

18 Context-based Displays using PI AF 18

19 PJM 19


20 Complex Event Processing (CEP) StreamInsight Development in C#, LINQ Event sources StreamInsight Application or Hosted Query Event targets Web servers Input Adapters StreamInsight Engine Query Logic Query Logic Output Adapters Pagers & Monitoring devices KPI ` Dashboards, SharePoint UI Event stores & Databases Query Logic Trading stations Stock ticker, news feeds Event stores & Databases 20
21 Customer Use Case: User Scenarios Time Window Detect pattern-based process data events (e.g. limit exceeded) in moving time windows and report the non-conformance immediately 21
22 Customer Use Case: User Scenarios Data Quality Analyze high speed process data and associated diagnostic information to identify suspect data; call routines to cleanse suspect data and output the processed data and diagnostic information; recognize critical events that need to be passed on immediately. 22


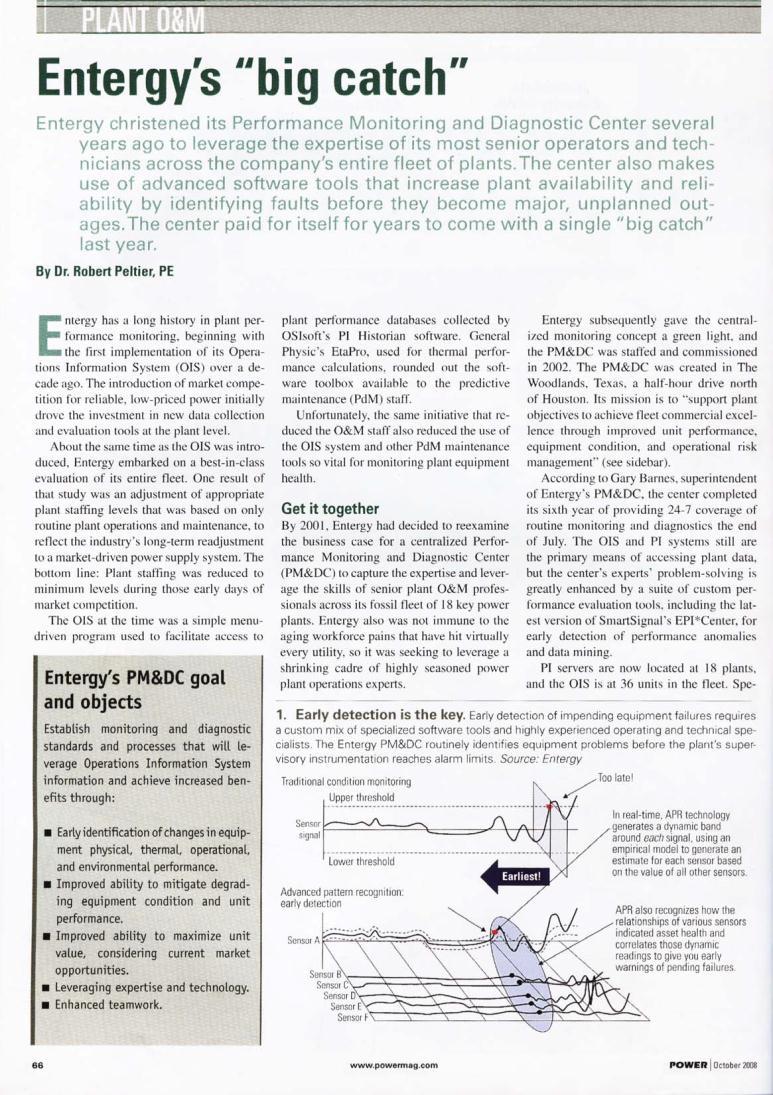
23 Microsoft Power Pivot 23

24 24


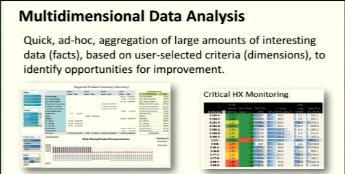
25 Customer Use Case : CFE 25


26 Customer Use Case : CFE Sharepoint, PowerPivot with PI System 26


27 In-Memory Computing SAP HANA Centrica Customer analysis Meter data for OSIsoft OSIsoft PI System SAP EERM for Energy Management 27
28 Turning Insight Into Action Data Information Insight Action 28


29 Refinery Operations 29

30 PI Coresight 30


31 PI Coresight Can be standalone or combined on another machine Minimal Client Footprint LCD Panel PI Server 2010 PI Coresight Application Server Smart Phone Tablet PC Projector Data Collection & Buffering Laptop 31
32 Sustainability Real-time Data maps to Sustainability By balancing social, environmental, and economic risks and opportunities, you can reduce waste, save money, and more importantly, protect your brand. Executive Management Environment, Health & Safety Operations Benchmarking and Analytics Environmental compliance Facilities Energy Management Process Safety Production Energy Management Supply Chain Traceability and Recall Green Logistics Smart Grid Participation Carbon Management Product and Asset Product Quality Asset Management Water Management Product Carbon Footprint Consumers Residential Energy IT Green IT OSIsoft PI System 32
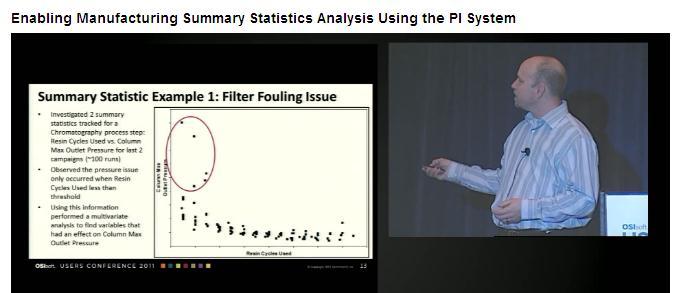


33 Genentech Transforms Data with Statistical Modeling 33

34