Epicor EPM. The Future for Common Reports
|
|
|
- Noah Stafford
- 5 years ago
- Views:
Transcription


1 Epicor EPM The Future for Common Reports
2 The more people within a business who have access to the benefits of quality BI, the better equipped organizations will be to respond to, and take advantage of, opportunities and shifts in their business environment.
3 DSPanel DSPanel is a Swedish company, founded in 1999 and headquartered in Stockholm. It delivers a BI platform capable of integrating with Microsoft SharePoint and explore Analysis Services, SAP BW and IBM Cognos Cubes.
4 Performance Management EPM Performance Canvas EPM Canvas Planning Dashboards Budgeting Analytics Planning Scorecards / reporting Reporting

5 Performance Management DSP Performance Canvas DSP Canvas Planning Dashboards Budgeting Analytics Planning Scorecards / reporting Reporting
6 Truths? Reports are dull but necessary. Business Intelligence creates a compelling management view to report data. Budgets, Plans and Forecasts are done in Excel and then input into the ERP system to be able to report actuals versus plan.
7 Evolution and Tradition Reports Uses report software to create reports from one system at the time. Reports are adjusted in Report configuration tool. If reports need to be augmented they are imported into Excel where adjustments are made. Business Intelligence Data replicated from the core systems (often more than one) and re-organized to be easy to understand and fast to retreive Nice and management friendly software is used to retreive the data creating a platform for analysis and view. Budgets, Plans and Forecasts Are mostly made in Excel, then later punched back into the ERP system to be used for Reports. Some companies are using separate systems for the purpose of Planning. Most often these systems are not used for Reports.


8 A New Kind of Report Reports BI? Plans
9 Reporting and Analysis EPM PERFORMANCE CANVAS
10 What is Epicor EPM Performance Canvas? Canvases are visual displays Display the information needed to achieve specific objectives Fit on a single computer screen Enable to monitoring information at a glance Have small, concise, clear, and intuitive display mechanisms Are customizable
11 Trend visualization

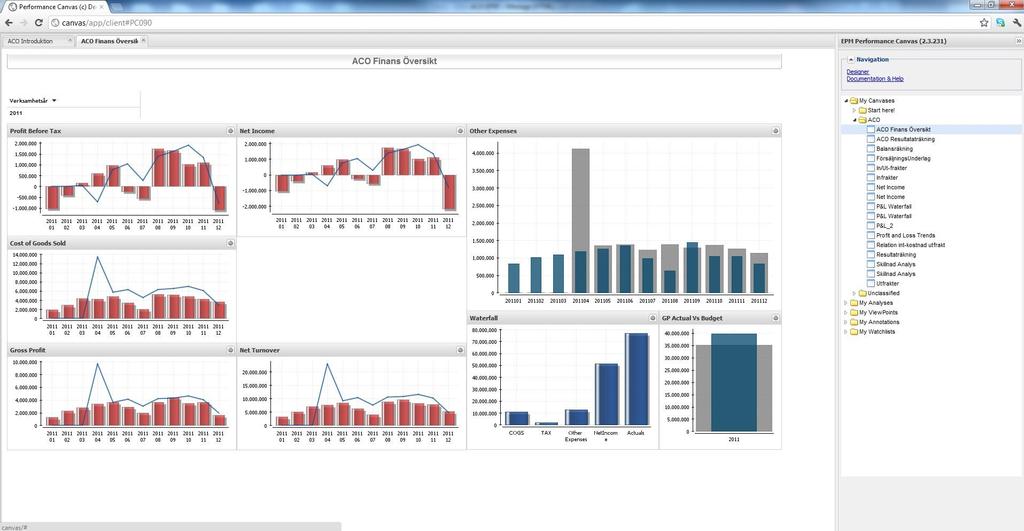
12 Report Canvas with KPI s

13 DSPanel terminology Canvas A canvas is the container of your creativity for objects created within Performance Canvas similar to the term Dashboard. These Canvases are consumed in different ways and context. A Canvas can interact and be used for different purposes like Microsoft SharePoint, Web, Mobile, embedded in other applications etc. Slicer A Slicer is the tool to select what information to see in the Gems displayed on the Canvas. You drag a Slicer into your Canvas to create a way to select what information to view. Slicers are also used as you design your Gems connecting the selection criterias.there are several types of slicers and possible configurations Gem Dimensions + Measures + Power of Visualization = Gem Individual BI components you can save and reuse to create unlimited number of dashboards, mashboards and scorecards. It s a Powerful BI interface, allowing you to create and modify data visualizations using drag and drop or MDX logic 13
14 Live overview Empowerment of the business user Agile BI Business gems creating foundation to re-usable solutions Mobile BI Mash boards, Planning canvases 14
15 EPM EDUCATION PERFORMANCE CANVAS BASICS

16 Canvas Every type of Performance Dashboard designed with the product is a Canvas. EPM PLATFORM OVERVIEW 2008 Epicor Software Corporation.
17 Data source A Data Source in Performance Canvas is a defined source of data in the administrative tool of the product. EPM PLATFORM OVERVIEW 2008 Epicor Software Corporation.

18 Gem A gem is a piece of your Business and a term in it. It can be represented as a table or a graph. EPM PLATFORM OVERVIEW 2008 Epicor Software Corporation.
19 Slicer A Slicer is the tool to select what information to see in the Gems displayed on the Canvas. EPM PLATFORM OVERVIEW 2008 Epicor Software Corporation.
20 GEM & SLICER TYPES


 Table (Standard, KPI table,")
21 Gem Types Chart (Bar, Layered bar, Stacked bar, Pie, Line, Time series, Area, Waterfall, Gauge, Bubble, Scatter plot, Difference, Spider web, Candlestick, 3D Bar Chart, 3D Pie Chart, 3D Line Chart, Pareto, Heat Map, Stacked area, Stacked 3D bar, Ring, Bullet graph, Sparkline) Table (Standard, KPI table, Sparklines)
22 Hierarchy Slicer Types Mapped to a hierarchy in the cube. Level Consists of a selected member from a hierarchy. Member Consists of the member of a certain level in a hierarchy.
23 Main Menu
24 Contents of the Main Page Admin Console Designer Documentation & Help
25 EPM PLATFORM OVERVIEW 2008 Epicor Software Corporation. Admin Console

26 EPM PLATFORM OVERVIEW 2008 Epicor Software Corporation. Designer

27 EPM PLATFORM OVERVIEW 2008 Epicor Software Corporation. Documentation & Help
28 Epicor EPM The Future for Common Reports