Bank of America-Merrill Lynch 2015 Services One-on-One Conference New York, NY. May 13, 2015
|
|
|
- Lynette Heath
- 5 years ago
- Views:
Transcription

1 Bank of America-Merrill Lynch 2015 Services One-on-One Conference New York, NY May 13,
2 Safe Harbor Statement The information provided in this presentation (both written and oral) relating to future events are subject to risks and uncertainties, such as competition; changing market and economic conditions; currency fluctuations; changes in laws and regulations, including tax laws, and other factors discussed in the company s SEC filings. These documents contain and identify important factors that could cause actual results to differ materially from those contained in our projections or forwardlooking statements. 2
3 3

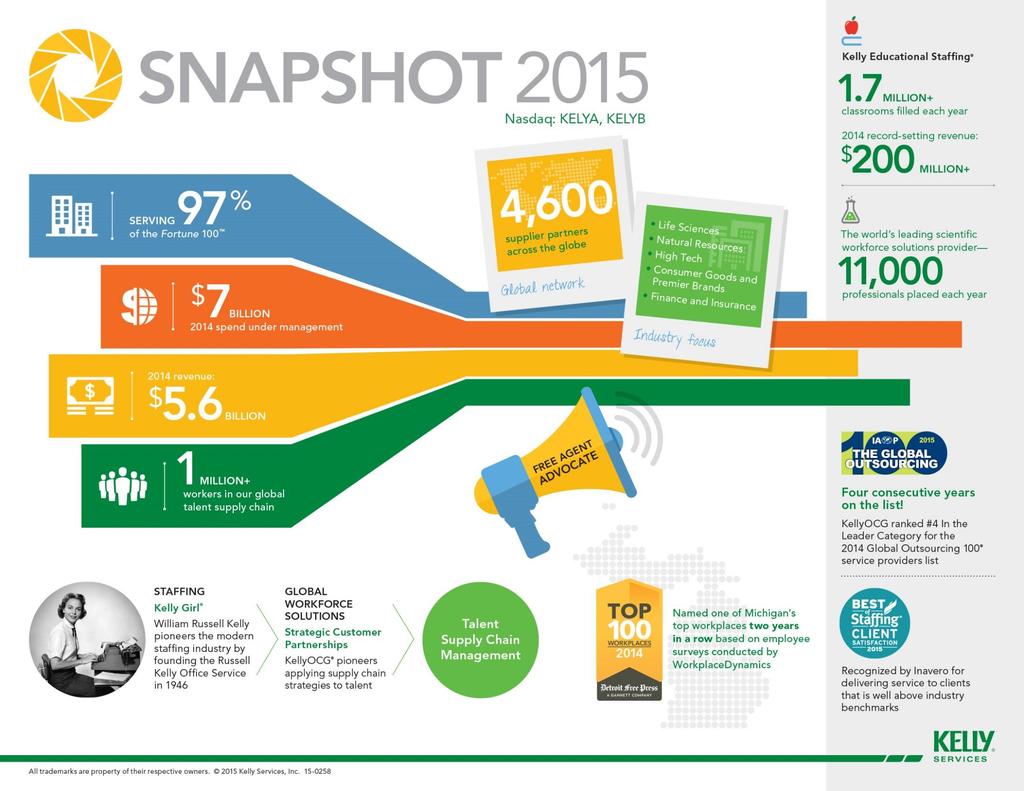
 Managed Solutions Contingent Workforce Outsourcing (CWO) Executive Coaching and Development Global")
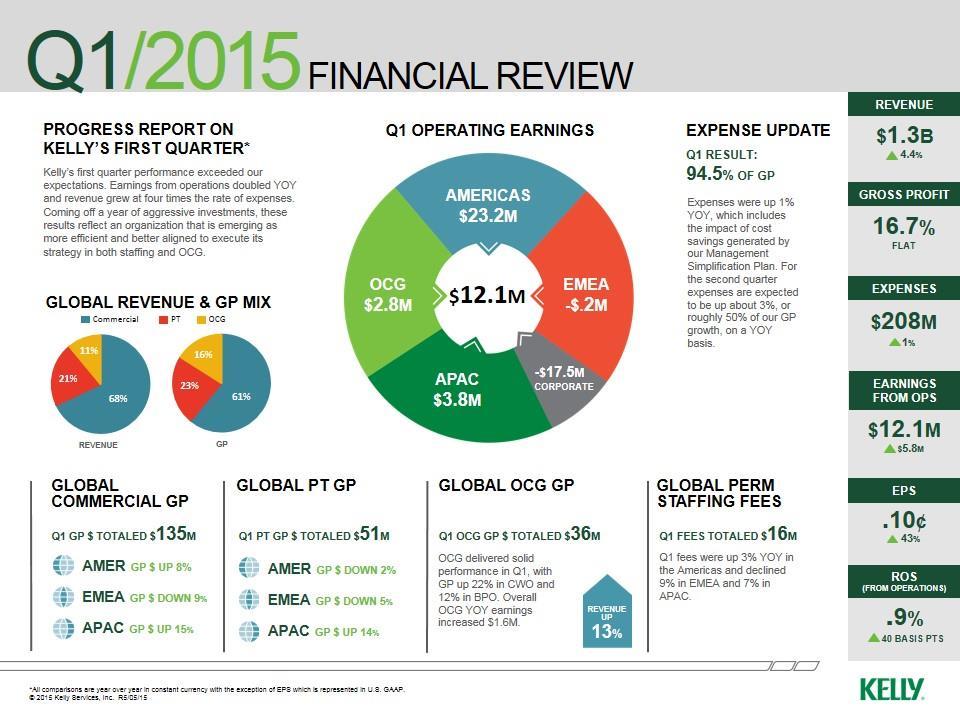
4 Portfolio of Solutions Commercial Staffing Office Services Light Industrial Electronic Assembly Marketing Contact Center Educational Services Professional & Technical Staffing Science Engineering IT Finance Law Healthcare Creative Services Revenue 68% 21% 61% of GP 23% of GP 11% 16% of GP Outsourcing & Consulting Recruitment Solutions Recruitment Process Outsourcing (RPO) Project Solutions Business Process Outsourcing (BPO) Managed Solutions Contingent Workforce Outsourcing (CWO) Executive Coaching and Development Global Consulting 4
5 Kelly s Strategy Pursue High-Margin PT Aggressively Grow OCG Maintain Commercial Core Capture Perm Placement Control Expenses 5
 Realigned PT recruiters by niche (vs.")


6 2014 Strategic Investments U.S. Branch Network Centralized Accounts Talent Supply Chain Created national PT recruiting centers led by specialty recruiters (vs. ops leaders) Realigned PT recruiters by niche (vs. geography) Hired additional niche PT sales resources Implemented customized training and new performance standards for all PT recruiters/sales staff Completed transition of targeted large accounts into centralized model Increased number of specialty recruiters; additional resources to be added in 2015 Implemented aggressive performance requirements for recruiters Aligned recruiting and sales verticals to drive PT growth in large accounts Expanded IC/Statement of Work solution to meet increased demand for project-based work Developed supply chain analytics to provide market insight to customers Closed the gap in our ability to design truly global solutions across 50+ countries GROWTH Total 2014 investment spend was $21M - ($6M Capital & $15M Expense) 6
7 2014 Restructuring Plan Americas $20M Streamlined U.S. Operations by closing 52 U.S. branches Simplified management structure at all levels Optimized large account delivery structure Corporate $12.0M Simplified world headquarters operations OCG $3M Continued to align OCG more efficiently against ROI = $35M taken out of 2015 cost base 7
8 2015: Branch Network PT Growth Strategy Focus on markets where we re most likely to succeed Use niche-specific sales teams to win higher-margin PT business Use national network of specialty recruiters to create higherskilled talent pipelines in IT, Engineering, Science, Finance Q1 Highlights Gaining traction from new PT recruiting model Q1 PT revenue up 4% year-over-year in U.S. branch network (compared to -5% in Q4) Number of new PT orders trending positively into Q2 Improved productivity and efficiency 8

9 2015: Centralized Account PT Growth Strategy Optimize our centralized model Leverage relationships with established Kelly clients Ensure quantity and quality of recruiters Diversify PT portfolio across centralized accounts Increase PT fill rates in vendor-neutral accounts Q1 Highlights PT revenue down 4% year-over-year due to large project completions Sequential increase in PT order volumes heading into Q2 Improved productivity and efficiency, along with flexibility to quickly scale up or down in response to the level of demand 9
10 2015: OCG Growth Strategy Expand talent supply chain solutions - Meet increased demand for project-based work - Provide customers market insights into labor supply & demand - Customize solutions across regulatory requirements of 50+ countries Leverage opportunities within existing centralized accounts Invest in areas that will deliver rapid ROI Q1 Highlights Operating earnings more than doubled over last year Revenue grew by 13% year-over-year in constant currency Gross profit increased 10% year-over-year in constant currency 15-20% growth expected in


11 Talent Supply Chain Management CORPORATE STRATEGIC PLAN Temporary Staff OPERATIONS Independent Contractors / Freelancers HUMAN RESOURCES WORKFORCE ANALYTICS STRATEGIC WORKFORCE PLANNING Talent Supply Chain Management Service Providers (SOW) PROCUREMENT Full Time Employees Alumni, Retirees and Interns Kelly Services, Inc. 11
12 Q1 **
13 OCG Growth (Operating Profit) (in millions) $12 $10 $9.7 $8 $6.8 $7.5 $6 $4 $2 $1.3 $1.7 $4.9 $4.0 $2.5 $1.2 $1.8 $3.6 $2.8 $0 ($2) -$0.9 1Q12 2Q12 3Q12 4Q12 1Q13 2Q13 3Q13 4Q13 1Q14 2Q14 3Q14 4Q14 1Q15 *Excluding Restructuring & Impairment Charges. 13
14 OCG Growth (Gross Profit) (in millions) $45.0 $42.3 $40.0 $35.0 $34.8 $36.5 $35.8 $35.5 $30.0 $29.2 $32.6 $32.9 $25.0 $27.7 $20.0 1Q13 2Q13 3Q13 4Q13 1Q14 2Q14 3Q14 4Q14 1Q15 14
15 2015 Outlook Revenue up 5% - 6% YOY in constant currency Gross Profit Rate up YOY SG&A up about 3.5% YOY Annual tax rate expected to be in the low 40% range, excluding Work Opportunity Credits; If WOC is renewed, our rate is expected to be 20 percentage points lower 15
16 2014 Total Expenses $ 875 Change Management Simplification Initiative $ (35) US PT Investments (2014 and 2015) 10 Revenue Related Cost: 39 $15M in Staffing $24M in OCG Other Expenses $ Total Forecasted Expenses $ 906 Total Year-over-Year Increase 3.5% (in $millions USD; constant currency; excluding restructuring; at 2014 currency rates) 16
")
17 Q Outlook Revenue up 4% - 5% YOY in constant currency Gross Profit Rate up YOY and flat sequentially SG&A up about 3% YOY (about 50% of our GP growth) 17
18 Operations Summary: Q Kelly Services Sales $ 1,321 GP $ 220 Expenses $ 208 Profit $ 12 ROS 0.9% Americas EMEA APAC OCG Sales GP Expenses Profit $ 874 $ 137 $ 114 $ 23 Sales GP Expenses Profit $ 219 $ 33 $ 34 $ (0.2) Sales GP Expenses Profit $ 96 $ 16 $ 12 $ 4 Sales GP Expenses Profit $ 150 $ 36 $ 33 $ 3 ROS 2.7% ROS (0.1)% ROS 3.9% ROS 1.9% (in $millions USD) 18
19 Revenue by Quarter (in billions) $1.8 $1.7 $1.6 $1.5 $1.4 $1.3 $1.2 $1.4 $1.4 $1.4 $1.3 $1.5 $1.4 $1.4 $1.3 $1.1 $1.0 Q1 Q2 Q3 Q4 Q1 Q2 Q3 Q4 Q1 Q2 Q3 Q4 Q Nominal Currency Constant Currency 19


20 Constant Currency Revenue Growth by Segment 40% (Q1 2015) 35% 34.1% 30% 25% 20% 15% 12.5% 12.6% 10% 5% 4.4% 6.2% 2.2% 0% -5% Total -1.1% -1.8% Americas EMEA APAC OCG Commercial PT Commercial PT Commercial PT 20
21 Staffing Fee Income by Quarter (in millions) $30 $25 $25 $26 $20 $21 $21 $20 $20 $18 $16 $15 $10 $5 $0 Q1 Q2 Q3 Q4 Q1 Q2 Q3 Q4 Q1 Q2 Q3 Q4 Q *Beginning in Q1 2013, OCG fees have been excluded from Staffing Fee Income. 21
22 Gross Profit Rate by Quarter 18.0% 17.0% 16.8% 16.7% 16.7% 16.7% 16.5% 16.3% 16.2% 16.5% 16.1% 16.4% 16.2% 16.1% 16.3% 16.0% 15.0% Q1 Q2 Q3 Q4 Q1 Q2 Q3 Q4 Q1 Q2 Q3 Q4 Q
23 Expense by Quarter (in millions) $230 $225 $222 $224 $220 $215 $210 $208 $205 $209 $208 $200 $195 $200 $190 $185 Q1 Q2 Q3 Q4 Q1 Q2 Q3 Q4 Q1 Q2 Q3 Q4 Q *Excluding Restructuring, Impairment & Certain Litigation Charges. 23
24 Return on Sales by Quarter (in millions) 2.0% 1.8% 1.6% 1.4% 1.6% 1.5% 1.2% 1.0% 0.8% 0.6% 0.8% 0.9% 0.4% 0.2% 0.0% 0.5% Q1 Q2 Q3 Q4 Q1 Q2 Q3 Q4 Q1 Q2 Q3 Q4 Q *Excluding Restructuring, Impairment & Certain Litigation Charges. 24
 $250 $222.3 $8.5 $230.8 $216.0 $2.3 $218.")
25 Comparison of Gross Profit & Expense: First Quarter (in millions; in constant currency; at 2014 currency rates) $250 $222.3 $8.5 $230.8 $216.0 $2.3 $218.3 $200 $150 $100 $50 $ Gross Profit Expense
26 Cash Flows: as of March 29, 2015 (in millions) Net Income $ 3.7 $ 2.5 Other Cash Used in Operating Activities (20.1) (93.3) Capital Expenditures (2.6) (3.3) Free Cash Flow $ (19.0) $ (94.1) Borrowing (11.0) 26.5 Available Cash Flow $ (30.0) $ (67.6) Dividends (1.9) (1.9) Other (0.2) (0.5) Cash Used $ (32.1) $ (70.0) Effect of Exchange Rates (1.6) 2.2 Net Change in Cash $ (33.7) $ (67.8) Cash at Period End $ 49.4 $
27 Balance Sheet: First Quarter (in millions) Cash $ 49.4 $ 57.9 Accounts Receivable 1, ,080.2 Other Current Assets Total Current Assets $ 1,233.1 $ 1,228.9 Long Term Assets Total Assets $ 1,866.3 $ 1,804.4 Short Term Debt $ 80.6 $ 54.8 Other Current Liabilities Total Current Liabilities $ $ Other Long Term Liabilities Equity Total Liabilities and Equity $ 1,866.3 $ 1,804.4 Working Capital $ $ Net Cash $ (31.2) $ 3.1 Debt-to-Total Capital 8.8% 6.2% 27

28 Kelly Services: Company Contacts George Corona Executive Vice President & Chief Operating Officer Olivier Thirot Senior Vice President and Acting Chief Financial Officer James Polehna Vice President, Investor Relations & Corporate Secretary kellyservices.com 28