USERS CONFERENCE Copyright 2016 OSIsoft, LLC
|
|
|
- Meagan Powers
- 5 years ago
- Views:
Transcription

1


2 PI Coresight 2016: New Vision, New Display Editor, New Look & Feel Presented by Chris Nelson Tom LeBay Eugene Resnick

3 Customer Driven Research & Design +130 interviews averaging +90 minutes each 3
4 What did you tell us? Integrated Experience Analytics + Displays Events 2 + Displays From what I can Assets 2 see, you guys aren t even looking back + Displays at ProcessBook, you re just saying OK, what do we need? To Notifications me, it looks like + a Events brand + new Displays clean sheet of paper. <<OSI: Is there any validity to doing anything in combination, that has math or averaging <<OSI: or Event/Time an analytic Comparisons is this a valid / Overlay scenario?>> Trends>> I think Man, the <<OSI: I user can t is tell would there you value kill how in this for powerful concept that of too. collections? that Turning is, that s this into awesome. something Just that the would fact that help you re me on start that functionality out is awesome. That s awesome. You <<Event know Yeah, driven how there s we visualization get total around & analysis>> value that in right that, a an equation set, I think they would love that now? LOT What of we value do is put that. two <OSI: trends Why?> right Because above we re piece. another constantly and carefully developing The get engineer them and aligned adding needs and to things know move like what 6 steam went into alarm. timeframes generators around in Then and one then field based in compare on the this next them they few dive and months into get which further analysis scaling means right we it s need around an to awful update that pain event. all in those the It s butt. screens. kind This of a is notification We have a to the awesome ton [50] that of you re iconics engineer. thinking screens about <OSI: and this. what then does PB he on do top when of he that. dives I m into the analysis?> just one person He would and I m dive busy into enough the lube trying oil system to do ACE screen, click on calculations cohesive and his environment. trends create and the PI everything points and is assets right there. in AF. <OSI: so, if you had a way of tying an event frame to a display > Yeah, that would be the cat s meow. And the nice thing about it is you re incorporating all the functionality that you guys have thrown into PI notifications, events, and blah blah blah now it s one 4
5 What did you tell us? People want their data where they are, not where the system is that ability for an end user to be able to go in and configure it and get an integrated experience has not been there I have a tough time selling ProcessBook internally because it's powerful but to the end users it looks heavy and old and other tools have 5% functionality but looks better and works over the web and they win. 5
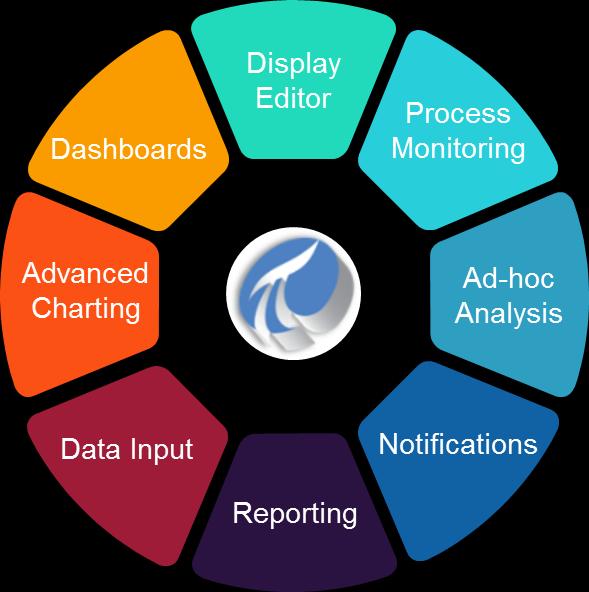
6 Modern visualization infrastructure Dashboards Display Editor Process Monitoring Advanced Charting Ad-hoc Analysis Data Input Reporting Notifications 6
7 Modern visualization infrastructure Making these capabilities available for Dashboards Display Editor Process Monitoring Extensibility Office productivity Advanced Charting Ad-hoc Analysis Portal integration Data Input Notifications Reporting 7


8 A single tool for your visualization needs Today Tomorrow PI ProcessBook Display Editor Process Monitoring Dashboards Display Editor Process Monitoring PI Coresight Ad Hoc Analysis PB Display Viewer Advanced Charting Ad-hoc Analysis PI WebParts Dashboards Data Input Notifications PI Manual Logger Manual Data Entry Reporting 8


9 Modern Visualization for the Modern PI System Authoring Monitoring Manual Entry Ad Hoc Analysis Time Series Assets Events Analytics Notifications 9


10 A truly extensible visualization infrastructure Partner EcoSphere OSIsoft Teams Partners Customers 10


11 There are changing landscapes in the marketplace Mobile Business Analytics Industrial IoT Community People want their data where they are; not where the system is. ~ PI Customer ~ Without big data, you are blind and deaf in the middle of a freeway. ~ Geoffrey Moore ~ As the next evolution of computing, the Internet of Things market will be bigger than all previous computing markets. ~ Unknown ~ I m not interested in your data; I m interested in merging your data with other data. Your data will never be as exciting as what I can merge it with. ~ Tim Berners-Lee ~ 11
12 PI Coresight Roadmap H 2H 1H 2H NEW DISPLAY EDITOR Create and view full graphical displays from anywhere on any device and solve problems with ad hoc capabilities. NOTIFICATIONS & EVENT ANALYSIS Be notified of issues happening in real-time, see event details, and analyze the event. Perform advanced searches on events facilitating batch event comparison and other analyses. EMEA UC (Berlin) INTEGRATED VISUALIZATION PLATFORM Full integration with the modern PI System and the capability for partners and developers to create rich application with extensibility. Displays Time Series Events Notifications Analytics Assets Data Entry INTEGRATED VISUALIZATION PLATFORM TBD EMEA UC (?) UC2016 (SF) UC2017 (SF)
 - Functional requirements; use case definitions - Alignment with Architecture and Portfolio - Product Management focal point; EA focal")
13 PI Coresight User Champion Cyndi Bourne Royal Dutch Shell PI System Product Owner - Enterprise oversight of initiatives and demand for PI System - PI SME (Subject Matter Expert) - Functional requirements; use case definitions - Alignment with Architecture and Portfolio - Product Management focal point; EA focal point


 Downstream:")

14 A look at Shell Using the PI System for over 20 years ~250 PI systems, ~2000 servers, ~30K users Upstream: >200 assets/sites (incl. Unconventionals, Integrated Gas, Deep Water, In-Situ, Wind, Drilling, etc.) Downstream: >20 refineries/chemicals, Heavy Oil, Trading, Pipeline Projects & Technology: Research centers, IT Support of PI Systems

15 Your ideas matter


16 Integrating Customer Feedback into the Product
17 What is PI Coresight? The fastest, easiest way to visualize PI System data Thin client application delivered through any modern browser Rapid deployment Supports collaboration and information sharing Easily integrated into other web applications


")

18 PI Coresight Architecture -Access your data everywhere PI Server(s) (PI Data Archive & PI AF) PI Coresight Application Server PI ProcessBook Displays
 (PI Data Archive & PI AF) Server-side update so all clients are at the same software version Usually provides a performance improvement, especially")
19 PI Coresight - a better model for a connected world Extra security layer between attackers and your critical systems PI Coresight Application Server PI Server(s) (PI Data Archive & PI AF) Server-side update so all clients are at the same software version Usually provides a performance improvement, especially for WAN


20 This is not the same PI Coresight

21
22 Demo Full graphical display Compare similar events Event details

23 Recap- Problem Solving with PI Coresight Full graphical display Use graphics and size and position to communicate Compare similar events Easily spot similarities or differences Event details Acknowledge and comment to collaborate with others

24
25 Demo Multi-state symbols PI AF traits Feedback options Share with a group Extensibility

26 Recap- Editing a Display Graphic display editing Build rich displays Multi-state Draw attention to what's important Use PI-AF traits Make limits consistent and sustainable Give us feedback Let us know what is most valuable Radial Gauge is planned. Share with a group Share with a specific group of users Extensibility Framework (CTP)

27 Extensibility Framework (CTP) Use like any other symbol Data Access Persistence Undo/Redo Configuration


28
29 Demo Consistent views Context switching Event & comments

30 Recap- Tablet experience Full graphical view See the same view no matter what device Context switching Reuse the same displays to view similar asset User specific search root Events View event comparison or event details View and add comments


31 Phone experience Full graphical view of displays Compact view of Assets Time manipulation Share link via Put Your Screenshot Here Put Your Screenshot Here PI Coresight display viewed on a Phone
32 PI Coresight Roadmap H 2H 1H 2H NEW DISPLAY EDITOR Create and view full graphical displays from anywhere on any device and solve problems with ad hoc capabilities. NOTIFICATIONS & EVENT ANALYSIS Be notified of issues happening in real-time, see event details, and analyze the event. Perform advanced searches on events facilitating batch event comparison and other analyses. EMEA UC (Berlin) INTEGRATED VISUALIZATION PLATFORM Full integration with the modern PI System and the capability for partners and developers to create rich application with extensibility. Displays Time Series Events Notifications Analytics Assets Data Entry INTEGRATED VISUALIZATION PLATFORM TBD EMEA UC (?) UC2016 (SF) UC2017 (SF)


33 Questions Please wait for the microphone before asking your questions Please remember to Complete the Online Survey for this session State your name & company search OSISOFT in the app store 36
34 Contact Information Chris Nelson Director, Visualization Products OSIsoft, LLC Tom LeBay Product Manager OSIsoft, LLC Eugene Resnick Group Lead OSIsoft, LLC Cyndi Bourne PI System Product Owner Shell 37


35 Thank You
36