Drive Better Insights with Oracle Analytics Cloud
|
|
|
- Marjorie Parrish
- 5 years ago
- Views:
Transcription

1 Drive Better Insights with Oracle Analytics Cloud Thursday, April 5, 2018 Speakers: Jason Little, Sean Suskind Copyright 2018 Sierra-Cedar, Inc. All rights reserved
 solutions, Business Intelligence (BI) tools, and the latest Oracle Cloud Subscriptions, including PBCS, EPBCS, EPRC, FCCS, PCMCS, and OAC.")


2 Today s Presenters Jason Little VP of EPM/BI Practice Jason Little is a functional and technical professional with 25 years of experience working with the Hyperion suite of products, Enterprise Performance Management (EPM) solutions, Business Intelligence (BI) tools, and the latest Oracle Cloud Subscriptions, including PBCS, EPBCS, EPRC, FCCS, PCMCS, and OAC. His corporate background includes Essbase and Hyperion Planning development, administration, and financial systems implementations. He has an accounting and finance background with emphasis on budgeting, forecasting, reporting, consolidations, and implementing best practices within the finance, accounting, and management reporting functions. He provides EPM and BI advisory services for public sector, higher education, healthcare, financial services, retail, manufacturing, and other commercial industries. Sean Suskind Director of Analytics Practice Sean Suskind is a 20-year professional in Business and IT as an Analytics Strategist, specializing in the Oracle stack. As a multirole Solution Architect accustomed to analytics initiatives, Sean provides a powerful combination of business experience and technical expertise. He is a professional in guiding and directing Assessments, Strategies, Roadmap Development, and Solutions focused on analytics solution roadmaps and implementations. As a business development leader, Sean is experienced in identifying, understanding, and architecting analytics solutions, leading and managing BI projects and related technical correlations, as well as defining requirements for project implementations. Sean has a proven track record of using varied technologies to guide and enable clients to achieve their overall strategic and tactical goals. He is a results-oriented team leader, a strategic thinker, communicator, and implementer with the technical expertise and business experience to deliver great results to clients. 2
3 Jump-Start Your Cloud Journey with Sierra-Cedar and Oracle Analytics Cloud Configure, Provision, and Migrate to Oracle Analytics Cloud Services Thursday, March 15 1:00 to 2:00 p.m. ET Design and Administrate Oracle Analytic Cloud Essbase Databases Thursday, March 22 1:00 to 2:00 p.m. ET Migrate Your Essbase Financial Reports, Web Analysis, and Smart View Reports to OAC Essbase Thursday, March 29 1:00 to 2:00 p.m. ET Drive Better Insights with Oracle Analytics Cloud Thursday, April 5 1:00 to 2:00 p.m. ET Assess and Migrate On-Premise OBIEE to Oracle Analytics Cloud Service Thursday, April 12 1:00 to 2:00 p.m. ET 3
4 Agenda Overview A Little about me and Sierra-Cedar Data Visualization and Data Science Use Case Example Demo Data Visualization and Machine Learning out of the box Demo Questions 4
5 5 Oracle Data Visualization Overview

6 What is Data Visualization? Data Visualization helps people understand data using visual analysis. Patterns, trends and correlations are much easier understood visually. People anyone can use it. Data any data. Visual rich, easy to use visual experience! 6


7 Oracle Analytics Cloud Subscription Overview Data Sources Data Analysis Understand and act using smarts: search, visualization, and storytelling Business social SaaS Data Preparation Prepare enriched, sharable, and reliable datasets across all data mobile sensors Data Catalog One place to collect, search, explore, and curate all data Analysts personal enterprise Data Management Oracle Database Services Oracle Data Lake Services Developers and Data Stewards 7


8 Oracle Data Visualization Drive Better Insights New cloud service designed for securely scaling stories across an organization Optimal for quick sprints in departmental initiatives where data is scattered in many places Oracle BI or Database license not required Includes 50GB capacity to store user data Touch friendly mobile authoring included Raw Data to Insight in Minutes Machine Learning and AI
9 Oracle Data Visualization Key Features 1. Connect to over 40 different data sources 2. Easy data integration on the fly 3. Data mashups and data manipulation 4. Data flows 5. A growing library of visualizations 6. AI Adaptive Intelligence 7. ML Machine Learning CLOUD Data Visualization Cloud Service Business Intelligence Cloud Service ON-PREMISES Data Visualization Desktop Oracle BI Enterprise Edition 12c MOBILE Data Visualization Cloud Service Data Visualization Desktop Business Intelligence Cloud Service Sierra-Cedar BI Enterprise Edition 12c DESKTOP Data Visualization Desktop EMBEDDED Business Intelligence Cloud Service Oracle BI Enterprise Edition 12c BIG DATA STACK Big Data Discovery Big Data Discovery Cloud Service 9
10 10 A little about me and my company

11 Sean Suskind Practice Director, Analytics Sierra-Cedar, Inc. Contact Over 20 years delivering analytics and reporting services. Focused on providing analytic solutions that offer enhanced business functionality and new insights driving innovation, adoption, and the use of technology in solving business problems. Analytics Strategist Biggest Challenge: My Trek to Mount Everest Base Camp The Enterprise that does not innovate, ages and declines. And in a period of rapid change such as the present, the decline will be fast! ~ Peter Drucker 11
 Oracle Cloud PeopleSoft Enterprise Oracle")
12 Sierra-Cedar Business Intelligence and EPM PBCS Planning & Budgeting Cloud Services FCCS Financial Close & Consolidation Cloud Services EPRCS Enterprise Reporting Cloud Services PCMCS Profitability & Cost Management Cloud Services Exploring and Delivering Oracle Cloud Services Product Expertise Oracle Business Intelligence (Hyperion, OBIEE, OBIA) Oracle Cloud PeopleSoft Enterprise Oracle E-Business Suite OAC Oracle Analytics Cloud BICS Business Intelligence Cloud Services DV Data Visualizations from the Cloud to the Desktop to the Enterprise Offering cloud based Analytics and Enterprise Performance Management with industryfocused client success by providing consulting, technical, and managed services for the deployment, management and optimization of Oracle applications and technology. 12
13 13 A little background


14 9 th Grade Lab Science Principles of lab science WHAT AN EXPERIMENT NEEDS Question Hypothesis Experiment Observation Analysis Conclusion 14


15 Science and Data Science, applied to data is used to answer your questions WHAT AN EXPERIMENT NEEDS Use Case Maintaining Membership Base Data Membership and related Question Hypothesis Experiment Observation Can I predict attrition from our membership and determine root causes? Average age of members is increasing, and more and more members are dropping out. We need to target younger age groups Analysis Conclusion We begin with a question 15

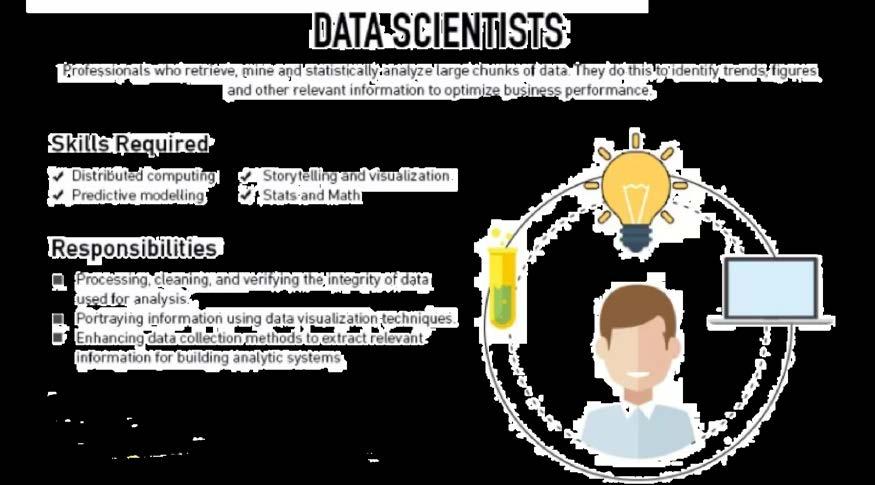
16 16 What is a Data Scientist?


17 A Quick Word About Machine Learning and Artificial Intelligence Machine Learning is the science of getting computers to learn and act like humans do, and improve their learning over time in autonomous fashion, by feeding them data and information in the form of observations and real-world interactions. Arthur Samuel coined the phrase not too long after AI, in 1959, defining it as, the ability to learn without being explicitly programmed. First coined in 1956 by John McCarthy, Artificial Intelligence involves machines that can perform tasks that are characteristic of human intelligence. Artificial Intelligence is possible without using machine learning, but would require building millions of lines of codes with complex rules and decision-trees. 17
18 18 Use Case Example


19 It begins with the data In the Data tab, select the data set you want to use for the model, or create the data set. Select Create, Data Flow to display the Add Data Set pane. Select the data set you want to work with and click Add, or create a new data set by clicking on Create Data Set. 19

20 Use case example I work in the admissions office of a small liberal arts college. My goal is to better understand the types of students that end up enrolling at our school after going through the recruiting process so that I can target candidates for recruiting. I need to be able to predict which candidates will most likely enroll in order to improve the recruiting to enrollment metrics. 20


21 Let s train a model using a Data Flow Select Create Data Flow to display the Add Data Set pane. Select the Admit to Enrollment Details data set, and click Add. 21


22 Select the train model type We want to add a step to our data flow by clicking on the +. This displays all available data flow step options, including train model types shown as icons across the bottom (for example, Train Numeric Predictions, Train Multi-Classifier). 22


23 Select the train model type and model script Because we are trying to predict Enrollment, which is a column with Y or N, we select Train Binary Classifier as our model type. We now have some options on model script. All of these options are out of the box. The scripts run in the background and are written in Python. Each of these scripts can be used to predict Enrollment. It is good practice to try a few of them to see which script provides the best quality prediction. We decide to use Logistic Regression for model training because we have a number of potential drivers for Enrollment Decisions Click OK. 23


24 Set parameters of the train model script The parameters displayed are specific to the script selected. In this example, the Logistic Regression for model training script. We have the option to refine the field details for the model as required. You must select a target column. Click Target to select a Data Set column that you want to apply the train model to. We are selecting Enrollment. Click Save the Data Flow, give it a name, and click OK. 24


25 Running the Data Flow and Interpreting the Model s Effectiveness Run the Data Flow by clicking on Execute Data Flow at the top right of the screen. The Data Flow will take a few minutes to run, and will indicate when complete. To interpret the effectiveness of the model, we want to understand how it interprets data. Click Machine Learning to display the Scripts and Models tab. In the Models tab, select Inspect from the Actions menu. 25
 Quality shows information about the model including a standard set of metrics.")
26 Interpreting the Model s Effectiveness General shows information about the model: Predicts: What the model is trying to predict Trained On: The Data Set used to train the model Script: The name of the script used in the model. Class: The class of script (for example, Binary Classification) Quality shows information about the model including a standard set of metrics. Related captures data sets emitted by the Machine Learning scripts when run to build models. The data sets capture specific information related to the script logic, so that advanced users (data scientists) can get more insights into the model built. Training Data: The data set being used to train the model. Generated Data: The data sets created by the script that you use for the training model 26

27 Applying the Model With the model now saved, we want to apply the model to create a new data set of predicted data. We create a new Data Flow to apply the model. We select the Admit to Enrollment Details data set, and add the Apply Model step to the Data Flow. 27


28 Applying the Model The Apply Model step allows us to configure the outputs. We can modify the Column Names, and choose which columns to include in the data set. We use the Save Data step in the Data Flow to create the new data set generated by applying the model. 28
29 29 Demo

 Multi Classification CART (Decision")

30 The Data Science Out of the Box Model Types available out of the box, and related model scripts Numeric Prediction Linear Regression Elastic Net Linear Regression Binary Classification Logistic Regression CART (Decision Tree) Multi Classification CART (Decision Tree) Naïve Bayes CART for Numeric Naïve Bayes Neural Network Neural Network Random Forest Random Forest Support Vector Machine Support Vector Machine 30


31 The Data Science Out of the Box Linear Regression Statistics Drivers Residuals Logistic Regression Statistics Confusion Matrix Drivers CART (Decision Tree) CARTree Statistics Residuals Confusion Matrix Numeric Prediction Support Vector Machine Summary Confusion Matrix Statistics Classification Report Drivers Binary Classification CART (Decision Tree) CARTree Statistics Residuals Confusion Matrix Support Vector Machine Summary Confusion Matrix Statistics Classification Report Drivers Multi Classification Naïve Bayes Summary Confusion Matrix Statistics Classification Report CART for Numeric CARTree Statistics Hitmap Residuals Elastic Net Linear Regression Statistics Drivers Residuals Random Forest Confusion Matrix Statistics Neural Network Summary Confusion Matrix Statistics Classification Report Naïve Bayes Summary Confusion Matrix Statistics Classification Report Random Forest Confusion Matrix Statistics Neural Network Summary Confusion Matrix Statistics Classification Report The Machine learning algorithms generate similar related datasets and all of them can be categorized into eight datasets. The parameters and column names might differ slightly between datasets depending on the type of algorithm, however the functionality of dataset remains the same. For example, columns in the Statistics dataset may change between Linear Regression and Logistic Regression, but the Statistics dataset contains accuracy metrics of the model. 31


32 Drivers dataset The Drivers dataset, generated by the model, are the key determinants of the target column value. In our case, the model performs linear regression and identifies columns in the dataset that influence the target column. Each driver is coefficient and correlation values. The Coefficient value is an indication of the weight of the influence in predicting the target column value. The correlation indicates the direction of relationship with target column. 32


33 Confusion Matrix dataset The Confusion Matrix dataset generated by the model is also known as the error matrix. Values are generated that provide the ability to view the performance of the algorithm. Each row of the matrix represents a case of predicted class while each column represents cases in an actual class. This table reports the number of false positives, false negatives, true positives, and true negatives based on which precision, recall, F1 accuracy metrics are computed. 33

34 Statistics dataset Statistics contains metrics that quantify model accuracy. Depending on the algorithm/model that generates this dataset metrics present in the dataset will vary. 34

35 Too much Data Science? Use Explain. What is Explain? In-line Machine Learning for the business user with no specialty skills required Uncovers hidden drivers and recommends areas of exploration without user actively analyzing specific factors Guides the user to areas of interest they might not know to look at Provides freedom to explore data more fully without specialist intervention Provides in-depth statistical analysis on contextual data enriching the interactive analytic experience 35


36 Explain guides the user to key insights Key Drivers indicate what s important Segments identify hidden groups of data elements that predict the target Anomalies indicate groups of data that exhibited unexpected results 36
37 37 Demo


38 Summary Machine Learning and Adaptive Intelligence at your fingertips: Variety of data profiling, statistical, and machine learning techniques enhance user productivity and improve discovery Automatically highlight attributes with statistical and predictive significance Access to advanced analytics capabilities drive predictive analytics Drag and drop UI for Clustering, Outliers, Trend Lines, and Forecasts Custom R modules can be published for access by non-technical users Ability to leverage out of the box algorithms for spatial queries, graph analysis, and statistical computing Remember, you can't test out these features for yourself unless you get your hands on it. To learn more about these and other machine learning features, Download Oracle Data Visualization Desktop 38
39 Jump-Start Your Cloud Journey with Sierra-Cedar and Oracle Analytics Cloud Configure, Provision, and Migrate to Oracle Analytics Cloud Services Thursday, March 15 1:00 to 2:00 p.m. ET Design and Administrate Oracle Analytic Cloud Essbase Databases Thursday, March 22 1:00 to 2:00 p.m. ET Migrate Your Essbase Financial Reports, Web Analysis, and Smart View Reports to OAC Essbase Thursday, March 29 1:00 to 2:00 p.m. ET Drive Better Insights with Oracle Analytics Cloud Thursday, April 5 1:00 to 2:00 p.m. ET Assess and Migrate On-Premise OBIEE to Oracle Analytics Cloud Service Thursday, April 12 1:00 to 2:00 p.m. ET 39

40 40 Questions?