Building the Case for Asset Framework at International Paper. Copyright 2015 OSIsoft, LLC
|
|
|
- Tabitha Moore
- 5 years ago
- Views:
Transcription

1 Building the Case for Asset Framework at International Paper Presented by Presenter Rick Smith Name/s
2 Agenda About International Paper Building the Case 1. Single Version of the Truth 2. Downtime Tracking 3. Tracking (Energy) Consumption Future Plans 2
3 International Paper World s Largest Pulp and Paper Company Founded 1898 (117 Years Ago) 58,000 Employees $23.6 Billion Net Sales (2014) OSIsoft Installed Base 35 Facilities (70 PI Servers) US, Brazil, France, India, Poland, Russia 1.5+ Million PI Tags 3

4 Why Do I Need a Business Case? Infrastructure IS NOT a Shiny Rock Incumbent Solutions In Place Point Solutions are Everywhere Point-to-Point Data Exchange is Everywhere The Manufacturing Village is Larger Than Before There is Money Involved Time is Money People Like What they Have Change is BAD!! 4

5 Red-Eye Flight from OSISoft 2014 UC Typical Network 2. Proliferation 3. Notifications 4. Data Cleaning 5. Misconceptions 6. More More More 5

6 Building the Business Case 1. Single Version of the Truth 2. Downtime Tracking 3. Tracking (Energy) Consumption 6
7 Case #1: Single Version of the Truth Question: How Much We Make? The Answer Depends on Who You Ask What Base-Line Time Period Selected? What PI Tags Were Used? What Calculations Were Used? How Was Data Filtered? 7


8 Getting to the Answer Can be Complex Woe is me.. 8


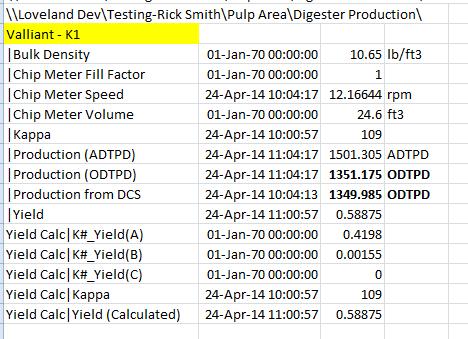
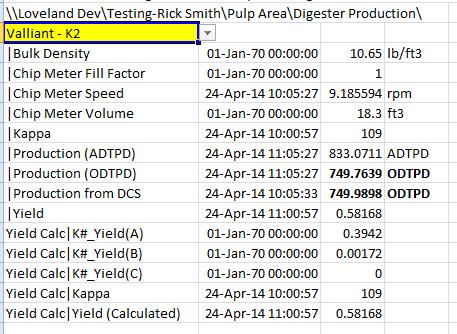
9 Digester Production Calculations Standardized Calculation Methods 0 DCS 1 3 Raw PI Tags Environmental Monitoring Equation Coefficients Change 0. In the Beginning There was the DCS 1. Raw PI Tags 2. Excel Calcs From Raw Inputs 3. Daily Env. Calcs Added Uncontrolled 2 Excel Excel Excel Regulators Decision Makers 9
10 Kamyr Digester Production (ADUBTPD) Air-Dried Unbleached Tons per Day = Chip Meter Speed (rpms) * Bulk Density (lb/ft 3 ) * Chip Meter Volume (ft 3 ) * Chip Meter Fill Factor * Yield * [1440 min/day] / [2000 lb/us Ton] Where Yield = [A + B*(Kappa) + C * (Kappa) 2 ] PI PE -> '03SIC103.PV' * * 24.6 * 1.0 * ( * 'K1Kappa.PV' * 'K1Kappa.PV' * 'K1Kappa.PV') * 1440 / 2000 Yield Coefficients and Constants Change 10

11 Build the Calculation Template 11

12 Standard Calculations Via AF 12
13 Asset Framework (AF) Calculation Conversion Benefits Standard Calculation Methodology Controlled By the AF Template Therefore, One Version of the Truth AF Becomes the One Stop Shop for Enterprise Alias for Calculated Results Time Stamped Coefficient Changes DCS/PI Calculation Comparison 13
14 Case #2: Downtime Tracking Overall Equipment Efficiency (OEE) = Availability * Speed Efficiency * Quality Availability: Downtime/Slowback System (RTS) Speed Efficiency: Maximum Sustainable Rate Quality: A1 Tons Acceptance Reliability Tracking System (RTS) Windows Service Reads PI Data and Writes State Information to PI 0=Normal; 1=Slow; 2=Down Event System Triggers Off State Tag Excel Report for Each Unit Operation ~300 Unit Operations Monitored 14


15 Report Output 15
16 Downtime Data Flow (2002-Present) RTS Service 2 3 Configuration 1 MS Access 1 Current Data Specs PI Event Status Events Specifications & Events 5 4 Excel Enterprise Database A B C D Targe Slowback Downtime E F G H 16

17 Future Downtime Data Flow RTS Service Configuration MS Access Current Data PI Event Status Specs Events Specifications & Events PI AF 17

18 Converting Downtime to Event Frames Simplify Environment Eliminate Distributed Access Databases Eliminate Windows System Service Remove Specification/Event System Requirement Configuration with Standard PI Tools Will Work at All IP Manufacturing Facilities Simplifies Reporting Requirements 18
19 Case #3: Tracking (Energy) Consumption Huge Cost Driver Time Consuming to Monitor When to Invest? Where to Invest? 19
20 The Your.Name.Here Spreadsheet For Each of 60 Paper Machines Summarize PI Data for PI Tags Retrieve 1-Month of Data Allocate/Aggregate Data for Missing PI Tags Remove Bad Data (Sheet Break, Downtime, etc.) Copy/Paste Values into Enterprise Spreadsheet Update Chart Ranges (Enterprise Spreadsheet) This Exercise Takes 2+Days/Month 20
21 Can We Reduce the Effort? OSISoft Paper Machine Demonstration Jim Black (Industry Principal-OSISoft) Gopal Gopalkrishnan (Solutions Architect-OSISoft) AF Elements Steam, Electricity and Sheet Break Status Asset Analytics (For Each Element) Value Adjusted For Sheet Break (Event-Triggered) Data Quality Check (Daily Event Frame) 21


22 Monthly Summary Date Range Monthly Averages Second Refresh 2. Data Cleaned and Summarized Monthly Totals 22
23 In the End, All the Effort IS Worth It 35% Reduction 23
 Data Transfer Time Reduced by > 98% Eliminate Data Cleaning Step Eliminate per Ton Calculation Step Simplify")
24 Benefits of Converting to Event Frames Reduce Monthly Task to < 4 Hours (est.) Data Transfer Time Reduced by > 98% Eliminate Data Cleaning Step Eliminate per Ton Calculation Step Simplify Reporting Single Version of the Truth 24
 Consumption a. Simplify the Methodology b.")
25 Summarizing the Cases 1. Single Version of the Truth a. Reduce Risk/Liability b. Alias Name Makes Finding the Right Values Easier 2. Downtime Tracking a. Simplify the Environment b. Works at All IP Locations 3. Tracking (Energy) Consumption a. Simplify the Methodology b. Better Results with Reduced Time/Effort 25
26 Next Steps Switch PI Servers to Domain Security (Complete) AF Projects (Proposed) Notifications Replace Home Grown Solution Event Frames Replace Home Grown Downtime Solution Daily/Monthly/Grade Analysis Identify and Configure Standard Plant Model More to Come 26

27 Hot Off the Press Winder Cycle Time Analysis Batch Digester Analysis 27
28 Rick Smith Manufacturing Process Information Consultant International Paper 28


29 Questions Please wait for the microphone before asking your questions State your name & company 29

30 We are all salesmen