Maximizing Big Data and Analytics to Improve Performance
|
|
|
- Philippa Owen
- 5 years ago
- Views:
Transcription
1 Maximizing Big Data and Analytics to Improve Performance Asha Saxena Founder ACULYST, Corp March 13, 2017


2 Speaker Biography Healthcare Technology Entrepreneur. Founder & Chief Innovation Officer of ACULYST Corp., a Healthcare Analytics firm with global headquarters in NJ. Also, served as a CEO for FUTURE TECHNOLOGIES, INC, Big Data Analytics Consulting Firm. Entrepreneur in Residence & Adjunct Professor, Columbia Business School Leads Big Data Seminars at Columbia University and is an evangelist for data analytics. Teach Entrepreneurship and Business Analytics Contributor, Published Author Monthly Column, Entrepreneur Media, Beckers Hospital Review, Healthcare Business Tech, Healthcare IT Speaker at HFMA, HIMSS, AHIMA Computer Science Engineer and Executive Management Programs at MIT and LBS Ms. Saxena is Certified as a Six Sigma Black Belt professional in the discipline of Operational Excellence
3 Maximizing Big Data and Analytics to Improve Performance
4 BIG DATA & ANALYTICS

5 4


6 BIG DATA: BUZZ WORD?
7 Amount of Data 5 billion gigabytes (exabytes) of data were created from the beginning of recorded time until In 2011, the same amount was created every TWO DAYS. And Now, the same amount is created every TEN MINUTES. Source:

8 DATA SIZE Every day, we create 2.5 quintillion bytes of data so much that 90% of the data in the world today has been created in the last two years alone Mega 1000 Giga 1000 Tera 1000 Peta 1000 Exa
 analytics With complex (non-sql) analytics Big Velocity Drink")
9 WHAT IS BIG DATA? Big Volume With simple (SQL) analytics With complex (non-sql) analytics Big Velocity Drink from the fire hose Big Variety Large number of diverse data sources to integrate


10 BIG DATA & IOT

11 Connected Devices
12 DATA IS NEW OIL IT S ONLY USEFUL WHEN IT S REFINED INFORMATION IS THE OIL OF THE 21 ST CENTURY, AND ANALYTICS IS THE COMBUSTION ENGINE

13 VALUE

14
15 5 V s of Big Data Volume, Veracity, Velocity, Variety, and Value Banking/Marketing/IT: Volume, Velocity, and Value Healthcare/Life Sciences: Veracity, Variety, and Value
16

17 NEW WORLD OF HEALTHCARE


18 The Triple Aim in Healthcare Improve Population Health Enhance Patient Care Reduce Operational Cost & Risk
19 THE SHIFT Hospital s revenue model has changed OLD MODEL The more services the more fees NEW MODEL Paid to get people healthy and keep them healthy Keep beds full and do a lot Do only what works NEED: DATA DRIVEN APPROACH

20 WHERE IS THE DATA?
21 How to turn BIG data analytics to Improve Performance?
22 WHERE DO WE START?

23 Understanding
24 TYPES OF DATA Structured Ex: Relational databases, Excel sheets Semi-structured Ex: XML data, EDI, s Unstructured Plain Text, description on a web page, body of an , images In the near future, Unstructured data will be more than 80% in many organizations (source: IDC)
25 TYPES OF DATABASES Flat files Hierarchical Databases (before 1980, IBM IMS) Relational Databases (1980 to date) SQL (Structured Query Language is used to make queries on data in a relational database) Object oriented databases (1990s) Non Relational Databases (NoSQL) ( 2005 onwards)
26 RELATIONAL DATABASE

27


28 What is the challenge? Traditional Analytics Data refreshed once per month Yellow Relational Database Pages Preprocessed report Big Data Analytics Real Time Analytics Search Data refreshes on demand Engines Distributed networks

29 DATA WAREHOUSE Extract, Transform & Load


30 ANALYTICS PROJECT LIFE CYCLE Data Capture Acquire Key Data Elements Assure Data Quality Integrate Data into operational work flow Data Analytics Interpret Data Discover new Information/ knowledge Data Provisioning Move data from operational systems to Data Warehouse Build Visualization for end users

31 HEALTH: DATA ANALYTICS Descriptive: describes data as is without any complex calculations or math/statistics models. May involve calculation of ratios, visualization Predictive: use information in the data, to make a forecast, or predict (ex: the reaction to a drug.) Usually make use of statistical, math, or data mining models. Prescriptive: when there are too many options, a tool may help choose or prescribe a choice. Need health and medical knowledge in addition to data and information

32

33 PROBLEM STATEMENT
34 What do we look for? Operational Efficiencies Better bottom line Clinical Care
35 Data at Hand Reporting Requirements from Centers of Medicare & Medicaid Services (CMS) Admissions & Readmissions Emergency Department Visits and Wait Times Mortality DRG Codes for Procedures And more. Where to start?


36 Focus on Run the Business Improve the Business Prepare for Outliers

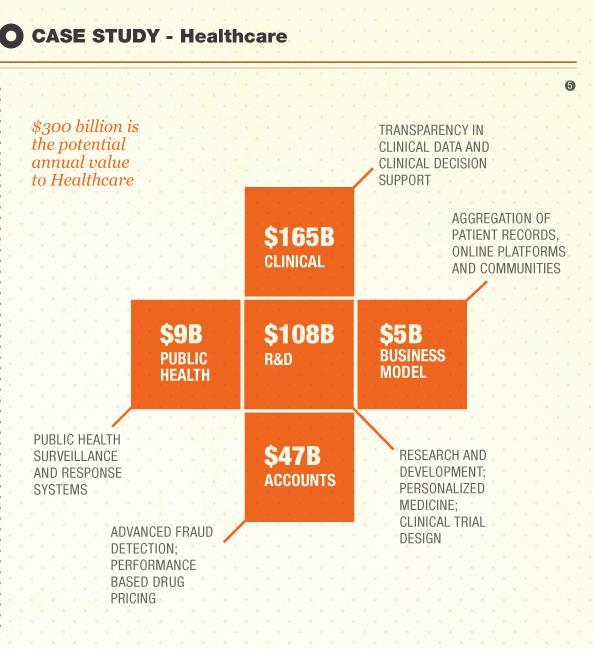
37 Where are the immediate revenue opportunities? Source:
38 USE CASES: HEALTH ANALYTICS Population Health Identify populations and individuals most at risk for future high costs, inpatient admissions, and emergency room visits. 30-Day Readmission / Return Risk Identify inpatient encounters most at risk for 30-day readmissions or 30 day ED revisits. Variation Management Understand resource variation by disease and cost category (length of stay, laboratory, radiology, etc...) to reduce unnecessary practice variation.


39 AMBULATORY PATIENT RISK MANAGEMENT Ambulatory based care managers assess real time population risk scores, including patient risks for costs, admission, ED visit, disease, and mortality. The practice sets thresholds for each risk category to flag high risk patients. Low Risk Medium Risk High Risk Care managers proactively reach out to high risk patients to provide education and manage care gaps.
40 UT SOUTHWESTERN 30-Day Readmission / Return Risk Identify inpatient encounters most at risk for 30-day readmissions or 30 day ED revisits. Reduce preventable, avoidable readmissions Real-time EHR data analytics helped cut readmissions by five percent by drawing on nearly 30 data elements included in the patient s chart. Analytics can be used in real-time to automatically identify and target patients at the highest risk of readmission early in their initial hospitalization when there is a lot that can be done to improve and coordinate their care, so they will do well when they leave the hospital
41 SOUTH TEXAS MEDICAL ASSOCIATES Is using Advanced Analytics on clinical data to identify causes of Readmission and developed comprehensive treatment and intervention plans. In just 6 months, SETMA reduced readmissions by 22%. Source:
42 UNIVERSITY OF CALIFORNIA DAVIS Hospital quality and patient safety in the ICU Routinely collect EHR data as the fodder for ANALYTICS that gives clinicians an early warning about sepsis, which has a 40 percent mortality rate and is difficult to detect until it s too late.
43 TORONTO HOSPITAL: NEONATAL CARE Using various sensors, heart beat and other data streams are collected, analyzed and correlated in real time to detect infections. An IBM Research developed analytics system was able to detect infection 24 hours before it became clinically apparent to the doctors. In neonatal care, advancing treating by even an hour can be life saving. Source:
44 PREDICTIVE RISK MODEL Patient History Patient Risk of Event or Outcome 1000s of Patient Features Age Gender Geography Income Education Race Diagnoses Procedures Chronic conditions Visit and admission history Outpatient medications Vital signs Lab orders and results Radiology orders Social characteristics Behavioral characteristics Risk Model Development Multivariate Statistical Modeling Decision Tree Analysis Machine Learning Available Risk Models Population Risk Models (predicts future 12 months) Predicted future cost Risk of inpatient admission Risk of emergency dept (ED) visit Risk of diabetes Risk of stroke Risk of AMI Risk of hypertension Risk of mortality Event Based Risk Models (predicts future 30 days) Risk of 30 day readmission Risk of 30 day ED re-visit
45 WHO IS ADOPTING? Health Systems Fee for Service Community Hospitals ACOs Medical Group with Insurance Product State Medicaid Program Federally Qualified Health Centers
46 Challenge Example 1: Quality: Monitoring Readmission Rates and Root Causes Inability to proactively identify high risk patients with complications Inability to identify root causes of 30 day re-admissions by patient Implications Patients who are re-admitted tend to have lower patient satisfaction scores Penalties for not meeting 30 day re-admission rate targets lowers revenue and increases costs, thus lowering profitability
47 Solution Quality: Monitoring Readmission Rates and Root Causes Leverage root cause analysis on patients re-admitted within 30 days of initial discharge Analysis of patient history and risk enables product line managers to proactively change processes and protocols, to lower re-admission rates Customer Benefits Patient Readmission rates reduced 25% Penalties of over $12MM avoided annually

48 Readmissions Analysis of Readmission Patterns by Day of Week and Month, as basis for remediation Re-admission counts and percentage by coverage type, with drill downs into root causes
49 Example 2: Challenge Staffing: Manage Labor Cost Drivers Inability to analyze labor data rapidly based on ERP system reports alone Inability to identify trends and variance in staffing and labor costs over time - that contributes over 60% of all expenses Implications Unscheduled time off leads to avoidable overtime and cost overruns Overtime lowers employee satisfaction and morale
50 Staffing: Manage Labor Cost Drivers Solution Labor Cost dashboards drive actionable insights and correlations between unscheduled time off and overtime utilization, with cost implications Department heads can easily identify outliers and repeat violators of paid time off policies, for appropriate action Customer Benefits Overtime reduced 15%, saving $ 20mm annually Employee Satisfaction scores improved on most Nursing Units

51 Staffing: Manage Labor Cost Drivers Analysis to correlate unscheduled time off against overtime by employee Ability to visualize staffing and labor expenses by any time horizon, for remediation


52 ANALYTICS Questions ANALYTICS Data Tools

53 WHERE TO START? Executive Engagement Step 1: Strategy Defining Goals Build vs Buy Step 2: Technology Data Integration Timeline Step 3: Implement Results Training Step 4: Adoption Usability
54 FIVE TAKEAWAYS Focus on the biggest and highest value opportunities Within each opportunity, start with questions, not data Embed insights to drive actions and deliver value Keep existing capabilities while adding a new ones Use an information agenda to plan for the future

55 Success looks like


56

57 Need Additional Information? Call or me: Asha Saxena
58 A Face in the Crowd: Say goodbye to anonymity 57