SpectrumSpatialforBI: MarryingLI andbi. Luke Robinson Head of GIS Presales
|
|
|
- Jane Dean
- 5 years ago
- Views:
Transcription

1 SpectrumSpatialforBI: MarryingLI andbi Luke Robinson Head of GIS Presales

2 Definition ofbusiness Intelligence Business Intelligence-gain insight from various business data and on a basis of this insight to improve operational, tactical or strategic decisions. Finance Operations How are we doing? Scorecards and Dashboards Sales What should we be doing? Planning, Forecasting and Budgeting Marketing Performance Why? Reporting & Analytics Human Resources Customer Service IT/Systems 2
3 LI & BI Business Intelligence gives answers to How? Why? What? Location Intelligence extends Business Intelligence with spatial components to add the 'Where?' LI gives analyst and decision makers a complete overview of all data and therefore a better basis for decisions. Where do we sell which amount of which product? What is the difference in regional purchasing power for my products? Where are sites or regions with the best revenue and why? Which areas can sales efficiency be enhanced? Where do my existing and targeted customers live? Where do potential and ideal customers live? Where are similar spatial or demographic patterns or trends? Where are my SLAs not meet and why? 3
4 Location Intelligence is under utilized In virtually all BI implementations today, location information isn't ignored, but it is pretty much used exclusively as a descriptive attribute or very coarse-grained and often static dimension. Andreas Bitterer, Gartner,
5 The tide isturning Geospatial analysis in BI will double by 2016 (The Data Warehouse Institute, December 2013) Vendors are stepping up BI platforms adding geoanalysis/li GIS tools offering platform-specific solutions Consumer mapping and SaaS Commercial-grade, standardsbased solutions 5


6 Introducing Spectrum Spatial for BI Spectrum Spatial for BI merges location intelligence into enterprise business visualization platforms, delivering highly customized and current, spatially enabled reporting. Business Intelligence (BI) Location Intelligence (LI) -applications, -Geocoding -infrastructure, -Point in polygon -tools, -Thematic mapping -best practices, -Hot spot analysis -analytics and -more -accessibility to information that improves or optimizes decisions and performance. Spectrum Spatial for BI will integrate the two 6

7 Integeo Pitney Bowes in partnership Global leader in the converging fields of Business and Location Intelligence Map Intelligence Spatial Hub Embedded into Spectrum Spatial as Spectrum Spatial for BI Out of the box deeply integrated technology Focus on data not technology - fast, iterative analysis and reporting A rich suite of location analytics - easily augmented with web services 7


8 Architecture with Location Intelligence BI Platform LI Platform Reports LI Services BI Server Location Intelligence Spectrum LI Platform Enterprise Database Standard BI Connector Spatial Data 8


9 Adding Spatial Analysis to Business Intelligence 9


10 View, analyse, report, share, plot. Cognos MicroStrategy Excel MI Express QlikView Business Objects 10
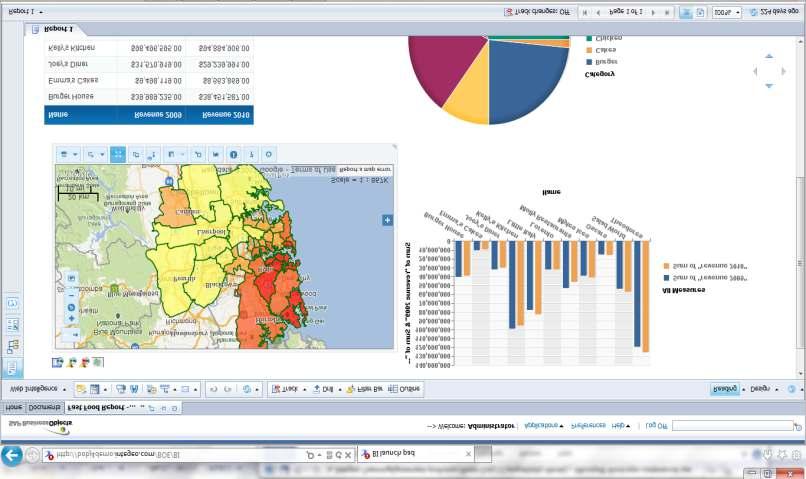
11 A few benefits of Spectrum Spatial for BI Provide consistent capabilities across a wide array of BI Leverage existing investments in data warehouses Utilize existing access mechanisms (e.g. Web based portals) Maintain security within the BI solution Rapidly perform analysis using current, accurate and relevant data Empower the business to improve decision-making and results 11


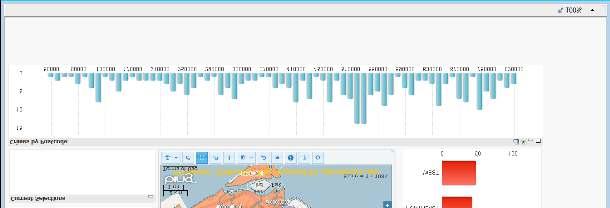
12 QlikView 12

13 QlikView 13
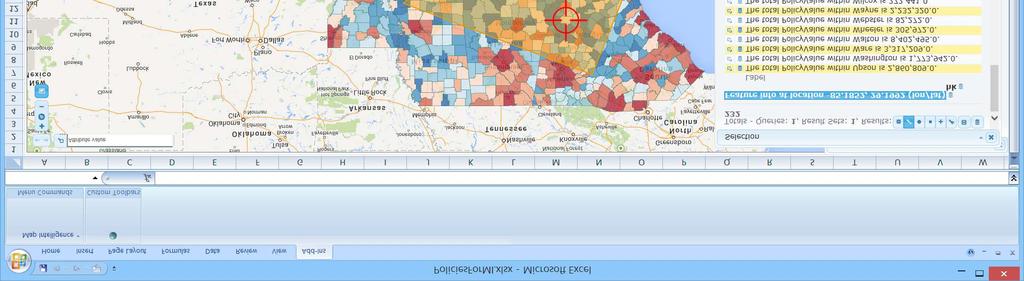

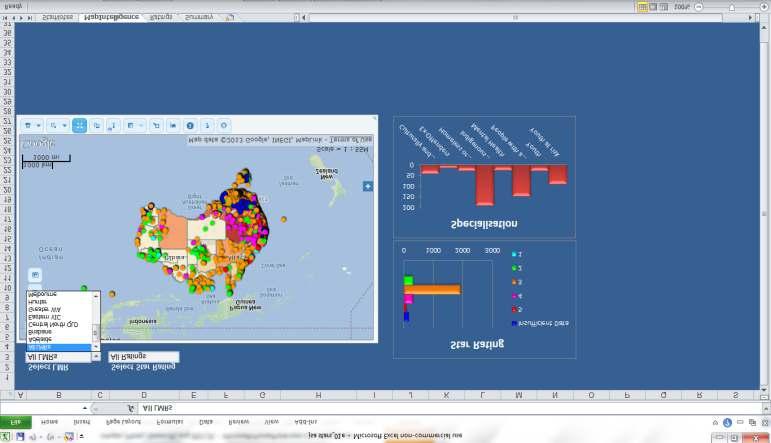
14 Excel 14
15 Excel 15
16 Spectrum Spatial for BI High Level Internet / Intranet (Browser) BI Platform BI Report Output Map Report + Interface KML PBS Spectrum Spatial for BI BI Platform(s) BI-Specific Agent Spectrum BI Module Report Queries Data Warehouse Spectrum Location Intelligence Module (Business Data + Reference Data) Spectrum Enterprise Gecoding Module 16


17 Point Layer Each row in the spreadsheet is displayed as a different point on the map Each point has A Position A Colour or Symbol A Label These are based on data columns in the spreadsheet 17

18 Excel Data to be displayed as a Point Layer Point position Point symbol Or colour Point label 18


19 Structure of a map layer (Post codes) 2000 A map layer consists of the lines that make up the area outline and tabular attributes for each polygon such as Name, Area, centre point etc. + = Map Intelligence allows us to Join the layer attribute data with data from a spreadsheet to colour regions based on name, or id etc. 19
 and the polygon is then coloured based on applying a function such as Count, Sum, Min or Max to the values of a fact column (e.g. Value of grants column) for each row associated with the polygon.")
20 Area Group Layer Each row in the spreadsheet is associated with a separate map polygon (E.g. Post Code) and the polygon is then coloured based on applying a function such as Count, Sum, Min or Max to the values of a fact column (e.g. Value of grants column) for each row associated with the polygon. 20


21 Excel Data to be displayed as an Area Group Layer Join Column Joined to a column in The Map layer Fact Column Used with function such as Count, Sum, Max etc 21


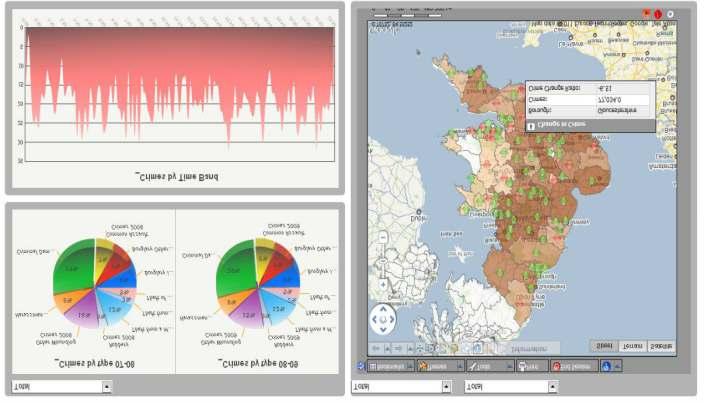
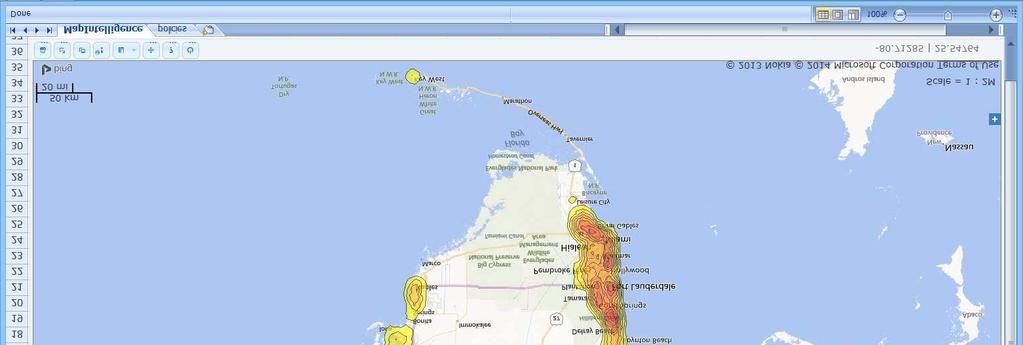
22 Contour / Hot Spot Analysis 22

23 Density Surface / Hot Spot Analysis 23


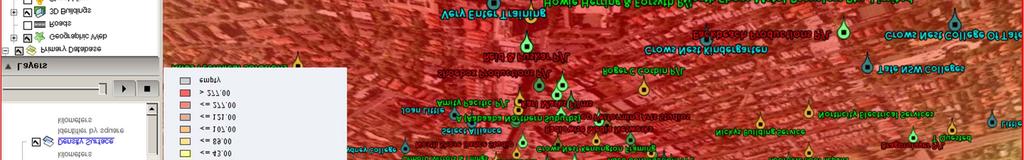
24 Point Gradient / Most Common Type 24


25 Voronoi / Area of Control 25

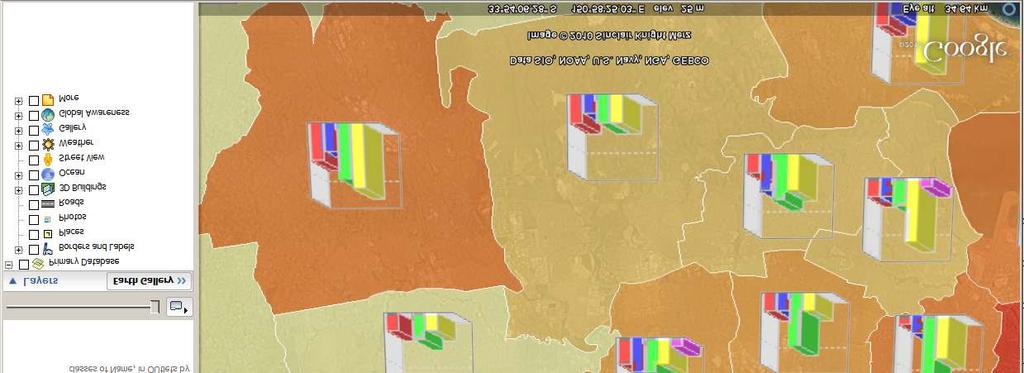
26 Charts on Regions 26

27 Line Layer 27

28 Google Earth 28


29 Google Earth 29

30 Demo Example using a full-bleed image 30
31 Example using a full-bleed image Questions? Luke.Robinson@pb.com 31