MORGAN STANLEY LAGUNA CONFERENCE Dan Comas September 15, 2016
|
|
|
- Joseph Matthews
- 5 years ago
- Views:
Transcription


1 MORGAN STANLEY LAGUNA CONFERENCE Dan Comas September 15, 2016
2 Forward Looking Statements Statements in this presentation that are not strictly historical, including any statements regarding events or developments that we believe or anticipate will or may occur in the future are "forward-looking" statements within the meaning of the federal securities laws. There are a number of important factors that could cause actual results, developments and business decisions to differ materially from those suggested or indicated by such forward-looking statements and you should not place undue reliance on any such forward-looking statements. These factors include, among other things, deterioration of or instability in the economy, the markets we serve and the financial markets, the impact of our restructuring activities on our ability to grow, contractions or growth rates and cyclicality of markets we serve, competition, our ability to develop and successfully market new products and technologies and expand into new markets, the potential for improper conduct by our employees, agents or business partners, our ability to successfully identify, consummate and integrate appropriate acquisitions (including the pending acquisition of Cepheid) and successfully complete divestitures and other dispositions, our ability to integrate the recent acquisition of Pall Corporation and achieve the anticipated benefits of that transaction, contingent liabilities relating to acquisitions and divestitures (including tax-related and other contingent liabilities relating to the distribution of Fortive Corporation), our compliance with applicable laws and regulations (including regulations relating to medical devices and the healthcare industry) and changes in applicable laws and regulations, our ability to effectively address cost reductions and other changes in the healthcare industry, risks relating to potential impairment of goodwill and other intangible assets, currency exchange rates, tax audits and changes in our tax rate and income tax liabilities, litigation and other contingent liabilities including intellectual property and environmental, health and safety matters, risks relating to product, service or software defects, product liability and recalls, risks relating to product manufacturing, the impact of our debt obligations on our operations and liquidity, our relationships with and the performance of our channel partners, commodity costs and surcharges, our ability to adjust purchases and manufacturing capacity to reflect market conditions, reliance on sole sources of supply, labor matters, international economic, political, legal, compliance and business factors (including the impact of the UK referendum to leave the EU), disruptions relating to man-made and natural disasters, security breaches or other disruptions of our information technology systems and pension plan costs. Additional information regarding the factors that may cause actual results to differ materially from these forward-looking statements is available in our SEC filings, including our 2015 Annual Report on Form 10-K and Quarterly Report on Form 10-Q for the second quarter of These forward-looking statements speak only as of the date of this presentation and the Company does not assume any obligation to update or revise any forward-looking statement, whether as a result of new information, future events and developments or otherwise revenues have been adjusted to (i) exclude Fortive Corporation and (ii) with respect to the Pall Corporation business, add Pall s revenues as a standalone business from January 1 through August 30, All other financial metrics have also been adjusted to exclude Fortive Corporation unless otherwise indicated. With respect to these non-gaap measures and any other non-gaap financial measures included in the following presentation, the accompanying information required by SEC Regulation G can be found in the Financial Information / Quarterly Earnings / Second Quarter 2016 section of Danaher s web site, With respect to forward-looking estimates of organic revenue growth, it is not feasible to provide an estimate of GAAP revenue growth because the other components of GAAP revenue growth (revenue growth attributable to acquisitions and the effect of currency exchange rates) are significantly dependent on future events that are inherently difficult to predict and estimate, such as acquisitions and currency exchange rates. All references in this presentation to earnings, revenues and other company-specific financial metrics relate only to the continuing operations of Danaher s business, unless otherwise noted. All references in this presentation to growth refer to year-over-year growth unless otherwise indicated.


3 Danaher Today Life Sciences Diagnostics Dental Environmental & Applied Solutions ~$5.2B revenue* ~$4.8B revenue** ~$2.7B revenue ~$3.6B revenue Water Quality Product ID Danaher s new reporting segments are effective as of the third quarter of * 2015 adjusted revenue reflects full year 2015 contribution from Pall Corporation. ** 2015 revenue does not reflect any contribution from the pending acquisition of Cepheid, which remains subject to customary closing conditions. Outstanding portfolio of businesses with >60% of revenue in the aftermarket
4 High Growth Markets Overview 2015 HGM Revenue* ~$4.6B* or ~28% of DHR total HGM revenue by segment as % of total HGM revenue Environmental & Applied Solutions Dental Diagnostics Life Sciences Significant and expanding presence in critical regions & markets Annual revenue breakdown by region China approaching ~$2B Latin America/Mexico ~$800M E. Europe (including Russia) ~$600M Middle East ~$500M Focused penetration in key verticals Investing in sales & marketing, research & development to drive growth Danaher Development Center in China Beckman Coulter R&D Center in China Diagnostics R&D Center in India On-the-ground DHR leadership in key regions Asia, India, Middle East, Russia and LatAm DBS University in Shanghai * 2015 adjusted revenue reflects full year 2015 contribution from Pall Corporation. HSD annual revenue growth in HGMs since 2011


5 Danaher China Overview 2015 China Revenue* ~$1.8B* China revenue* by segment as % of total China revenues Environmental & Applied Solutions Dental Segment Mix Diagnostics Life Sciences Life Sciences Research Government investment priority Medical Consumer demand and increasing access to care Penetration of dental care Expansion of privatized healthcare Environmental Government investment priority Water treatment and monitoring Packaging/Product ID Macro Drivers Increased consumer demand coupled with Chinabased small & medium-sized enterprise growth Increased focus on manufacturing automation and productivity * 2015 adjusted revenue reflects full year 2015 contribution from Pall Corporation. China annual revenues have nearly doubled from ~$1B to ~$1.8B since 2011


6 Regional Business Models Most of our businesses are currently in these phases Incubate Expand Commercial Capabilities Local Product Requirement Fully Local Business Model DRIVER Local markets emerge Local transactional requirement Limited incremental share gain with global product Local competitors with local models gain scale RESPONSE Sales Focus End Customer Focus Product Focus End to End Business Focus INITIATIVES Leadership Talent Feet on the Street Application support In-country Distributor Management and Expansion Service Local transactional infrastructure HR and Finance back office support Local marketing Channel M&A Local Product Planning and Management R&D Centers RA capability Product M&A Local manufacturing Direct end user relationship Develop local partners Local competitor M&A Phase 1 Phase 3 Phase 4 Phase 2 Further evolution of local business models critical to continued HGM success
7 China Evolution Rapid growth in domestic & export sales and number of in-country businesses since 2000 >$100M in annual revenues at Hach, Beckman Coulter, LBS, LMS, SCIEX, Pall, Product ID Accelerating localization: domestic sales >70% of China sales today vs ~55% in Sales <$100M ~$1B ~$1.8B* Operating Companies 1 ~10 ~15 Associates <250 ~3,500 >5,000 Manufacturing Sites 1 6 >10 Sales Offices 3 in 3 major cities >70 in 20 cities >100 in 27 cities R&D No product design >200 engineers >500 development engineers Market Coverage Coastal cities (BZ/SH/SZ) Major cities Expanded to Tier 2/3 cities Sourcing None 90 associates >100 associates Management Board None Preliminary 15 member Mgmt. Board * 2015 adjusted revenue reflects full year 2015 contribution from Pall Corporation. Increased sales >20X since 2000, HSD+ revenue growth since 2011


8 Global DHR Acquisitions Impact in China ~$2.8B FY 2015 Revenues* ~$725M 2015 Revenues* <$25M 2015 Revenues* <$25M 2015 Revenues* Served Markets/ Customers Biopharmaceuticals Energy Medical Devices Manufacturing General Practitioners Implantologists Universities Hospitals Pharmaceuticals Chemistry Food & Beverage Biochemists Clinical Research Gov t & Acad. Research Hospital & Reference Labs Strategic Rationale Provide high performance filters/membranes and services to diverse life science and industrial customers Use DBS to optimize operations, R&D, commercial execution, and resource allocation Leader in premium implant-based restoration solutions Help customers treat more patients with our suite of superior dental products Use DBS to drive efficiencies, productivity, and growth Comprehensive product portfolio offering Complementary to SCIEX customer workflows Use DBS to accelerate growth and scale manufacturing High performance, revolutionary flow cytometry technology Opportunities for product expansion, extend reach/ footprint *Represents 2015 global revenues. Enhancing Danaher s addressable markets and valuable brand position


 Group practices")

9 Dental Overview 2015 Financials Revenue ~$2.7B Revenue Breakdown Geographic 5% 15% 5% 25% NA China ROW 50% EU Other HGM OP Margin ~Mid-teens 30% Mix Consumables/Service Equipment 70% Market Size ~$15B Market Details Growth Drivers Global demographic trends aging population Growing middle class in high growth markets Digitizing the dental practice Cosmetic and aesthetics dentistry Customers General practices Specialists (endo/ortho/perio/surgical) Group practices Schools, hospitals and government Growth Rate +LSD/MSD All financial metrics based on Building a leading global dental franchise
10 China Dental Market Dentists Per 100K People 60 Dental Expenditures Per Capita 300 6X 10 30X 10 China USA China USA Key Growth Drivers Growing middle class and aging population Digitization of clinical workflow Cosmetic and Aesthetic dentistry Rise of private clinics Market Opportunities Shortage of qualified dentists Low operational efficiency in dental practice Low quality of dental care Underpenetrated market growing double-digits


11 Partnership for Full Dental Solution Business Segmentation Orthodontics Equipment Equipment Endodontics Product Needs Implant Restoratives Channel Model Channel Direct In-direct Regional National Dental Practice Service Needs Software Consumables Provide One Stop Solution with full portfolios and channel partnership


12 How Dental Wins in China Provide one stop solution with comprehensive product portfolio of leading brands Extensive offering in consumables, equipment, implants across entire treatment workflows M&A expected to enhance product offering, market access Strategic partnerships with dental group practices, clinic chains and major China dental societies Dedicated dental solution team to achieve platform advantage DBS support to drive practice efficiencies Use education to increase customer intimacy: KKG & Nobel sponsored events drive brand recognition and loyalty Increasing commercial coverage and investing in localized sites and R&D Now in 50+ cities in China Opened first China manufacturing plant in 2014 Dedicated R&D center to China market Opened new One site in Shanghai in 2016 New One Site Dental China Plant China R&D Center Local capabilities and strategic partnerships accelerate growth
13 Building a Winning Dental Platform in China Where we were in 2010 vs. Today SALES <$15M >$150M China Dental Revenue Annual $ ~$130M PRODUCT OFFERING Mainly equipment and ortho business Total solution, complete portfolio (equipment, ortho, implant, endo, restorative, hygiene) LOCAL PRESENCE 2 small rep offices ~40 associates Coastal cities ~10 offices >500 associates All Tier 1 & 2 cities ~$50M ~$70M LOCAL R&D No team, 0 engineers 1 R&D team, >30 engineers FACILITIES No manufacturing site 1 plant in Suzhou M&A 0 4 strategic investments ~$25M ~$35M MARKET LEADERSHIP Top 10 A leading player From top 10 to a leading market position while continuing to outgrow the market


14 DBS is Our Culture
15
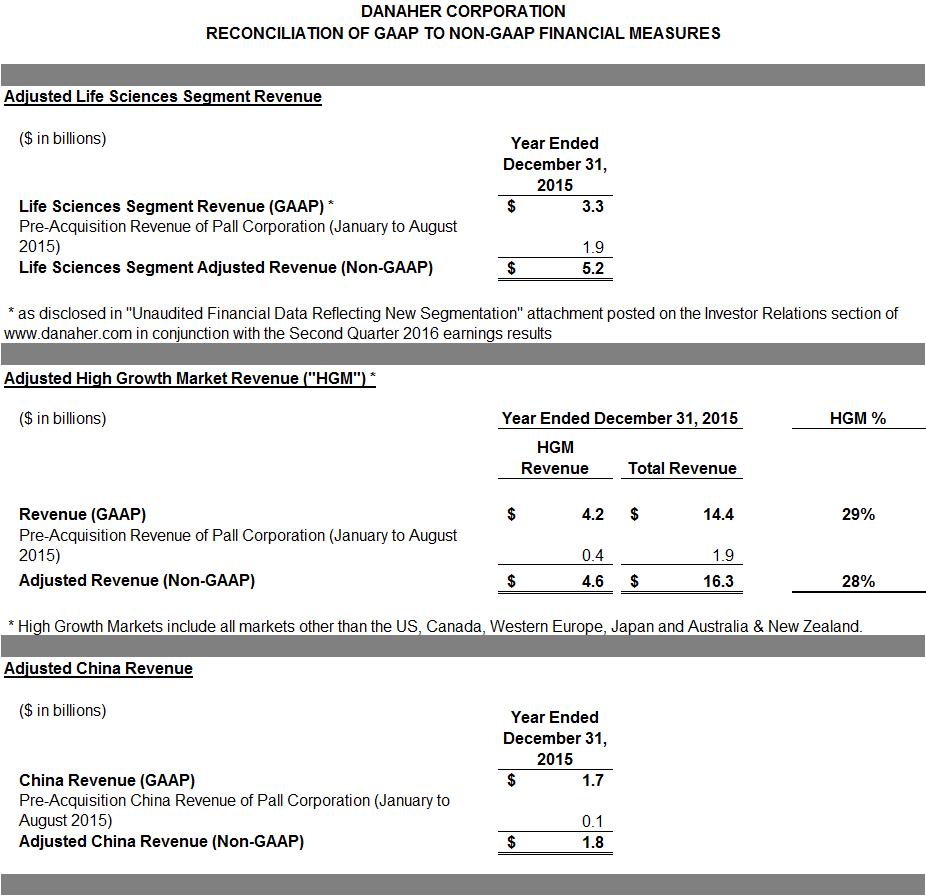
16 Non-GAAP Reconciliations