Improving Understanding and Prediction of Camber of Pretensioned Concrete Beams
|
|
|
- Kerry Manning
- 5 years ago
- Views:
Transcription
1 Department of Civil, Construction and Improving Understanding and Prediction of Camber of Pretensioned Concrete Beams Sri Sritharan Wilson Engineering Professor October 21, 2016

2 Department of Civil, Construction and Sponsor: Partners: Andrews Prestressed Concrete Team: M. Rouse, E. Honarvar, J. Nervig, W. He Project webpage:
3 Outline Background Primary Tasks Instantaneous Camber Long-term Camber MIDAS Analyses Key Findings
4 Camber of PPCBs Net upward deflection resulting from the applied prestress force after subtracting the downward self-weight deflection. Exists from the time the prestress is transferred until the dead and live load deflection exceeds that due to prestress. It is affected by variations in several parameters at different stages of a PPCB. Creates construction challenges.


5 Different Stages 1-3 days 1-3 Months Changes in Support Conditions and Environmental Variations 1 Month 1-2 Months


6 Challenges in the Field Underestimating Camber: Require addition of haunches Additional nonprestressed reinforcement (haunches exceeding four inches) Causes delays and increase costs Disputes in the field

7 Primary Tasks 1- Material characterization 2-Instantaneous camber measurements 3- Long-term camber measurements 4- Instantaneous camber predictions 5-Long-term camber predictions MIDAS simulations & Simplified methods


8 Material Characterization 4 HPC and 3 NC concrete mixes were evaluated for compressive strength, creep and shrinkage. Use AASHTO LRFD 2010 equation for concrete modulus of elasticity with appropriate modifications to concrete strength. 8
 = 1.9t0.")

9 Recommendations for HPC Average creep coefficient: φ(t) = 1.9t t 0.54 Average shrinkage strain: ɛ(t) = 480t t 0.62

10 Measurement Technique A tape measure reading is taken at the midspan of the beam immediately after release. Recorded to the nearest 1/16 in.
11 Recorded Historical Data


12 Rotary Laser Level A rotary laser level is used to measure the beam from the top flange, bottom flange, and the bed. Kept stationary Accurate up to 1/16 in. at 100 ft


13 String Potentiometers Continuous monitoring of the beam and precasting bed during release Accurate up to in. String potentiometer from top flange at Plant A String potentiometer on the precasting bed at Plant B


14 Camber Measurement Continued
15 Vertical Displacement, in. Instantaneous Camber BTB 100 Top strands release began Harped strands release began Harped strands release completed Bottom strands release began Bottom strands release completed Beam lift 4 Bed at Midspan Right End of Bed Top Flange at Midspan Events 3 Increase in camber due to PPCB ends overcoming friction 2 Increase in camber due to lift/set of PPCB Total increase in camber due to friction ,000 4,000 6,000 8,000 10,000 12,000 Time, sec
16 Bed Deflection
17 Example BTB 100 Predicted camber = 3.19 Plant Tape Measure Reading = 2-1/2 ISU Laser Level without bed deflections = 2.52 ISU Laser Level accounting for bed deflections and friction = 2.88 ISU String Pot = 2.937

18 Effect of Bed Friction Max. = 5/8 in. or 25%


19 Uneven surface along the top flange (max. = ¾ ) Inconsistency in the depth of the troweled surface (max. = ¼ to ¾ )
20 Factors affecting the instantaneous camber measurements Bed deflections (Error: in. ± in.) Friction (Error: in. ± 0.294) Inconsistent top flange surfaces along the beam length (Error: in. ± in.) Inconsistencies in the top flange surfaces resulting from local effects (Error: in. ± in.) New measurement technique has been recommended to minimize these measurement errors
21 Camber (in.) Tape Measure Reading from Precaster Camber (accounting for bed deflections, friction, and inconsistent top flange surfaces) String Potentiometers Improved camber data Variety of PPCBs arranged in Increasing Length


22 Factors affecting instantaneous camber predictions Modulus of elasticity Designed prestress force Prestress losses Sacrificial prestressing strands Transfer length Section properties Use AASHTO LRFD 2010 Equation Consider elastic shortening, seating losses, and relaxation Use AASHTO LRFD 2010 Equation Use transformed section
23 Influence of Release Strength 40% higher measured release strength for psi designed release strength 12% higher release strength for psi designed release strength
24 MIDAS Simulations Modeling Features Accurate section properties Accurate tendon profiles Accurate transfer of prestress Change in support location Creep and shrinkage effects Stage construction Change in boundary conditions Thermal effects Results may be affected by Measurement errors Variation in material properties Complex thermal gradient


25 MIDAS Model Instantaneous camber Camber
26 Predicted Camber (in.) MIDAS Instantaneous camber 5.00 Average Predicted Camber = Measured Camber Measured Camber (in.)
27 MIDAS Model Concrete Creep and Shrinkage Steel/Concrete Relaxation Use appropriate support location
28 Use a combination of: Finite Element Analysis (FEA) Time-Step Method ε t t = σ c t 0 σ 1 + φ t, t E c t t 1+φ t,τ 0 0 E c τ dσ c τ + ε sh t, t 0 + ε th Total Strain Creep Strain Elastic and Creep Strains Shrinkage Strain Thermal Strain ε c t = 0 t C(t0, t t 0 ) σ(t 0) σ(t 0 ) dt 0 n 1 j=1 ε c,n = ε c,n ε c,n 1 = σ j C t j, t n j n 2 σ j C(t j, t n j j=1
29 Measured Camber (mm) Measured and MIDAS Long-term Camber Measured Camber (in.) FEM- C80 FEM- D105 FEM- BTE110 FEM- BTC120 FEM- BTD135 FEM- BTE145 C80 D105 BTE 110 BTC120 BTD135 BTE Time (day)


30 Support Location Varies 4 x4 supports; overhang the depth of the beam. 4-ft long plywood; overhang 0 to 5 ft. 4 x8 supports; overhang 5% of the beam length

31 Parameters Affecting Long-term Camber Measurements Temporary Support Overhang Length
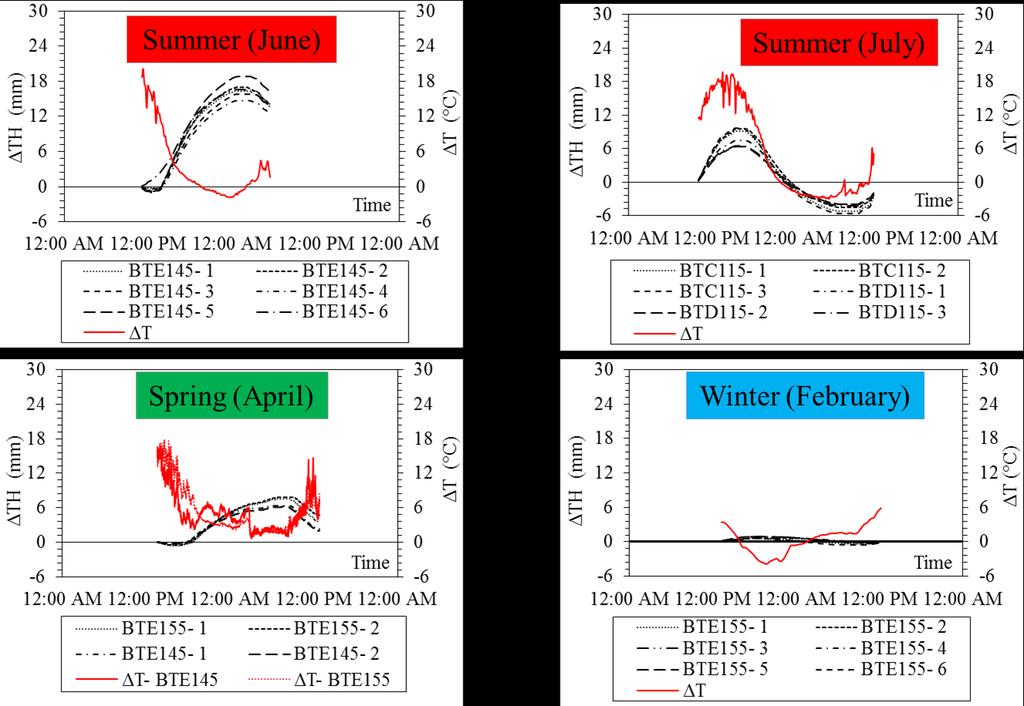
32 Thermal Camber


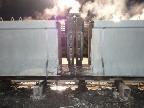
33 Quantifying Thermal Camber Instrumented PPCBs in Winter Instrumented PPCBs in Summer
34

35 Temperature Effects
36 Average Temperature Gradient
37 Sample Results

38 Comparison Zero temperature difference 15 F temperature difference

39 Midas Model Long-term camber View of the bridge spans: 3 BTD135
40 MIDAS Model

41
42 Multiplier, M Determining Multipliers Multipliers were produced by comparing the instantaneous camber to long-term MIDAS camber Multipliers as a function of time Average BTE 110 Average BTC 120 Average BTD Age (Day), t A set of multipliers without overhang (0-60 days; days; and over 180 days) Temperature gradient multiplier, λ T ( Use ΔT= 15 F) A set of multipliers with an average overhang length of L/30 (0-60 days; days; and over 180 days) A Single multiplier (Average at-erection age: 120 days) 42
: Multiplier Function with adjusted data for overhang Method 2, (M2): Set of multipliers- zero overhang Method 3, (M3): Set of multipliers- average overhang Method 4, (M4): Single")
43 Long-term Multipliers Acceptable difference between the measured and design camber is within ±1.0 in. Method 1, (M1): Multiplier Function with adjusted data for overhang Method 2, (M2): Set of multipliers- zero overhang Method 3, (M3): Set of multipliers- average overhang Method 4, (M4): Single Multiplier-zero overhang Method 5, (M5): Single Multiplier-average overhang Method 6, (M6): Current Iowa DOT approach
44 Key Findings Camber estimate is significantly affected by basic material properties (i.e., E c, sh, C cr ). Instantaneous camber is often inaccurately captured due to the construction practices and measurement techniques used at precast plants. When compared to accurate instantaneous camber measurements, both simplified methods and MIDAS FEMs produced good predictions when realistic E c is used.
45 Key Findings Long-term camber measurements are significantly affected by support location and solar radiation. Accuracy of multipliers is often compromised due to errors in the instantaneous and long-term camber measurements. MIDAS FEMs provided insight into the effects of support location, solar radiation, and the change in support condition as a function of time. MIDAS FEMs led to more realistic design multipliers

46 Publication