Civil Structural Monitoring of a CFRP Strengthened Concrete Bridge in Sweden Field Application
|
|
|
- Melvin Harris
- 5 years ago
- Views:
Transcription
 Professor,")

1 Civil Structural Monitoring of a CFRP Strengthened Concrete Bridge in Sweden Field Application Björn Täljsten (Presenter) Professor, Technical University of Denmark, Lyngby, Denmark, and Luleå University of Technology, Sweden Arvid Hejll Dr., Vattenfall Research & Development AB
2 Outline Why Strengthening? Strengthening principles Why monitoring? Monitoring principles The Panken Bridge Summary and Conclusions Acknowledgements


3 Why strengthening? There can be several reasons why strengthening of structures is needed, the most common are: New demands on existing structures, e.g. increased loads, changed codes etc. Mistakes in the design or production phase New user demands, reconstruction etc. Accidents Deterioration of existing materials/structural components * Figures from ISIS Canada


4 Strengthening principles There are many different ways to strengthen structures Refined calculations External bonding Increased cross-section External prestressing Change of structural system

5 Why monitoring? One reason may be if a phenomenon needs to be followed up Also if uncertainties in calculation models exists or if the strengthening effect needs to be verified
 Diagnostic System Calculations Simple")


6 Monitoring principles SHM-system (Structural Health Monitoring) Diagnostic System Calculations Simple measurements Diagnostic System MATLAB FE-Analysis Sensor System Strain gauges LVDT gauges Communication System GSM-Modem/Modem WWW interface Storage System Server/HD Acquisition System Sensors LVDT gauges and rig Load Cells Datalogger Energy Source Software Hardware
7 Monitoring principles Time strategies, local or global monitoring, load effects etc. Short- and long time monitoring Periodic, continuous or trigged monitoring Local or global monitoring Damage detection Static or dynamic monitoring etc. Hejll, 2007 Thesis can be downloaded at

8 Monitoring principles Structured approach Hejll, 2007

9 117 m A 13.0m 13.5m 21.0m 21.0m 21.0m 21.0m 13.5m A Beam slab bridge built in 1977 in RC, seven spans Cracks found in the webs in 1994 A detailed analysis in 2001 Classification calculation showed a 15 % need of increased flexural capacity Load test before and after strengthening Strengthening with CFRP laminates, 900 m, Sto FRP Plate S50C Two tests carried out, a third one shall be done during summer 2007


10 The Strengthening Work


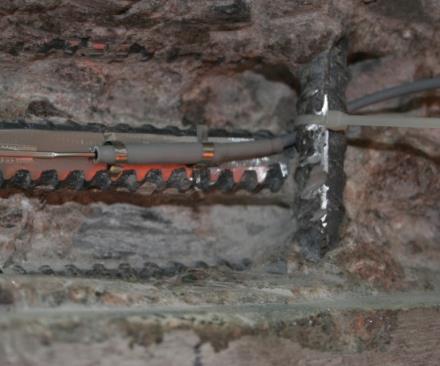
11 Scaffolding Grinding Cleaning Priming Bonding

12 Innovative solution Finishing the CFRP plate before the support following the strengthening need Aluminium Anchoring of the end Approx 200 mm x 15 mm


13 Periodic short term monitoring Before strengthening


14 Periodic short term monitoring After strengthening

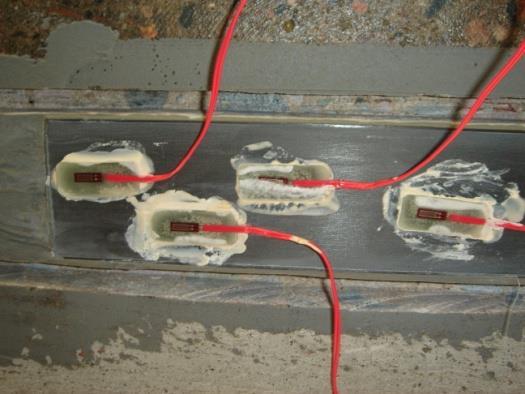
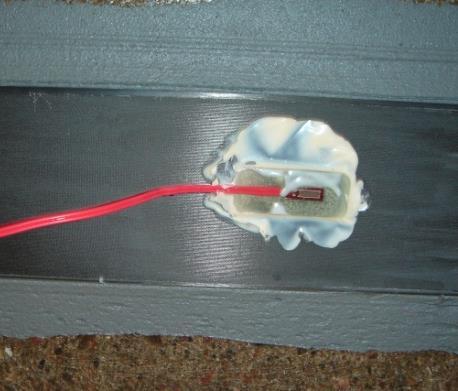
15 Periodic - Monitoring
16 Monitoring Sensor Distance, z, [mm] Girder Notation Concrete strain gauge 345 South STGCS Lower steel strain gauge 1450 South STGSLS Upper steel strain gauge 60 North STGSUN Concrete strain gauge 320 North STGCN Lower steel strain gauge 1450 South STGSLN Strain gauge(s) CFRP 1500 North/South STGCFRP Crack sensor 815 North inside COD1 Crack sensor 860 North outside COD2 Deflection 0 North L1 Curvature 0 North L2

17 Monitoring 1.85 STGSUN STGCS STGCN z STGSLS z COD1 STGSLN COD2 L1 & L2


18 Monitoring STGSUN STGCN z COD1 STGSLN COD2 At the cut off end L1 & L2

19 North Side Monitoring a 13,5 m 21 m 21 m 21 m 21 m 13,5 m a STGSUN STGCN STGSUN STGCN STGSLN STGCFRP STGSLN STGCFRP
20 Monitoring STGSUN STGCN STGSLN


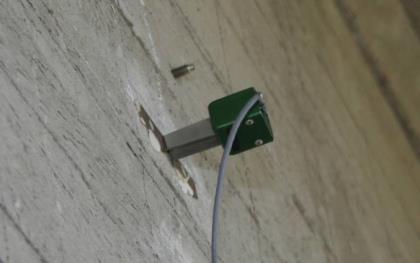
21 Monitoring COD2 COD1

22 Monitoring L1
 Et x Maximum for the test approximately = 0.")
23 µm/m LULEÅ UNIVERSITY OF TECHNOLOGY Efter 2 SN 1 Monitoring 40 6 F1 (Net) 7 F2 (Net) 8 F3 (Net) 9 F4 (Net) MGC 17 (time channel) Et x Maximum for the test approximately = 0.7 MPa f f At the cut off end
24 Monitoring Change in stiffness: two methods Local: Strain gauges over the cross section Global: straight edge plate (curvature) M EI
25 Monitoring Before strengthening After strengthening Before strengthening After strengthening Calculation of the curvature from the strains measurements Calculation of EI from the bending moment and the curvature c -29,24 ustr -27,8 ustr M 770 knm 770 knm t 93,79 ustr 69,5 ustr 4,643E-05 m -1 3,00E-05 m -1 z tot 1,39 m 1,39 m L 21 m 21 m d 4,643E-05 m -1 3,000E-05 m -1 d 0, , EI 1,66E+10 2,57E+10 EI 2,43E+10 2,66E+10 EI 1,66E+10 2,57E+10 EI 2,43E+10 2,66E+10 Local monitoring: stiffness increase of approx. 40 % Global monitoring gave a stiffness increase of approx. 25 % Theoretical calculation gave a stiffness increase of approx. 20 %
26 Discussion and Conclusion The strengthening was carried out successfully Monitoring verifies the strengthening effect Global and local curvature measurements give a clear indication about the stiffness change Curvature measurement may be a method to follow a structures performance over time
27 Acknowledgement Thanks to SBUF (The Swedish Development Fund for the Construction Industry), Skanska AB, The Swedish Road and Railroad authorities. That have financed this work