Performance-Based Seismic Evaluation of Wind-Impacted Tall Buildings
|
|
|
- Byron Gallagher
- 5 years ago
- Views:
Transcription
, Civil and Structural Engineering Consultants (Pvt.")
1 Performance-Based Seismic Evaluation of Wind-Impacted Tall Buildings Shilpa Nirman Thilakarathna, Design Office Manager (Senior Structural Engineer), Civil and Structural Engineering Consultants (Pvt.) Ltd


2 Contents Introduction Nonlinear Modeling Ground motion Scaling Experimental Building Results Twin Building Results
3 INTRODUCTION 3

4 Seismic and Wind Loads Wind Load Depend on Terrain Topography of the location Wind force increases as height increases Excitation is an applied pressure or force on the facade v A Seismic Load Depend on Focus of earthquake Ground conditions Excitation is an applied displacement at the base ü g m Force will act mainly on exterior frames then transferred to floor diaphragms Force will be distributed along interior and exterior lateral load resisting elements (Earthquakes tips, Murty)

5 Seismic and Wind design Wind Design For most buildings, dynamic wind response may be neglected Gust factor approach predict dynamic response of buildings with reasonable accuracy Structures are designed to respond elastically under factored loads Seismic Design Structures are designed to respond inelastically under factored loads It is not economically feasible to design structures to respond elastically to earthquake ground motion (Earthquakes tips, Murty) 5
6 Current Practicing Method When traditional design codes are employed, the calculated wind resistant demand can be higher than the seismic design demand (RSA method) due to reduction of elastic design load by force reduction factor The actual seismic demands(nlrha) can be higher than both wind and seismic design demand that are calculated according to the code based method

 + Moderate Seismic")
 Ltd.")
7 Building Models Experimental Building Orientation: Single Tower Number of Stories: stories Height: 19m Function: Office Use Orientation: Two towers in one podium Number of Stories: 5 stories in each towers Height: 1m Twin Building Design : Three wind levels (Low, Moderate, High) + Moderate Seismic Level 7 Function: Residential building Structural Engineer: Civil and Structural Engineering Consultants (Pvt) Ltd. Design : Moderate wind level + Moderate Seismic Level 7

 Dynamic Analysis # Nonlinear Time")
8 Seismic Analysis Procedures Equivalent Static Analysis (1st mode ) Static Analysis Linear Analysis Earthquake Analysis Methods Dynamic Analysis #Response Spectrum Analysis #Linear Time History Analysis Static Analysis # Multimode Pushover Analysis # Capacity Spectrum Method Nonlinear Analysis (PBD) Dynamic Analysis # Nonlinear Time History Analysis


9 Performance-based Design Performance based methods are required for the designer to assess how a building is likely perform under earthquake shaking and other extreme events and their correct application will help to identify unsafe designs Provides opportunity to clearly define the levels of hazards to be designed against, with the corresponding performance to be achieved (FEMA 51B)


10 PBD Guidelines PEER /5, Tall Building Initiative, Guidelines for Performance Based Seismic Design of Tall Buildings PEER/ATC 7-1, Modeling and Acceptance Criteria for Seismic Design and Analysis of Tall Buildings ASCE/SEI 1-13, Seismic Evaluation and Retrofit of Existing Buildings LATBSDC 1, An Alternative Procedure for Seismic Analysis and Design of Tall Buildings Located in the Los Angeles Region Performance-Based seismic design for Tall Buildings by CTBUH (17)
11 Performance Objectives Level of Earthquake Frequent/Service (SLE): 5% probability of exceedance in 3 years (3-year return period) Design Basis Earthquake (DBE): % probability of exceedance in 5 years (75-year return period) Maximum Considered Earthquake (MCE): % probability of exceedance in 5 years (75-year return period) Seismic Performance Objective Serviceability: Structure to remain essentially elastic with minor damage to structural and non-structural elements Code Level: Moderate structural damage; extensive repairs may be required Collapse Prevention: Extensive structural damage; repairs are required and may not be economically feasible (LATBSDC, ) Performance based tall building design guidelines published by other entities such as CTBUH (Council on Tall Buildings, ) and PEER (Pacific Earthquake Engineering Research Center (PEER), ) have followed performance objectives similar to those expressed in the LATBSDC document
 Residual drift (TBI, Page 71), (LATBSDC, Page ) Coupling beam inelastic rotation Structural Displacement Column Inelastic Rotation Value Maximum of mean values shall not exceed 3%.")
12 Acceptance Criteria Force Immediate Occupancy (IO) Life Safety (LS) Collapse Prevention (CP) Acceptance Criteria for Maximum Considered Earthquake (MCE) Item Peak transient drift (TBI, Page 71), (LATBSDC, Page ) Residual drift (TBI, Page 71), (LATBSDC, Page ) Coupling beam inelastic rotation Structural Displacement Column Inelastic Rotation Value Maximum of mean values shall not exceed 3%. Maximum drift shall not exceed.5%. Maximum of mean values shall not exceed 1%. Maximum drift shall not exceed 1.5%. ASCE 1-13 limits ASCE 1-13 limits Shear wall reinforcement axial strain.5 in tension and. in compression Shear wall shear Remain elastic. (Check for 1.5 times mean value) Girder inelastic rotation ASCE 1-13 limits Girders shear Remain elastic. 1
13 Nonlinear Modeling 13
 Columns Nonlinear (Fiber) Nonlinear (Fiber) Coupling Beams Link Beams Nonlinear (Moment/Shear Hinge)")
 Basement Walls Linear - Slabs Linear Linear - Capitol Twinpeaks_Perform 3D Model Experimental Building")
14 Nonlinear Modeling Components Twin Building Experimental Building RC Shear wall Nonlinear (Fiber) Nonlinear (Fiber) Columns Nonlinear (Fiber) Nonlinear (Fiber) Coupling Beams Link Beams Nonlinear (Moment/Shear Hinge) Nonlinear (Moment/Shear Hinge) Nonlinear (Moment/Shear Hinge) Beams (Girders) Linear Nonlinear (Moment/Shear Hinge) Basement Walls Linear - Slabs Linear Linear - Capitol Twinpeaks_Perform 3D Model Experimental Building _Perform 3D Model 1
15 Stiffness & Action Classification Concrete Element SLE/Wind DBE MCE Action Classification Core walls/shear walls Basement walls Coupling beams (Diagonal-reinforced) Coupling beams (Conventional-reinforced) Podium diaphragms Tower diaphragms Link Beams Columns Flexural.75 I g Shear 1. A g Flexural 1. I g Shear 1. A g Flexural.3 I g Shear 1. A g Flexural.7 I g Shear 1. A g Flexural.5 I g Shear. A g Flexural 1. I g Shear 1. A g Flexural.7 I g Shear 1. A g Flexural.9 I g Shear 1. A g Flexural ** Flexural. I g Shear 1. A g Shear. A g Flexural. I g Flexural. I g Shear. A g Shear.5 A g Flexural. I g Flexural. I g Shear 1. A g Shear 1. A g Flexural.35 I g Flexural.35 I g Shear 1. A g Shear 1. A g Flexural.5 I g Flexural.5 I g Shear.5 A g Shear.5 A g Flexural.5 I g Flexural.5 I g Shear.5 A g Shear.5 A g Flexural.35 I g Flexural.35 I g Shear 1. A g Shear 1. A g Flexural.7 I g Flexural.7 I g Shear 1. A g Shear 1. A g Flexure Shear Flexure Shear Flexure Shear Flexure Shear Flexure Shear Flexure Shear Flexure Shear Axial-Flexure Shear Deformation Controlled Force Controlled Force Controlled Force Controlled Deformation Controlled Force Controlled Deformation Controlled Force Controlled Force Controlled Force Controlled Force Controlled Force Controlled Deformation Controlled Force Controlled Deformation Controlled Force Controlled ** Nonlinear fiber elements automatically account for cracking of concrete because the concrete fibers have zero tension stiffness. ( 1 LATBSDC Alternative Analysis and Design Procedure, TBI- )
16 Damping Ratio Only Rayleigh Damping Only Modal Damping Disadvantage Shear wall structure with stiff coupling panels. After the panel yields (often in shear) the ductility ratio can be large, since the ßK damping coefficients remain constant. ßK energy dissipation might be overestimated and the deformations of the panel might be underestimated. ( PERFORM-3D User Guide, ) Disadvantage The only displaced shapes that have damping are those that correspond to the mode shapes (number of modes that entered in modal analysis). The total number of degrees of freedom in the structure will always be larger than the number of modes, so if only modal damping is used there will be many displaced shapes that are undamped. Combination of Rayleigh & Modal Damping Add a small amount of ßK (.1%) with modal damping (.%) to make sure that these higher mode displacements are damped. The effective additional modal or viscous damping shall not exceed.5% of critical for the primary modes of response. [ 1 LATBSDC Alternative Analysis and Design Procedure ] 1
 Hinge) 9 7 5 Shear Shear wall wall (Fiber (Fiber Section)")
 Shear Column")
 Deep Coupling Beam (Shear Displacement Hinge)")
17 Nonlinear Modeling Stress (MPa) Slender Slender Coupling Coupling Beams Beams & Girders & Girders (Moment (Moment Rotation Rotation Hinge) Hinge) Shear Shear wall wall (Fiber (Fiber Section) Section) 3 Steel Steel fibers fibers Un Confined Confined Perform 3D Inputs.E+ 1.E-.E- 3.E-.E- 5.E-.E- Concrete fibers Unconfined Concrete fibers Unconfined Strain (mm) Shear Column wall (Fiber (Fiber Section) Rigid Rigid end end zone zone Rigid Rigid end end zone zone Beam Beam Beam Beam Nonlinear Fiber Zone Slab Element (Elastic) Deep Coupling Beam (Shear Displacement Hinge) Confined Confined 17
18 Ground motion selection & scaling 1
19 Selection & Scaling ground motion Use PEER NGA and COSMOS databases (PEER, 5, COSMOS ) to find suitable ground motion records 7 ground motion records Use Etabs 1 & SeismoMatch software to match the records to target spectrum Use Frequency domain or Time domain matching method Frequency domain Method Time domain Method MCE response spectrum is assumed to be 1.5 times the 5% damped DBE response spectrum. 19


20 Selection & Scaling ground motion Response Spectrum - Colombo (1.5 DBE) The spectrum for MCE ground motion shall not be taken less than 1.5 times the DBE ( ASCE 7-) Sa (g) MCE DBE Aquaba ChiChi Period (s) Kobe Northridge LomPreita Taiwan (Numerical Simulation of Earthquake Induced Ground Motion in Sri Lanka a Finite Difference Approach) Fruili MCE DBE
21 Experimental Building Results 1


")

")


22 Coupling Beam D/C Ratio Building High Wind + seismic (55 m/s) (RSA) Moderate Wind + seismic ( m/s) (RSA) Low Wind + seismic (3 m/s) (RSA) Flexural D/C Ratio Shear D/C Ratio


 (RSA)")


23 Column D/C Ratio Building 3 High Wind + seismic (55 m/s) (RSA) Moderate Wind + seismic ( m/s) (RSA) Low Wind + seismic (5 m/s) (RSA) Flexural D/C Ratio D/C Ratio Shear D/C Ratio


")

")


24 Shear Wall D/C Ratio Building High Wind + seismic (55 m/s) (RSA) Moderate Wind + seismic ( m/s) (RSA) Low Wind + seismic (3 m/s) (RSA) Flexural D/C Ratio Shear D/C Ratio
 Model 1 Model Model 3 Limits 3..1..3 Rotation (rad) Model 1 Model Model 3 Limits B3 Summary Model 1")
25 Coupling Beam Rotation B Rotation (rad) Model 1 Model Model 3 Limits Rotation (rad) Model 1 Model Model 3 Limits B3 Summary Model 1 shows more rotation after around th floor only in B3 All the coupling beams are within the limit (CP) 5
26 Column Rotation Summary Rotation (rad) Rotation (rad) Model 1 Model Model 3 Model 1 Model Model 3 All the columns are within the allowable limit (CP) Columns in Model 1 show more rotation

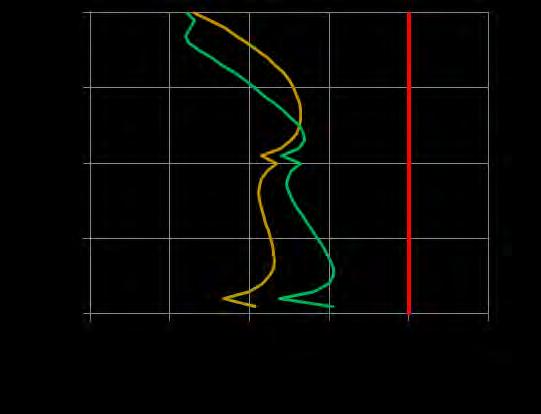
27 Axial Strain in Shear walls G Axial Strain (mm/mm) Axial Strain (mm/mm) 15 5 G3 Summary LOW MOD HIGH Limit LOW MOD HIGH Limit More yielding in model 3 Significant yielding can be seen in model 1 7
28 Twin Building Results

29 Expected results Nonlinear Analysis Obtain building properties Global Response Modal responses (period & mode shapes) Base shear/ Base moment shear/ moment displacement/ story drift Local Response Evaluate key elements Columns Coupling Beams/ Link Beams Shear walls Global Response Local Response 9
 The disconnected members are identified The symmetry of the")
30 Modal Analysis Mode Periods (s) Cumulative Modal Mass Participation Sum - X (%) Sum - Y (%) st and nd modes are in X and Y direction,3 rd mode in torsion Using Modal Analysis: Check The Time Period (within reasonable range) The disconnected members are identified The symmetry of the structure can be determined
31 Shear & Moment Shear Moment Level NL STORY SHEAR _X BFL Base Shear (KN) Aqaba Chi-Chi Kobe Northridge Loma Prieta Taiwan Fruili Average Level NL STORY SHEAR _Y BFL Base Shear (KN) Aqaba Chi-Chi Kobe Northridge Loma Prieta Taiwan Fruili Average Level NL STORY MOMENT _X BFL Base Moment (knm) Aqaba Chi-Chi Kobe Northridge Loma Prieta Taiwan Fruili Average Level BFL Base - NL STORY MOMENT _Y Moment (knm) Aqaba Chi-Chi Kobe Northridge Loma Prieta Taiwan Fruili Average
32 Displacement Tower 1 Tower X Direction Displacement (T1_H1) Displacement (m) Aqaba Chi-Chi Kobe Northridge Loma Prieta Taiwan Friuli Average LIMIT Y Direction Displacement (T1_H) Displacement (m) Aqaba Chi-Chi Kobe Northridge Loma Prieta Taiwan Friuli Average LIMIT X Direction Displacement (T_H1) Displacement (m) Aqaba Chi-Chi Kobe Northridge Loma Prieta Taiwan Friuli Average LIMIT Y Direction Displacement (T_H) Displacement (m) Aqaba Chi-Chi Kobe Northridge Loma Prieta Taiwan 3 Friuli Average LIMIT
33 Transient & Residual Drift Transient Drift Residual Drift X Direction Y Direction X Direction Y Direction Drift (T1_H1) Drift (%) Aqaba Chi-Chi Kobe Northridge Loma Prieta Taiwan Average LIMIT Drift (T1_H) Drift (%) Aqaba Chi-Chi Kobe Northridge Loma Prieta Taiwan Average LIMIT Transient drift of all the ground motions are within the limit Residual Drift (T1_H1) Drift (%) Aqaba Chi-Chi Kobe Northridge Loma Prieta Taiwan Friuli Average LIMIT Residual Drift (T1_H) Drift (%) Aqaba Chi-Chi Kobe Northridge Loma Prieta Taiwan Friuli Average LIMIT Residual drift of all the ground motions are within the limit 33


34 Energy Dissipation Energy dissipation (%) Total dissipated energy Dissipated energy from particular element type Time (sec) 3
35 Link Beam Rotation Tower 1 Tower Link Beam_B1 Element Number Link Beam_B5 Maximum Rotation (rad) IO Limit (rad) B Element Number Maximum Rotation (rad) IO Limit (rad) B.15.5 B.1.5 B B3.3.5 B Rotation (rad) Aqaba Chi-Chi Kobe Northridge Loma Prieta Taiwan Friuli Average Limits Rotation (rad) Aqaba Chi-Chi Kobe Northridge Loma Prieta Taiwan Friuli Average Limits

 IO Limit (rad) CB1 -.5 CB.15.5 CB3..5 5 3 3 3 3 3 Coupling Beam - CB7 1 1 1 1 -. -.1 -.1..1.1. Rotation (rad) CB -.")
36 Coupling Beam Rotation Tower 1 Tower Coupling Beam_CB Rotation (rad) Aqaba Chi-Chi Kobe Northridge Loma Prieta Taiwan Friuli Average Element Number Maximum Rotation (rad) IO Limit (rad) CB1 -.5 CB.15.5 CB Coupling Beam - CB Rotation (rad) CB -.5 Aqaba Chi-Chi Kobe Northridge Loma Prieta Taiwan Friuli Average Element Number Maximum Rotation (rad) IO Limit (rad) CB CB -.5 CB CB -.5
37 Column Rotations Tower 1 Tower Column_C7 Element Number Column_C Maximum Rotation (rad) IO Limit (rad) C.1. Element Number Maximum Rotation (rad) IO Limit (rad) C1.. 1 C C Rotation (rad) C.17. C Rotation (rad) C1.5. C.3. Aqaba Chi-Chi Kobe Northridge Loma Prieta Taiwan Friuli Average Limits Aqaba Chi-Chi Kobe Northridge Loma Prieta Taiwan Friuli Average Limits
38 Shear wall axial strain Tower 1 Tower Level Axial Strain Core Wall_G Axial Strain Aquba Chi-Chi Kobe Northridge Loma prieta Taiwan Friuli Average Steel yielding strain Max. compression srrain limit Location Number Compressiv e Strain X -3 Tensile Strain X -3 G G G Level Axial Strain Core Wall_G Axial Strain Aquba Chi-Chi Kobe Northridge Loma prieta Taiwan Friuli Average Steel yielding strain Max. compression srrain limit Element Number Compressiv e Strain X -3 Tensile Strain X -3 G G G

 Structural Displacement PBSD demonstrated in this work and applied to a real")
39 Conclusion Coupling Beams Safe Not exceed IO Limit Link Beams Safe Not Exceed IO Limit Columns Safe Few columns just exceed IO Limit. But it does not exceed (LS) Limit Shear Walls Safe Not yield Force Immediate Occupancy (IO) Life Safety (LS) Collapse Prevention (CP) Structural Displacement PBSD demonstrated in this work and applied to a real building which is being built is very efficient and take the current practice to a higher level


40 LOGO Special Thanks To Author Co-Authors Eng. Shilpa Thilakarathna Prof. Priyan Mendis Eng. Shiromal Fernando Dr. Tharaka Gunawaradane