Imaging Research Building
|
|
|
- Harold Stanley
- 5 years ago
- Views:
Transcription

1 University of North Carolina s Imaging Research Building Technical Report 3, LEED AP Structural Option Consultant- Dr. Thomas Boothby December 2, 2009
2 Table of Contents Executive Summary... 3 Introduction... 4 Architectural Design Concepts... 4 Structural System... 4 Foundation... 4 Superstructure... 6 Lateral System... 7 RAM Structural System Model... 8 Loads & Load Cases... 9 Gravity Loads... 9 Wind Loads Seismic Loads Load Combinations Load Path and Distribution Torsion Direct Shear Shear Strength Check Drift and Displacement Overturning Conclusion Appendix A Shear Wall Elevations Appendix B Wind Calculations Appendix C Seismic Calculations Appendix D Rigidity, Relative Stiffness, COR Calculations Appendix E Shear Wall Strength Check Calculations Appendix F Drift and Story Displacements Appendix G Overturning Calculations Page2 61
3 Executive Summary The third technical assignment includes an analysis and confirmation of the original lateral system designed by Mulkey Engineers and Consultants. The loads calculated in the first technical report were applied to the main lateral force resisting system composed of ordinary reinforced concrete shear walls. Necessary revisions were made to the initial wind and seismic loads. A RAM computer model was also created and its output was compared to hand calculations to verify the shear strength of the walls. Torsion and overturning and its impact on foundations were also examined this way. Overall building and story drifts from the RAM model were also compared to the allowable limits set forth by code and industry. The computer model used was a complete model of the building including gravity members. When analyzing the model RAM Frame was used to isolate the lateral force resisting system and its effect. Hand calculations were also performed since this was a first attempt at using RAM Frame. After reviewing the model s results and completing hand calculations, these values were compared. It was determined that the model was taken the slab s rigidity into account and shifted the center of rigidity, while calculations treated the shear walls as the only lateral force resisting elements. Therefore, the subsequent calculations including relative stiffness, torsion, direct shear, torsional shear, and overturning used the hand calculated results. In doing so, it was found that there is no serious concerns regarding torsion, shear, or overturning, which suggests that the shear walls are providing the majority of lateral resistance with minimal resistance from the slabs. Also, the drifts and displacements were found to be within the acceptable industry limits. Finally, a shear strength check was done of a north/south and east/west wall, with both walls being determined as being more than adequate. Page3 61
4 Introduction The Imaging Research Building, also known as IRB, is located on the University of North Carolina s Chapel Hill campus on Mason Farm road. It has an L shaped floor plan containing a re-entrant corner, with the long face dimensions of by It has an overall height of from Basement 2 (second floor subgrade) to the roof, with a setback at the mechanical mezzanine level. The building s usage will be a combination of research space, laboratories, and office space for the UNC. Architectural Design Concepts The Imaging Research Building at UNC Chapel Hill was designed by the architecture firm Perkins + Will. Its primary usage is the driving force behind many of the structural decisions for the project. Once it is open, it will contain the most advanced imaging equipment in any one spot in the world. First, the two subgrade floors house several heavy pieces of imaging research equipment that have large Gaussian fields. Because of this, foundations, walls, and slabs were made thicker than usual, which will result in the use of mass concrete pouring techniques to be required when constructed. For example, the foundation where a 1.5GHZ NMR machine will sit required a 6 thick mat footing. Above grade you will find typical bays sizes of 21-4 by 21-4, and 21-4 by 31-4 driven by the laboratory space requirements on every floor. A bridge also connects the new imaging research facility to existing Lineberger Cancer Center on the second floor. At the eighth floor, a large area houses all of the mechanical equipment with a partial mezzanine at the floor above, which services all of the imaging and laboratory equipment below. These architectural and usage restraints have a generous effect on the structural system as noted below, and hopefully in future technical reports. Structural System Foundation The geotechnical engineering study was performed by Tai and Associates on November 12, The study indicates that the subsurface materials on the site consist of pavement and topsoil, fill, residual soil, weathered rock, and rock and boulders. Based on this composition, Tai and Associates were confident in giving Mulkey a net allowable bearing pressure of 6000 pounds per square foot to use in their foundation calculations. Because of this allowable bearing pressure, Mulkey had to be creative with their foundation design. The result is a mixture of spread footings under the columns, and a combination of spread and mat footings under the large imaging research equipment and shear walls. The walls below grade range from 18 to 36 in thickness and in one location a 36 wall spans both subgrade floors to the first floor unbraced. An example of a typical mat footing can be seen in Figure 1.1. As with the other mat footings, this one is combined and sits under two pieces of large imaging equipment. It is 6-0 thick and also services a shear wall that steps 6 in elevation. Another area of note in the foundation Page4 61
5 design is a 6-0 thick concrete footing which will service a cyclotron, another heavy piece of imaging equipment. Figure 1.1 Typical Mat Foundation under Imaging Equipment Page5 61
6 Superstructure The first floor and the floors above to the eighth floor is a 6 one-way cast-in-place slab (NWC) with a compressive strength (f c) of 5 ksi. The beams on these levels are mostly 18 x20 T-Beams, which change directions at the re-entrant corner where the building changes directions. The girder dimensions vary, but are typically 28 x30. Most of the columns in the Imaging Research Building are 20 x20 square columns with #3 ties above the first floor, and 24 x24 below grade, with all them having a compressive strength of 7 ksi. The typical frame consists of four bays with three of them being approximately twenty feet in width and the other being thirty feet in width to accommodate the laboratories that occupy these spaces on almost every floor of the building. For more detail on the superstructure a section of the third floor framing is provided in figure 2.1 for reference. Figure Third Floor Framing Page6 61
7 Lateral System Ordinary reinforced concrete shearwalls are used as the main lateral force resisting system in the UNC Imaging Research Building. The largest shearwalls wrap around the main elevator and stairwell cores while the other ones encase mechanical closets. Most of the shearwalls run from the foundation to the mechanical mezzanine with only half of them continuing to the roof level. There are thirty-three shearwalls either 12 or 16 thick. Figure 1.3 shows an example of the shearwalls around the main stair and elevator core. Figure Shearwalls around Elevator Core The rest of the third technical report will discuss the lateral system in more detail. The lateral load paths, load distribution, torsion, drift, overturning, and several shearwall strength checks will be covered. An analysis from a RAM structural model that was created will also be compared to hand calculations for verification. Page7 61

8 RAM Structural System Model A model of the gravity and lateral framing was created using RAM Structural Suite software, and the lateral system was analyzed using RAM Frame. From RAM Frame, I was able to obtain the building s center of rigidity and center of mass. These numbers were compared to hand calculations which can be found in Appendix D. Also, the relative story drifts were able to be obtained from the RAM model. These numbers can be Appendix F. The RAM output is compared to the accepted allowable drift later in the report. Figure 2 - RAM Model Page8 61
9 Loads & Load Cases Since the focus of this report is on lateral force resisting systems, wind and seismic loads will be discussed in detail. Gravity loads have also been included as a reference, but they were omitted in this analysis for simplicity. Once a complete three-dimensional model is constructed, all loads will be considered simultaneously. Gravity Loads As stated in Technical Report 1, the determination of gravity loads by Mulkey Engineers and Consultants was done using the 2009 North Carolina State Building Code (2006 International Building Code with Revisions), which adopts ASCE 7-05 for its minimum design loads for buildings. This report also uses ASCE 7-05 as the main reference in accordance with the requirements of AE Senior Thesis. In several places, Mulkey chose to use higher design loads than what was stipulated by the building code. These differences along with the rest of the design loads are noted in the Mulkey column of Table 1, while the code loads are in the ASCE 7-05 column. Calculations of the snow load are provided in Appendix A. Table 1 -Gravity Loads Description Mulkey ASCE 7-05 Reinforced Normal Weight Concrete DEAD (DL) 150 pcf 150 pcf Roof LIVE (LL) 30 psf 20 psf Offices 50 psf 50 psf Public Areas, Lobbies 100 psf 100 psf Laboratories 100 psf 60 psf Corridors, 2nd & Above 100 psf 100 psf Corridors Ground 100 psf 100 psf Stairs 100 psf 100 psf Catwalk 40 psf 40 psf Storage 125 psf 125 psf Heavy File Storage 200 psf 250 psf Mechanical Rooms 150 psf 150 psf Level B1 150 psf N/A SNOW (S) Snow 16.5 psf 16.5 psf SUPERIMPOSED (SDL) Finishes, MEP, Partitions psf psf Bathroom Terrazo 40 psf N/A Lobby Terrazo 60 psf N/A Mechanical Courtyard 300 psf N/A 3T MRI Room 250 psf N/A 7T Sheilding 75 psf N/A Hot Cells 350 psf N/A Water Tank 350 psf N/A Page9 61
10 Wind Loads Wind loads were also previously determined in Technical Report 1 using ASCE 7-05 Section 6.5, which describes Method 2 Analytical Procedure. The variables used in this analysis are located in Table 2a and the calculations that support these values can be found in Appendix B. Table 2a - Wind Variables ASCE 7-05 References Basic Wind Speed V 95 mph (Fig. 6-1) Directionality Factor k d 0.85 (Table 6-4) Importance Factor I 1.15 (Table 6-1) Exposure Category B (Sec ) Topographic Factor K zt 1 (Sec ) Velocity Pressure Exposure Coefficient evaluated at Height z K z Varies (Table 6-3) Velocity Pressure at Height z q z Varies (Eq. 6-15) Velocity Pressure at Mean Roof Height (North/South) q h psf (Eq. 6-15) Velocity Pressure at Mean Roof Height (East/West) q h psf (Eq. 6-15) Equivalent Height of Struture > 94.6' (Table 6-2) Intensity of Turbulence I > (Eq. 6-5) Integral Length Scale of Turbulence L > 454.6' (Eq. 6-7) Background Response Factor (East/West) Q (Eq. 6-6) Background Response Factor (North/South) Q (Eq. 6-6) Gust Effect Factor (East/West) G (Eq. 6-4) Gust Effect Factor (North/South) G (Eq. 6-4) External Pressure Coefficient (Windward) C p 0.8 (Fig. 6-6) External Pressure Coefficient (E/W Leeward) C p (Fig. 6-6) External Pressure Coefficient (N/S Leeward) C p -0.5 (Fig. 6-6) Page10 61
11 For technical report 1, summary tables 2b and 2c were developed to determine the wind pressures in the north/south and east/west direction, respectively. In the north/south direction the building is exposed at the first basement level, therefore the wind pressure is higher than in the east/west direction. For Technical Report 3, an additional column has been added of the factored story forces (1.6 multiplier for the most critical case). Table 2b-Wind Loads (North/South) B=282'-4" L-247'-3" Height Force (k) Story Story Story Total Force (k) Factored Factored Above Wind Pressure (psf) of Shear Shear Floor Height Kz qz Pressure of Total Story Story Groundz (ft) Windward Leeward only (k) (k) Windward Windward Total (ft) (psf) Pressure Force (k) Force (k) Roof Mech Mez B Story Shear Story Shear Factored Story (Windward) = k (Total) = k Force = Floor Height Above Groundz (ft) Story Height (ft) Table 2c-Wind Loads (East/West) B=247'-3" L=282'-4" Kz qz Wind Pressure (psf) Windward Leeward Total Pressure (psf) Force (k) of Windward only Force (k) of Total Pressure Story Shear Windward (k) Story Shear Total (k) Factored Factored Story Story Force (k) Shear (k) Roof Mech Mez Story Shear Story Shear Factored Story (Windward) = k (Total) = k Force = Page11 61
12 Seismic Loads Seismic loads were also previously calculated in Technical Report 1 using chapters 11 and 12 of ASCE One possible reason as that for this is that for this analysis the Equivalent Lateral Force Method was used, despite the fact that IRB contains type two horizontal irregularities. This method was chosen for this report as a base method to approximate the seismic forces because type two horizontal irregularities require a more advanced modal response analysis which utilizes computer software which was not required for this technical report. These calculations along with a sample calculation of the building weight for one floor, and a diagram of the story shear and base shear as a result of the seismic loads, can be found in Appendix C. Table 3a provides a list of variables used where Table 3b shows the calculations of story shear and overturning moments via excel. ASCE 7-05 Table 3a - Seismic Design Variables References Site Class C (Table ) Occupancy III (Table 1-1) Importance Factor 1.25 (Table ) Structural System Building Frame Sytem: Ordinary Reinforced Concrete Shear Wall (Table ) Spectral Response Acceleration, short S s g (USGS) Spectral Response Acceleration, 1 s S g (USGS) Site Coefficient F a 1.2 (Table ) Site Coefficient F v 1.7 (Table ) MCE Spectral Response Acceleration, short S MS (Eq ) MCE Spectral Response Acceleration, 1 s S M (Eq ) Design Spectral Acceleration, short S DS (Eq ) Design Spectral Acceleration, 1s S D (Eq Seismic Design Category SDC B (Eq ) Response Modification Coefficient R 5 (Table ) Approximate Period Parameter C t 0.02 (Table ) Building Height (above grade) h n 162 Approximate Period Parameter x 0.75 (Table ) Calculated Period Upper Limit Coefficient C u 1.7 (Table ) Approximate Fundamental Period T a 0.92 s (Eq ) Fundamental Period Max T max 1.56 (Sec ) Long Period Transition Period T L 8 g (Fig ) Seismic Response Coefficient C s (Eq ) Structural Period Exponent k 1.21 (Sec ) Page12 61
13 Level Story Weight W x (k) Height h x (ft) Table 3b- Seismic Loads h x k w x h x k C vx Lateral Force F x (k) Story Shear V x (k) Moments M x (ft-k) Roof Mech Mez B w i h k i = ** F x =V x = k Moments M x = ft-k Total Building Weight (Above Grade) = k Page13 61
14 Load Combinations The following factored load combinations from Chapter 2 of ASCE 7-05 are applicable to this lateral load analysis: (Note: D i, F, F a, H, R, T, & W i are assumed to be zero) D D + 1.6L +0.5(Lr or S) D + 1.6(Lr or S) + (L or 0.8W) D + 1.6W + L + 0.5(Lr or S) D + 1.0E + L + 0.2S D + 1.6W D + 1.0E After examining the load combinations, it is apparent that regardless of the impact of gravity loads, the critical factored lateral load will be either 1.6W of 1.0E. Therefore, it makes sense to assess the controlling load in each direction based on the application of these factors. Page14 61
15 Load Path and Distribution When lateral forces come in contact with a building, the loads need a way to travel through the structure and into the ground. The path that the load takes is assumed to be determined by the concept of relative stiffness. The members that are the most rigid draw the forces to them. Therefore, the loads are transmitted through the diaphragms, to the shear walls, and down to the foundation. The Imaging Research building has thirty-three shear walls throughout the building encasing stairwell and elevator cores as well as mechanical shafts. Figure shows the numbered system assigned to each wall to better reference which shear walls are being discussed throughout this report. Figure 3 - Shearwall Plan Page15 61
16 The shear walls vary in thickness, most being 16 or 12, and in length. They also vary in height as well depending on the floor. These variables all affect the rigidity of the walls which in turn affects the relative stiffness of each element. The tables located in Appendix D define the rigidities of the walls in both the north/south and east/west directions. These rigidities were found using the following equations: 4 3 The rigidity values were then used to determine the center of rigidity on each floor with the equation: The values of both the center of mass (COM) and center of rigidity (COR) are located in Table 4. The coordinates found by hand and the RAM output are arranged in this table to show that the results are comparable. The COR values taken from the RAM model suggest that diaphragms are being considered in the determination of rigidity, as opposed to the hand calculations which are only assuming that the shear walls are being taken into account. For this report, the hand calculated values will be those used whenever COM and COR are needed. Page16 61
17 Table 4 Center of Rigidity Center of Mass Level Ram Output Hand Calculations Ram Output Hand Calculations x y x y x y x y Sub-Basement Basement Level Level Level Level Level Level Level Level Mech Mezz Roof The rigidity of the walls is also used to determine the relative stiffness. The relative stiffness of each element dictates what percentage of the lateral force is distributed to it. This is calculated by the equation: Table 5 lists the relative stiffness values obtained for all thirty-three shear walls at each level. These values can then be applied to the loads at each floor to determine how much load each wall will receive. Also, it important to note that as the length of the wall changes the relative stiffness varies as well. Page17 61
18 Table 5 - Relative Stiffness (%) East-West Force SW- 1 SW-4 SW-6 SW-10 SW-12 SW-14 SW-16 SW-18 SubBasement Basement Floor Floor Floor Floor Floor Floor Floor Floor Mech Mezz Roof SW-19 SW-21 SW-23 SW-24 SW-26 SW-28 SW-29 SW-31 SW-33 SubBasement Basement Floor Floor Floor Floor Floor Floor Floor Floor Mech Mezz Roof North-South Force SW-2 SW-3 SW-5 SW-7 SW-8 SW-9 SW-11 SW-13 SubBasement Basement Floor Floor Floor Floor Floor Floor Floor Floor Mech Mezz Roof SW-15 SW-17 SW-20 SW-22 SW-25 SW-27 SW-30 SW-32 SubBasement Basement Floor Floor Floor Floor Floor Floor Floor Floor Mech Mezz Roof Page18 61
19 Torsion Torsion is present when the center of mass and the center rigidity are not in the same location. This results in an eccentricity and moments and torsional shear are produced. Torsional shear can be determined from the following equation: V tot = story shear e = distance from the center of mass to the center of rigidity d i = distance from element to the center of rigidity R i = relative stiffness of the element J = torsional moment of inertia = (R x d i 2 ) As an example, the torsional shear was computed for the shear walls supporting Floor 6 and can be found in table 6. Page19 61
20 Table 6 - Torsional Shear in Shear Wall Supporting Floor 6 Factored Story Shear V tot (k) Relative Stiffness R i Distance from COM to COR e Distance from Wall X to COR di (R i )(d i 2 ) Torsional Shear (k) SW-2 N/S SW-3 N/S SW-5 N/S SW-7 N/S SW-8 N/S SW-9 N/S SW-11 N/S SW-13 N/S SW-15 N/S SW-17 N/S SW-20 N/S SW-22 N/S SW-25 N/S SW-27 N/S SW-30 N/S SW-32 N/S SW-1 E/W SW-4 E/W SW-6 E/W SW-10 E/W SW-12 E/W SW-14 E/W SW-16 E/W SW-18 E/W SW-19 E/W SW-21 E/W SW-23 E/W SW-24 E/W SW-26 E/W SW-28 E/W SW-29 E/W SW-31 E/W SW-33 E/W Torsional Moment of Inertia J= (R i )(d 2 i ) = Page20 61
21 Direct Shear Direct shear is that which is caused by the lateral forces acting on a building that are distributed to the shear walls. These values are determined by multiplying the story shear by the relative stiffness of each member. The direct shears that are applied to each wall can be found in table 7. Load Combination 0.9d + 1.0E + 1.6H Force (k) SW- 1 SW-4 SW-6 SW-10 SW-12 SW-14 SW-16 SW-18 SubBasement Basement Floor Floor Floor Floor Floor Floor Floor Floor Mech Mezz Load Combination 1.2D + 1.6W + L + 0.5Lr Factored Force (k) Force (k) Factored Force (k) Table 7 - Direct Shear East/West Distributed Forces (k) Roof Distributed Forces (k) Force (k) Factored Force (k) SW-19 SW-21 SW-23 SW-24 SW-26 SW-28 SW-29 SW-31 SW-33 SubBasement Basement Floor Floor Floor Floor Floor Floor Floor Floor Mech Mezz Roof North/South Distributed Forces (k) SW-2 SW-3 SW-5 SW-7 SW-8 SW-9 SW-11 SW-13 SubBasement Basement Floor Floor Floor Floor Floor Floor Floor Floor Mech Mezz Roof Factored Distributed Forces (k) Force (k) Force (k) SW-15 SW-17 SW-20 SW-22 SW-25 SW-27 SW-30 SW-32 SubBasement Basement Floor Floor Floor Floor Floor Floor Floor Floor Mech Mezz Roof Page21 61
22 Shear Strength Check In order to confirm the shear strength of the shear walls, a check must be done that takes into account both the torsional and direct shears being applied. According to ACI Section the shear strength of a reinforced concrete shear walls is defined as: Since there are thirty-three shear walls, a sample of two walls, one in the north/south direction and one in the east/west direction was taken to spot check shear strength. The hand calculations of the strength check done at these two walls supporting Floor 6 can be found in Appendix E. Both walls were well within the capacity determined with the above equations which can be seen in Table 8. Table 8 - Shear Wall Strength Check (Supporting Floor 6) Floor 6 Direct Torsional Vert. Spacing Length Thickness V u (k) Shear (k) Shear (k) Reinf. (in) (in) (in) Acv (in 2 ) α c ρ t φv n (k) Wall (2) #7 18" Wall (2) # Page22 61
23 Drift and Displacement Drift is serviceability consideration in building design that in inversely proportionate to rigidity. The drift has been limited to 1/400 th of the overall building height which originated from the Structural Engineering Handbook (1968) by Gaylord and Gaylord. In the case of the Imaging Research Building, the drift limit is: 1728" 4.32" 400 The story displacements taken from the RAM model are located in Appendix F. All of the load cases are presented but only the controlling wind and controlling seismic values are highlighted. The RAM output verified are previous assumption that the controlling load cases were 1.6W and 1.0E. Once totaled, the overall building drift in the x-direction (due to east/west forces) = 3.43 which is below 4.32 Similarly, the drift in the y-direction (due to north/south forces) = 2.82 is within the limits enforced. Page23 61
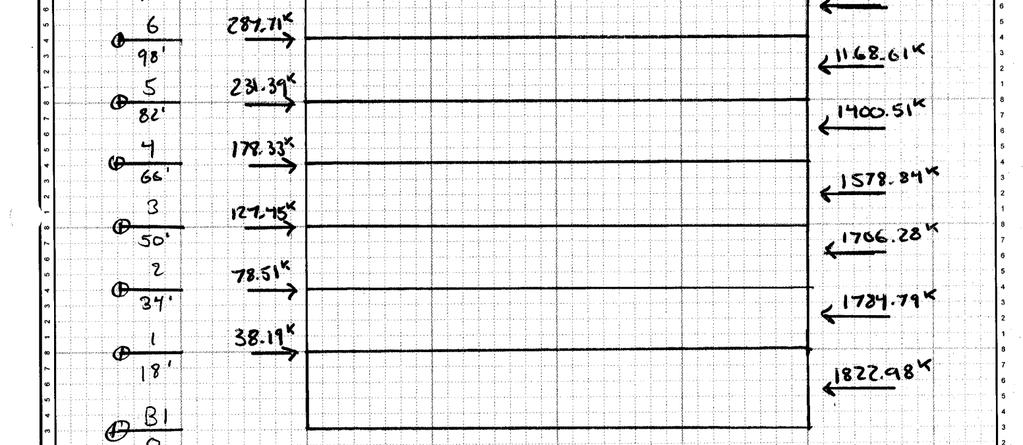
24 Overturning Overturning moments are due to the presence of the lateral forces and can be found by multiplying the story forces by their mid-heights. This was done with the north/south wind forces and the east west seismic forces with values shown in Table 12. These moments are transformed into axial loads as they are transmitted through the lateral elements and into the foundation. To do a rough estimate of whether or not overturning would be an issue in the Imaging Research Building, the stresses due to these lateral loads were examined and compared to the stresses due to the dead load (self weight) of the building which serves to counteract the overturning. Calculations supporting this estimate can be found in Appendix G. Because the stresses produced by the lateral forces are only a small fraction of that produced by the self weight of the structure, the overturning will have a minimal effect on the foundation. Due to the presence of the moments, however, it is expected that there will be a slight increase of force around the perimeter with a small uplift force on the windward side and a slight downward force on the leeward sides. Floor Height Above Ground-z (ft) Table 9 - Overturning N/S Wind Forces Story Height Factored Lateral Force Fx (k) Moment Total (ft-k) E/W Seismic Forces Lateral Force Fx (k) Moments Mx (ft-k) Roof Mech Mezz Basement Page24 61
25 Conclusion Once adjusting the values found in the first technical assignment, the lateral forces were applied to the Imaging Research Building. These loads were then factored according to ASCE 7-05 load combinations for strength design. It was determined that the combination of 1.2D + 1.6W + L + 0.5(Lr or S or R) controlled in the north/south direction, while 0.9D + 1.0E + 1.6H controlled in the east/west direction. The reason for the wind controlling in one direction and the seismic in the other is that the building is exposed one full story more in the north/south direction and it is also has slightly larger façade in that direction then in the east/west direction. Although the RAM model was used as reference and in some comparisons to verify that the model and hand calculations were providing similar and reasonable results, the values computed by hand were those used in all subsequent calculations. The reason behind this was because although fairly familiar with RAM, this was the first attempt at modeling the lateral system in the program and using RAM Frame to analyze it, and there was some uncertainty as to whether or not everything was input with all the proper assumptions. Therefore, to ensure consistency and to verify that only the shear walls were acting to resist lateral forces, hand calculations were done. This report confirms that looking to the shear walls alone was a reasonable assumption. There was torsion due to the eccentricity between the center of mass and the center of rigidity that added torsional shear to the walls. Shear strength checks were done including both the direct and torsional shear and it was deduced that the thickness, length and reinforcement were designed to adequately resist the total shear. Overall building drift, as determined by RAM output, was within the limit of H/400. Overturning is present due to the lateral loads, but a stress check concluded that the self weight of the building can do most of the work to resist this. A more complex model and additional calculations will follow when the second portion of senior thesis begins. At this stage of analysis, however, it was determined that the shear walls were satisfactorily designed to resist various combinations of loading. Page25 61
26 Appendix A Shear Wall Elevations (This page was intentionally left blank) Page26 61
27 Appendix B Wind Calculations (This page was intentionally left blank) Page27 61


28 Page28 61


29 Page29 61
30 Page30 61
31 Page31 61


32 Page32 61


33 Page33 61

34 Page34 61

35 Page35 61
36 Appendix C Seismic Calculations (This page was intentionally left blank) Page36 61


37 Page37 61


38 Page38 61

39 Page39 61
40 Appendix D Rigidity, Relative Stiffness, COR Calculations (This page was intentionally left blank) Page40 61
41 Page41 61
42 Page42 61
43 Page43 61
44 Wall East-West Walls (Sub Basement to Basement, Basement to First Floor) Modulus Distance Height, Length, Relative Thickness, t of from H L Rigidity, R Stiffness R*d Elasticity, Reference % E (ksi) Point COR (Y-Coord.) SW SW SW SW SW SW SW SW SW SW SW SW SW SW SW SW SW R*d = Page44 61
45 Wall Thickness, t East-West Walls (Floors 1-2,2-3,3-4,4-5,5-6,6-7,7-8) Distance Modulus Height, Length, Relative from of H L Rigidity, R Stiffness Reference Elasticity, % Point E (ksi) R*d COR (Y-Coord.) SW SW SW SW SW SW SW SW SW SW SW SW SW SW SW SW SW R*d = Page45 61
46 Wall Thickness, t Height, H Length, L East-West Walls (8-Mech. Mezz) Modulus of Elasticity, E (ksi) Rigidity, R Relative Stiffness % Distance from Reference Point R*d COR (Y-Coord.) SW SW SW SW SW SW SW SW SW SW SW SW SW SW SW SW R*d = Wall Thickness, t Height, H East-West Walls (Mech Mezz to Roof) Length, L Modulus of Elasticity, E (ksi) Rigidity, R Relative Stiffness % Distance from Reference Point R*d COR (Y-Coord.) SW SW SW SW SW SW SW SW SW SW SW R*d = Page46 61
47 Wall North-South Walls (Sub Basement to Basement, Basement to First Floor) Distance Modulus Height, Length, Relative from of H L Rigidity, R Stiffness Reference R*d Elasticity, % Point E (ksi) Thickness, t COR (X-Coord.) SW SW SW SW SW SW SW SW SW SW SW SW SW SW SW SW R*d = Page47 61
48 Wall Thickness, t North-South Walls (Floors 1-2,2-3,3-4,4-5,5-6,6-7,7-8) Distance Modulus Height, Length, Relative from of H L Rigidity, R Stiffness Reference Elasticity, % Point E (ksi) R*d COR (X-Coord.) SW SW SW SW SW SW SW SW SW SW SW SW SW SW SW SW R*d = Page48 61
49 Wall Thickness, t Height, H North-South Walls (8-Mech Mezz.) Length, L Modulus of Elasticity, E (ksi) Rigidity, R Relative Stiffness % Distance from Reference Point R*d COR (X-Coord.) SW SW SW SW SW SW SW SW SW SW SW SW SW SW SW SW R*d = Wall Thickness, t Height, H North-South Walls (Mech Mezz to Roof) Length, L Modulus of Elasticity, E (ksi) Rigidity, R Relative Stiffness % Distance from Reference Point R*d COR (X-Coord.) SW SW SW SW SW SW SW SW SW SW SW R*d = Page49 61
50 Appendix E Shear Wall Strength Check Calculations (This page was intentionally left blank) Page50 61
51 Page51 61
52 Page52 61
53 Appendix F Drift and Story Displacements (This page was intentionally left blank) Page53 61
54 Page54 61
55 Page55 61
56 Page56 61
57 Page57 61
58 Page58 61
59 Page59 61
60 Appendix G Overturning Calculations (This page was intentionally left blank) Page60 61
61 Page61 61