Newberg Inflow and Infiltration Study WES 2017 PETER OLSEN, PE EMILY FLOCK, EI 1
|
|
|
- Claude Park
- 5 years ago
- Views:
Transcription


1 Newberg Inflow and Infiltration Study WES 2017 PETER OLSEN, PE EMILY FLOCK, EI 1

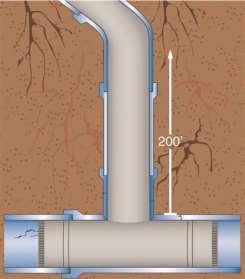
2 What is Infiltration and Inflow? Infiltration and inflow (I/I) represent extraneous groundwater and storm water runoff that enters the wastewater system. Infiltration is groundwater that enters the system through leaky pipes and manholes. Inflow is storm water that enters the system through direct connections, i.e. roof drains, catch basins, C/O, etc. 2
3 Infiltration Groundwater that enters the wastewater system through leaky pipes and manholes. 3


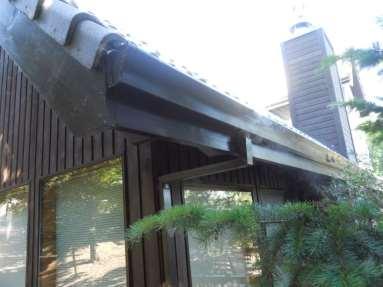
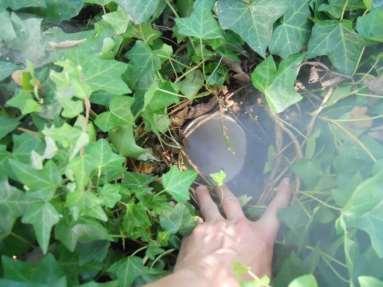
4 Inflow Storm water runoff that enters the wastewater system through direct connections. Roof drains Holes in manhole lids Catch basins Broken or open cleanouts Foundation drains 4

5 Why should you care? Infiltration and inflow increases the flow to your wastewater system Accelerates and increases size of capital improvements Increases conveyance, treatment, and mitigation costs Increases risk of sanitary sewer overflows (SSOs) and NPDES violations 5
6 Existing EPA Guidance If the average dry weather flow (DWF) is less than 120 gallons per capita per day (gpcd), then the amount of infiltration is considered non-excessive 1. If the average wet weather flow (WWF) is less than 275 gpcd, then the amount of inflow is considered nonexcessive 1. 1 U.S. Environmental Protection Agency: Infiltration / Inflow, I/I Analysis and Project Certification. Ecology Publication No , May


7 Components of an I/I Program Collect data Identify I/I sources Identify appropriate rehabilitation approach Focus on areas where you get greatest return on investment Look for smoking guns Perform cost/benefit analysis Develop budget and capital improvement plan Monitor improvements 7


 Regular CCTV data GIS")

8 Collect Data A good program requires good data. Basic, Ongoing Data Daily lift station pump run time data Precipitation data Hourly SCADA data (at WWTP and lift stations) Regular CCTV data GIS (material and condition data) Periodic, Supplementary Data Flow monitoring Night-time monitoring Smoke testing Dye testing 8


9 Identify I/I Sources Pump run time analysis Flow monitoring Smoke testing Night time monitoring Video inspection Dye testing Narrows down worst basin/s Narrows down worst areas Smoking guns Narrows down flow monitoring results Pipe conditions and indicators Tracks I/I sources 9

 Look at night-time flows You may need help gathering and processing")
10 Identify I/I Sources Use the data to quantify I/I and focus efforts. Compare flows in basins to wintertime water consumption Look at seasonal changes Look at responses to storm events (may need to get out in the rain) Look at night-time flows You may need help gathering and processing the data 10


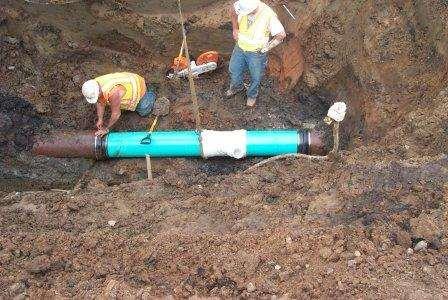
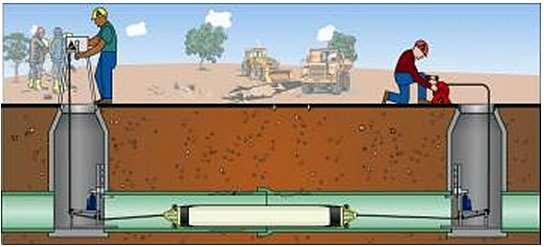
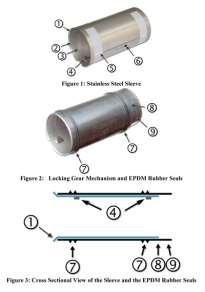
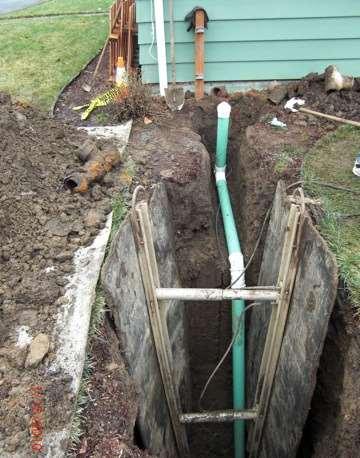
11 Identify Appropriate Rehabilitation Approach Pipeline rehab Open trench Trenchless Spot repairs Lateral rehab Full replacement Grouting Liners Manhole rehab Full replacement Grouting Lining 11


12 Identify Appropriate Rehabilitation Approach OPEN CUT Appropriate when surface repair is minimal, when pipe sags need to be repaired, when pipe needs to be upsized more than one nominal size, and when there are many lateral repairs PIPE BURSTING Appropriate trenchless technology; typically allows upsizing of one nominal size Open cut still required at lateral and near insertion/extraction pits; special considerations for some pipe types, soil materials, and shallow bury depths CURED-IN-PLACE PIPE (CIPP) Appropriate trenchless technology when host pipe is desired size and grade Lateral repairs possible, but costly OTHER METHODS Directional drilling, bore, slip lining, host of spot repair options 12
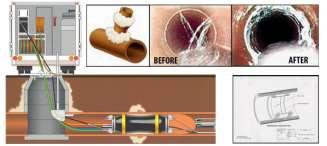
13 Rehabilitation Options Spot repairs 13
14 Rehabilitation Options Lateral rehabilitation 14
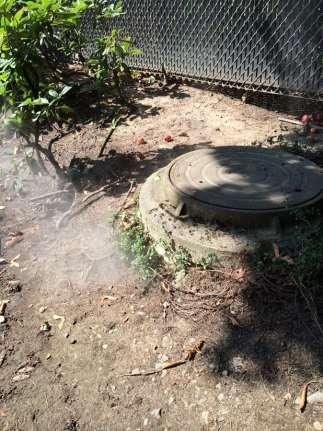
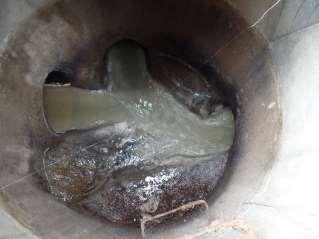
15 Rehabilitation Options Manhole rehabilitation 15

16 Rehabilitation Options Disconnect direct connections 16

17 After You Have the Data Risk considerations Cost / benefit analysis Prioritizing improvements Developing annual replacement plan and budget Maintaining I/I reduction program 17
")


18 Risk Considerations Risk = likelihood of failure (x) consequence of failure Consequence considerations Trunk line (size, number of connections) Schools, hospitals, etc. Risk of SSO s (proximity to waterway) 18
19 Prioritizing Improvements Prioritize based on multiple criteria CCTV reports Pipe age and material Observed infiltration Consequence of failure Grouped projects Separate lists for cross connections and spot repairs, organized by $/gpm 19

20 Cost / Benefit Estimated cost of rehabilitation Estimated cost to convey and treat wastewater Calculated annual replacement budgets 20

21 Cost / Benefit Analysis Compares cost to convey and treat versus cost of rehabilitation Challenges Quantifying flow reduction Assigning conveyance and treatment cost to an incremental increase/decrease of flow Assessing impacts for offsetting / delaying capacity-required capital construction costs 21


22 Rehabilitation Costs Traditional pipe replacement (8 line) Trenchless pipe replacement Up to 40% savings Spot repairs $2000 for 3 ft spot repair liner Lateral rehabilitation $50/LF open trench Manhole rehabilitation $180/LF $3500/lateral trenchless lining $60/sqft rehab and lining Costs are variable and function of pipe size and length, material, depth, water table, location, etc. 22
23 Sample Cost / Benefit Analysis Cost to convey and treat Fixed and variable costs I/I inconsistent flow, based on rainfall and groundwater Variable intensity of rainfall Variable duration of rainfall Wastewater Fund 2012 Budget 2012 Actual 2013 Budget 2013 Actual 2014 Budget 2014 Actual Operations (WWTP) Administrative $ 1,012,123 $ 998,541 $ 1,015,456 $ 1,009,070 $ 1,198,528 $ 1,201,023 Operating supplies $ 144,580 10% $ 14,458 Engineering $ 296,200 $ 247,157 $ 192,306 $ 199,725 $ 246,865 $ 250,357 Utilities $ 282,655 40% $ 113,062 Operations (WWTP) $ 1,718,746 $ 1,489,899 $ 2,053,923 $ 1,941,149 $ 2,044,137 $ 1,964,612 Equipment Repair and Maintenance $ 147,680 25% $ 36,920 WW Collection (Maint) $ 981,379 $ 653,889 $ 817,337 $ 598,013 $ 1,017,266 $ 766,426 Pump Station Maintenance $ 6,531 50% $ 3,266 Debt Service Payments $ 736,877 $ 736,877 $ 729,408 $ 729,430 $ 1,467,558 $ 1,467,558 Transfers Out WW Collection Total $ 4,745,325 $ 4,126,363 $ 4,808,430 $ 4,477,387 $ 5,974,354 $ 5,649,976 Supplies & Tools $ 15,867 25% $ 3,967 Total minus Debt service $ 4,008,448 $ 3,389,486 $ 4,079,022 $ 3,747,957 $ 4,506,796 $ 4,182,418 Inflow/Infiltration $ 4, % $ 4,105 Wastewater Rehabilitation $ 58,000 75% $ 43,500 Wastewater System Replacement $ 6,417 50% $ 3,209 Manhole Rehabilitation $ - 50% $ - Dry Season flow 1.7 mgd 1181 gpm Lateral Replacement $ 16,012 70% $ 11,208 Wet Season flow (avg) 5.1 mgd 3542 gpm Equipment Repair and Maintenance $ 4,510 25% $ 1,128 Wet Season flow (peak) 17.6 mgd gpm Pipe and Materials $ 20,541 25% $ 5,135 $ 3, $/gpm $ 0.82 $/gallon/day $ 1, $/gpm $ 239,957 $ $/gpm average daily flow 3.4 mgd average daily flow 2361 gpm cost per gpm removed $ $/gpm payback in 10 years $ 1, This does not account for potential to offset treatment plant or other capital improvements 23
24 Focus on Areas Where You Get Greatest Return on Investment 1) Look for smoking guns 2) Utilize cost/benefit analysis 24


25 Smoking Guns Manhole gushers Disconnect direct connections Often highest return for lowest cost: Roof drains Catch basins Open/broken C/O caps Storm system connections 25

26 Sample Cost/Benefit Analysis - Smoking Guns Cross Connections Rational Method Cost to remove GPM benefit Relative comparison 26
27 Annual Budgets & Capital Improvement Plan Identified projects become part of CIP Educate and present budget Additional budget elements: Pipeline replacement/rehab Lateral replacement/rehab Manhole replacement/rehab Inspections/monitoring 27
28 Replacement Budgets Annual asset replacement quantity for sustainable system: Quantity of Asset Life Cycle of Asset = Quantity of Asset per Year to be replaced xample: 75 miles of mainline 100 year life cycle = 0.75 mile year ft (3,960 ) to be replaced year 28
29 Monitor Improvements Continue to collect data Flow monitoring Pump run times SCADA Monitor rehabilitation for improvements Results of rehab can be used to plan future I/I elimination projects NPDES requirements Share your successes! 29


30 Case Studies Ashland, OR Newberg, OR Stayton, OR 30
 infiltration Storm response")
31 Case Study: Stayton, OR Seasonal (shallow groundwater) infiltration Storm response 31

32 Case Study: Stayton, OR Pump run time analysis Flow monitoring Night-time monitoring Dye tests Reviewed CCTV logs 32
33 Case Study: Stayton, OR Demonstrated I/I improvement through historic data Routine CCTV schedule and subsequent repairs Identified basin with highest I/I Subsequently, narrowed down worst sub-basin and largest contributors in sub-basin Developed list of priority improvements Suggested flow monitoring program similar to CCTV program Continue CCTV program and repairs 33
 New construction")
34 Case Study: Ashland, OR Initial considerations: Older pipes (clay and concrete) New construction 34

35 Case Study: Ashland, OR Pump run time analysis Flow monitoring Night-time monitoring Smoke testing 35


36 Case Study: Ashland, OR Focused on basin with highest I/I Narrowed down sub-basin with highest contributions Cost/benefit analysis Compiled list of cross connection inflows Estimated rehabilitation costs Proposed areas for CCTV inspections and ongoing flow monitoring 36

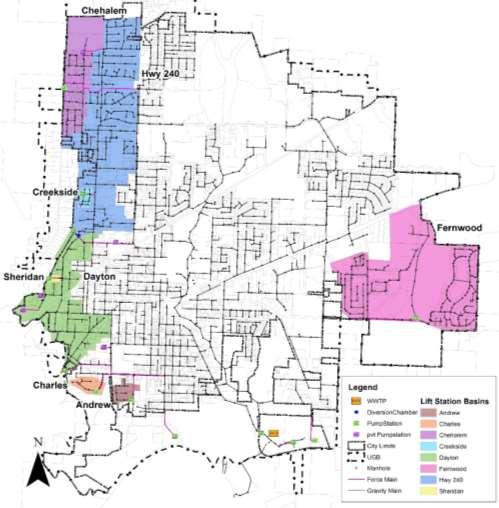
37 Case Study: Newberg, OR 37


38 Determining Newberg s Sources of I/I WWTP influent data Pump run time analysis Narrows down worst basins** Flow monitoring Narrows down worst areas Nighttime monitoring Narrows down worst segments Smoke testing Smoking guns Video inspection Pipe conditions and indicators 38


39 Start with WWTP influent data Seasonal groundwater infiltration patterns Storm response 39


40 Review other Available Data Lift station flow metering and pump run time data 40


41 Target Flow Monitoring Sites Consider best time of year to capture high flow events 41


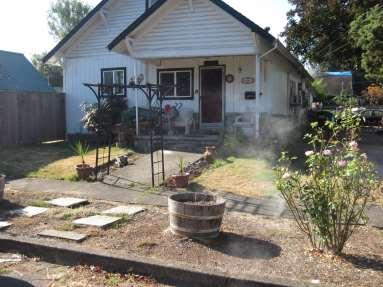
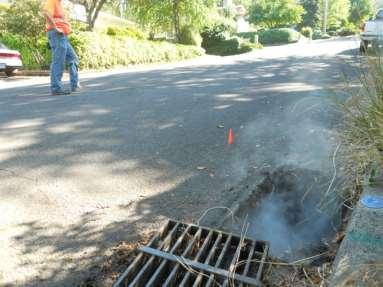
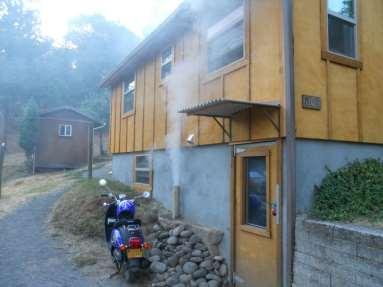
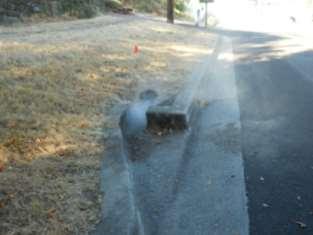
42 Use Smoke Testing to Find Low Hanging Fruit 42


43 Nighttime Flow Monitoring 43
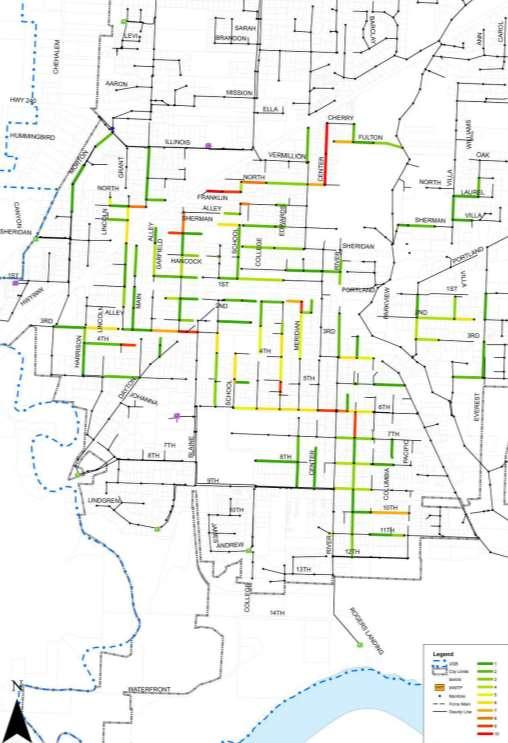


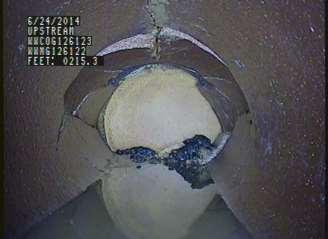
44 CCTV Inspection Use standardized PACP rating criteria 44

")

45 Risk Considerations Risk = likelihood of failure (x) consequence of failure Consequence considerations 45
46 Prioritization Pipe Condition Risk CCTV reports Structural and O&M defects Pipe age and material Night-time monitoring Risk = Consequence of failure x Likelihood of failure Location: service to school, hospital, etc. Separate list of cross connections Separate list for spot repairs Grade 4 or 5 structural defect in PACP report 46
47 Cost / Benefit Cross connections (smoking guns) Rational method: estimated $/gpm removed Estimated cost of rehabilitation Estimated cost to convey and treat wastewater Calculated annual replacement budgets 47

48 Sample Cost / Benefit Analysis Cross Connections Cost to remove GPM benefit Relative cost per GPM comparison 48
49 Sample Cost / Benefit Analysis Cost to convey and treat Fixed and variable costs I/I inconsistent flow, based $ $ 1,009,070 $ 1,198,528 1,201,023 on rainfall and groundwater COST VARIABLE COSTS 012 Actual 2013 Budget 2013 Actual 2014 Budget 2014 Actual Operations (WWTP) 998,541 1,015,456 $ Operating supplies $ 144,580 10% $ 14, ,157 $ 192,306 $ 199,725 $ 246,865 $ 250,357 Utilities $ 282,655 40% $ 113,062 1,489,899 $ 2,053,923 $ 1,941,149 $ 2,044,137 $ 1,964,612 Equipment Repair and Maintenance $ 147,680 25% $ 36, ,889 $ 817,337 Variable $ 598,013 $ intensity 1,017,266 $ 766,426 of Pump Station Maintenance $ 6,531 50% $ 3, ,877 $ 729,408 $ 729,430 $ 1,467,558 $ 1,467,558 rainfall WW Collection 4,126,363 $ 4,808,430 $ 4,477,387 $ 5,974,354 $ 5,649,976 Supplies & Tools $ 15,867 25% $ 3,967 3,389,486 $ 4,079,022 Variable $ 3,747,957 $ duration 4,506,796 $ 4,182,418 of Inflow/Infiltration $ 4, % $ 4,105 Wastewater Rehabilitation $ 58,000 75% $ 43,500 rainfall Wastewater System Replacement $ 6,417 50% $ 3,209 Manhole Rehabilitation $ - 50% $ - gd 1181 gpm Lateral Replacement $ 16,012 70% $ 11,208 gd 3542 gpm Equipment Repair and Maintenance $ 4,510 25% $ 1,128 gd gpm Pipe and Materials $ 20,541 25% $ 5,135 $ 3, $/gpm /gallon/day $ 1, $/gpm $ 239,957 $ $/gpm average daily flow 3.4 mgd average daily flow 2361 gpm cost per gpm removed $ $/gpm O&M Savings $102 / gpm payback in 10 years $ 1, This does not account for potential to offset treatment plant or other capital improvements 49

50 Priority Improvements Prioritize based on multiple criteria CCTV reports Pipe age and material Observed infiltration Consequence of failure Grouped projects Separate lists for cross connections and spot repairs, organized by $/gpm 50
51 Case Study: Newberg, OR Deliverables Prioritized list of rehabilitation projects List of spot repairs major pipe defects List of cross connections Utilization Allows smart planning of rehabilitation projects Can group with other utility work Can budget rehab work annually Update and re-prioritize list as additional data is collected (living document) Prioritized projects if extra money is awarded or surplus budget 51
52 Round 2 / Lessons Learned Newberg Wastewater Master Plan Building on previously completed I/I Study Incorporating collected data from then to now Standardize methods of data collection Collecting new data in different areas Extents of data are important Updating prioritized projects and lists 52

53 Building on Initial Study 53

54 Data Extents 54
55 Keep Records & Standardize Process Highlights trends over time Facilitates ability to track condition changes I/I Flow (MGD) Andrew Charles Chehalem Creekside Dayton Sheridan Fernwood Highway N/A Average
56 What can you do about I/I? Start with what you have Collect data (daily pump run times, CCTV reports, etc.) Educate political leaders & commit to an I/I program appropriate for your community Identify & correct the low hanging fruit (and share your success!) Cost/benefit Prioritized plan Don t be afraid to ask for help to jump start or enhance your program 56

57 QUESTIONS? Peter Olsen, P.E. Emily Flock, E.I. Salem, OR (503) Salem, OR (503)