Factors Affecting the Performance of Brick Veneer Construction
|
|
|
- Blaise Thornton
- 5 years ago
- Views:
Transcription

1 Clemson University TigerPrints All Theses Theses Factors Affecting the Performance of Brick Veneer Construction Jocelyn Dickie Clemson University, Follow this and additional works at: Part of the Civil Engineering Commons Recommended Citation Dickie, Jocelyn, "Factors Affecting the Performance of Brick Veneer Construction" (2008). All Theses This Thesis is brought to you for free and open access by the Theses at TigerPrints. It has been accepted for inclusion in All Theses by an authorized administrator of TigerPrints. For more information, please contact
2 FACTORS AFFECTING THE PEFORMANCE OF BRICK VENEER CONSTRUCTION A Thesis Presented to the Graduate School of Clemson University In Partial Fulfillment of the Requirements for the Degree Master of Science Civil Engineering by Jocelyn Erin Dickie May 2008 Accepted by: Scott Schiff, Committee Chair Patrick Fortney Denis Brosnan
3 ABSTRACT The first topic focused on in this report is the height restriction imposed by the masonry standard for brick veneer on wood frame backing. The current US standard (ACI /ASCE 5-05/TMS Building Code Requirements for Masonry Structures) does not allow brick veneer to extend more than thirty feet above the foundation when supported by wood framing. These prescriptive requirements are compared with those of the Canadian (CSA ) and Australian (AS ) masonry standards. The logic found for this height restriction is based on the vertical differential movement caused by moisture and thermal expansion of the brick veneer and moisture loss shrinkage of the wood framing. Structural analysis found that shrinkage of the wood framing primarily contributed to this vertical movement. Replacing sawn lumber framing with engineered lumber can result in significantly less shrinkage, therefore allowing for an increase in allowable height. In addition, this paper recommends extending the allowable height when the veneer is supported by shelf angles at each floor height or when the framing is stiffened against horizontal movement with appropriate sheathing. The second topic considered is the requirement for horizontal wire joint reinforcement for brick veneer in Seismic Design Categories E and F according to IBC Previous research at other institutions has been investigated. Structural analyses for out-of-plane and in-plane loading demonstrate the theoretical capacity of the brick veneer without wire reinforcement compared to applicable loads. Next, an experimental program was designed to determine if the wire joint reinforcement was detrimental, ii
4 beneficial, or had no effect on the performance of the wall system. First, quasi-static outof-plane tests were performed on specimens with wood frame backing. These first tests compared the performance of the wall system with and without the joint reinforcement, as well as the ductility of the two systems when subjected to out-of-plane loading after the formation of diagonal shear cracking. Second, diagonal shear tests were performed on brick panels. These compared the performance of the brick veneer in diagonal shear with and without the joint reinforcement. Finally, flexural bond strength tests were performed. The variables considered in these tests included: the performance or absence of wire joint reinforcement, the type of mortar, the presence or absence of wall ties, and the type of wall tie used. Previous research conducted at other institutions has indicated that joint reinforcement is either unnecessary or detrimental to the performance of the wall system. The structural analyses performed in this investigation found that the brick veneer theoretically has the capacity to withstand applicable seismic loadings. In the experimental portion of this investigation, the wire did not appear to have any effect on the performance of this wall system. The walls typically failed due to the nail connecting the corrugated sheet metal tie to the wood framing pulling out. This investigation concluded that further research is needed on additional backup and connecting systems. iii
5 DEDICATION I would like to dedicate this report to my parents, without whom I would never have achieved this goal. For their never-ending support, encouragement, friendship, and unfailing confidence in me; you can never fully understand how much that meant to me during these long months. To my father, for sharing his love and immeasurable knowledge of the masonry industry and forever being my shoulder to lean on. To my mother, for sharing her strength, determination, and work ethic and giving me the courage and independence to become the woman I am today. Thank you. iv
6 ACKNOWLEDGEMENTS There are several people I would like to thank for their help and advice during this process. My adviser, Dr. Scott Schiff, and the rest of my advisory committee, Dr. Patrick Fortney and Dr. Denis Brosnan, for making these projects possible. The National Brick Research Center for their support and use of their facilities and equipment and the help of their knowledgeable staff. Warren Rohloff for all his help out at the lab. Finally, Gregg Borchelt, Dr. Mark McGinley, Bill McEwen, and the members of the Wall Systems Committee for their advice, direction, and access to their research. v
7 TABLE OF CONTENTS Page TITLE PAGE... i ABSTRACT... ii DEDICATION... iv ACKNOWLEDGEMENTS...v LIST OF TABLES... ix LIST OF FIGURES... xi LIST OF FIGURES... xi PREFACE... xviii INTRODUCTION...1 History of Brick Veneer...1 Description of Investigations...1 HEIGHT RESTRICTIONS FOR BRICK VENEER WITH WOOD FRAME BACKING...4 Introduction...4 Background and History...4 International Prescriptive Standard Comparison...5 ACI /ASCE 5-05/TMS Building Code Requirements for Masonry Structures...5 CSA Standard S Design of Masonry Structures...6 AS Masonry Structures...8 Summary...9 Structural Analysis...10 Vertical Differential Movement Calculations...10 Additional Considerations...12 Conclusions...13 HORIZONTAL JOINT REINFORCEMENT REQUIREMENTS FOR BRICK VENEER IN SEISMIC DESIGN CATEGORIES E AND F...15 Introduction...15 Background...15 vi
8 Code History...15 Reasoning...16 Problems...17 Previous Research Conducted at Other Institutions...17 MSJC Ballot for Proposed Change to Masonry Standard...20 Structural Analysis Conducted at Clemson University...22 Out-of-Plane Loading...22 In-Plane Loading...24 Structural Testing Conducted at Clemson University...25 Out-of-Plane Loading...25 Experimental Program Experimental Results Discussion of Results Diagonal Shear...30 Experimental Program Experimental Results Discussion of Results Flexural Bond Strength...34 Experimental Program Experimental Results Discussion of Results Conclusions...37 CONCLUSIONS...40 APPENDICES...41 Appendix A Height Restrictions for Brick Veneer with Wood Frame Backing...42 Appendix A.1 Wind Load Calculations...42 Appendix A.2 Australian Design Values...45 Appendix A.3 Differential Movement Calculations...47 Appendix A.4 Engineering Lumber Shrinkage Calculations...49 Appendix B Horizontal Joint Reinforcement Requirements for Brick Veneer in Seismic Design Categories E and F...54 Appendix B.1 Detailed Description of Testing Conducted by McEwan...54 Appendix B.2 Detailed Description of Research Conducted by Turek...60 Appendix B.3 Out-of-Plane Structural Analysis...69 Appendix B.4 In-Plane Structural Analysis...71 Appendix B.5 Specimen Construction Photographs...72 Appendix B.6 Testing Setup...78 vii
9 Appendix B.7 Control Deflections for Loading of Out-of-Plane Walls...83 Appendix B.8 Out-of-Plane Test Results...85 OP-03-A Tested October 17, OP-01-A Tested October 19, OP-02-C Test 1 Tested October 31, OP-02-C Test 2 Tested November 7, OP-02-C Test 3 Tested October 19, OP-02-C Test 4 Tested November 20, OP-02-C Test 5 Tested November 27, OP-02-C Test 6 Tested November 27, OP-04-A Tested November 30, OP-01-D Tested December 3, OP-02-A Tested December 6, OP-01-C Tested April 10, OP-03-B Tested April 17, Appendix B.9 In-Plane Testing Setup Appendix B.10 Diagonal Shear Test Results Appendix B.11 Flexural Bond Strength Testing Setup Appendix B.12 Flexural Bond Strength Test Results LITERATURE CITED viii
10 LIST OF TABLES Table Duty Ratings of Type A Veneer Ties (Vertical Spacing 24 in.)...9 Table 2.2 Basic Code Requirement Summary...9 Table 2.3 Engineered Lumber Framing Vertical Movement...12 Table 3.1 Out-of-Plane Testing Matrix...26 Table 3.2 Flexural Bond Strength Testing Matrix...35 Table B.1 Allowable Flexural Tensile Stresses for Clay and Concrete Masonry...70 Table B.2 Control Deflection Values for Out-of-Plane Loading...83 Table B.3 Maximum Displacement Readings for OP-03-A...93 Table B.4 Maximum Displacement Readings for OP-01-A...96 Table B.5 Maximum Displacement Readings for OP-02-C Test Table B.6 Maximum Displacement Readings for OP-04-A Table B.7 Maximum Displacement Readings for OP-01-D Table B.8 Maximum Displacement Readings for OP-02-A Table B.9 Maximum Displacement Readings for OP-01-C Table B.10 Maximum Displacement Readings for OP-03-B Table B.11 Maximum Loads for Diagonal Shear Tests Table B.12 Flexural Bond Strength Specimen Group 01 Data Table B.13 Flexural Bond Strength Specimen Group 02 Data Table B.14 Flexural Bond Strength Specimen Group 03 Data Table B.15 Flexural Bond Strength Specimen Group 04 Data Table B.16 Flexural Bond Strength Specimen Group 05 Data Table B.17 Flexural Bond Strength Specimen Group 06 Data Table B.18 Flexural Bond Strength Specimen Group 07 Data ix
11 Table B.19 Flexural Bond Strength Specimen Group 08 Data Table B.20 Flexural Bond Strength Specimen Group 09 Data Table B.21 Flexural Bond Strength Specimen Group 10 Data Table B.22 Flexural Bond Strength Specimen Group 11 Data Table B.23 Flexural Bond Strength Specimen Group 12 Data Table B.24 Average Flexural Tensile Strength Table B.25 Average Flexural Tensile Strength without High and Low Values x
12 LIST OF FIGURES Figure 3.1 Typical Nail Pullout Failure...29 Figure 3.2 Failure of OP-01-D...30 Figure 3.3 Diagonal Shear Test Specimen...32 Figure 3.4 Failure of Diagonal Shear Specimen...33 Figure B.1 - Two Piece Adjustable Tie Clipped to Single Wire Joint Reinforcement [McEwen et al., 2001]...54 Figure B.2 - Typical Brick Panel Specimen with Edge Restraint Plates [McEwen et al., 2001]...55 Figure B.3 - Elevation of Testing Setup [McEwen et al., 2001]...56 Figure B.4 - Envelopes of Load-Displacement Curves (1 kn = lb., 2 mm = in.) [McEwen et al., 2001]...57 Figure B.5 - Influence of Joint Reinforcement on the Third Cycle Tension Envelopes for Low Surcharge (1 kn = lb., 1 mm = in.) [McEwen et al., 2001]...57 Figure B.6 - Influence of Joint Reinforcement on the Third Cycle Tension Envelopes for High Surcharge (1 kn = lb., 1 mm = in.) [McEwen et al., 2001]...58 Figure B.7 - Mortar Split in Failed Specimen [McEwen et al., 2001]...58 Figure B.8 - Joint Reinforcing System [Turek et al., 2002]...61 Figure B.9 - Front View of Wall Assembly [Turek et al., 2002]...62 Figure B.10 - Instrumentation Setup [Turek et al., 2002]...62 Figure B.11 - Tie Pounding in Specimen 2 [Turek et al., 2002]...64 Figure B.12 - Failure of Specimen 1 [Turek et al., 2002]...64 Figure B.13 - Failure of Top East Corner of Specimen 4 [Turek et al., 2002]...65 Figure B.14 - Failure of Specimen 4 [Turek et al., 2002]...66 Figure B.15 - Failure of Specimen 3 [Turek et al., 2002]...66 xi
13 Figure B.16 Construction of 4 ft. by 8 ft. Wall Specimens (1)...72 Figure B.17 Construction of 4 ft. by 8 ft. Wall Specimens (2)...72 Figure B.18 Construction of 4 ft. by 8 ft. Wall Specimens (3)...73 Figure B.19 Construction of 4 ft. by 8 ft. Wall Specimens (4)...73 Figure B.20 Construction of 4 ft. by 8 ft. Wall Specimens (5)...74 Figure B.21 Construction of 4 ft. by 8 ft. Wall Specimens (6)...74 Figure B.22 Construction of 4 ft. by 8 ft. Wall Specimens (7)...75 Figure B.23 Formation of Diagonal Crack in 4 ft. by 8 ft. Wall Specimens...75 Figure B.24 Construction of Shear Panel...76 Figure B.25 Diagram of Wiffle Tree...78 Figure B.26 LVDT Locations...79 Figure B.27 Testing Setup...80 Figure B.28 Screwdrive Actuator...81 Figure B.29 Connection of Actuator to Wiffle Tree...81 Figure B.30 Diagram of Test Specimen Showing Wiffle Tree Connection and Diagonal Crack Locations...82 Figure B.31 Control Deflections for Out-of-Plane Loading...84 Figure B.32 OP-03-A Displacement vs. Time Step for Brick Face...85 Figure B.33 OP-03-A Displacement vs. Time Step for Sheathing Face...85 Figure B.34 OP-03-A Differential Displacement vs. Time Step...86 Figure B.35 OP-03-A Load vs. Time Step...86 Figure B.36 OP-03-A LVDT 1 Load vs. Displacement...87 Figure B.37 OP-03-A LVDT 2 Load vs. Displacement...87 Figure B.38 OP-03-A LVDT 3 Load vs. Displacement...88 xii
14 Figure B.39 OP-03-A LVDT 4 Load vs. Displacement...88 Figure B.40 OP-03-A LVDT 5 Load vs. Displacement...89 Figure B.41 OP-03-A LVDT 6 Load vs. Displacement...89 Figure B.42 OP-03-A LVDT 7 Load vs. Displacement...90 Figure B.43 OP-03-A LVDT 8 Load vs. Displacement...90 Figure B.44 OP-03-A Load vs. Differential Displacement at Top of Wall...91 Figure B.45 OP-03-A Load vs. Differential Displacement at ¾ Height of Wall...91 Figure B.46 OP-03-A Load vs. Differential Displacement at Mid Height of Wall...92 Figure B.47 OP-03-A Load vs. Differential Displacement at ¼ Height of Wall...92 Figure B.48 OP-01-A Load vs. Differential Displacement at Top of Wall...94 Figure B.49 OP-01-A Load vs. Differential Displacement at ¾ Height of Wall...94 Figure B.50 OP-01-A Load vs. Differential Displacement at Mid Height of Wall...95 Figure B.51 OP-01-A Load vs. Differential Displacement at ¼ Height of Wall...95 Figure B.52 OP-02-C Test 1 Load vs. Differential Displacement at Top of Wall...97 Figure B.53 OP-02-C Test 1 Load vs. Differential Displacement at ¾ Height of Wall...97 Figure B.54 OP-02-C Test 1 Load vs. Differential Displacement at Mid Height of Wall...98 Figure B.55 OP-02-C Test 1 Load vs. Differential Displacement at ¼ Height of Wall...98 Figure B.56 OP-02-C Test 2 Load vs. Differential Displacement at Top of Wall...99 Figure B.57 OP-02-C Test 2 Load vs. Differential Displacement at ¾ Height of Wall...99 xiii
15 Figure B.58 OP-02-C Test 2 Load vs. Differential Displacement at Mid Height of Wall Figure B.59 OP-02-C Test 2 Load vs. Differential Displacement at ¼ Height of Wall Figure B.60 OP-02-C Test 3 Load vs. Differential Displacement at Top of Wall Figure B.61 OP-02-C Test 3 Load vs. Differential Displacement at ¾ Height of Wall Figure B.62 Op-02-C Test 3 Load vs. Differential Displacement at Mid Height of Wall Figure B.63 OP-02-C Test 3 Load vs. Differential Displacement at ¼ Height of Wall Figure B.64 OP-02-C Test 4 Load vs. Differential Displacement at Top of Wall Figure B.65 OP-02-C Test 4 Load vs. Differential Displacement at ¾ Height of Wall Figure B.66 OP-02-C Test 4 Load vs. Differential Displacement at Mid Height of Wall Figure B.67 OP-02-C Test 4 Load vs. Differential Displacement at ¼ Height of Wall Figure B.68 OP-02-C Test 5 Load vs. Differential Displacement at Top of Wall Figure B.69 OP-02-C Test 5 Load vs. Differential Displacement at ¾ Height of Wall Figure B.70 OP-02-C Test 5 Load vs. Differential Displacement at Mid Height of Wall Figure B.71 OP-02-C Test 5 Load vs. Differential Displacement at ¼ Height of Wall Figure B.72 OP-02-C Test 6 Load vs. Differential Displacement at Top of Wall xiv
16 Figure B.73 OP-02-C Test 6 Load vs. Differential Displacement at ¾ Height of Wall Figure B.74 OP-02-C Test 6 Load vs. Differential Displacement at Mid Height of Wall Figure B.75 OP-02-C Test 6 Load vs. Differential Displacement at ¼ Height of Wall Figure B.76 OP-04-A Load vs. Differential Displacement at Top of Wall Figure B.77 OP-04-A Load vs. Differential Displacement at ¾ Height of Wall Figure B.78 OP-04-A Load vs. Differential Displacement at Mid Height of Wall Figure B.79 OP-04-A Load vs. Differential Displacement at ¼ Height of Wall Figure B.80 OP-01-D Load vs. Differential Displacement at Top of Wall Figure B.81 OP-01-D Load vs. Differential Displacement at ¾ Height of Wall Figure B.82 OP-01-D Load vs. Differential Displacement at Mid Height of Wall Figure B.83 OP-01-D Load vs. Differential Displacement at ¼ Height of Wall Figure B.84 OP-02-A Load vs. Differential Displacement at Top of Wall Figure B.85 OP-02-A Load vs. Differential Displacement at ¾ Height of Wall Figure B.86 OP-02-A Load vs. Differential Displacement at Mid Height of Wall Figure B.87 OP-02-A Load vs. Differential Displacement at ¼ Height of Wall Figure B.88 OP-01-C Load vs. Differential Displacement at Top of Wall Figure B.89 OP-01-C Load vs. Differential Displacement at ¾ Height of Wall Figure B.90 OP-01-C Load vs. Differential Displacement at Mid Height of Wall Figure B.91 OP-01-C Load vs. Differential Displacement at ¼ Height of Wall Figure B.92 OP-03-B Load vs. Differential Displacement at Top of Wall xv
17 Figure B.93 OP-03-B Load vs. Differential Displacement at ¾ Height of Wall Figure B.94 OP-03-B Load vs. Differential Displacement at Mid Height of Wall Figure B.95 OP-03-B Load vs. Differential Displacement at ¼ Height of Wall Figure B.96 Diagram of Diagonal Shear Test Specimen Figure B.97 Photograph of Diagonal Shear Test Specimen Figure B.98 DS-01-A Load vs. Time Figure B.99 DS-01-B Load vs. Time Figure B.100 DS-01-C Load vs. Time Figure B.101 DS-01-D Load vs. Time Figure B.102 DS-02-A Load vs. Time Figure B.103 DS-02-B Load vs. Time Figure B.104 DS-02-C Load vs. Time Figure B.105 DS-02-D Load vs. Time Figure B.106 Specimen from Group FBS Figure B.107 Specimen from Group FBS Figure B.108 Specimen from Group FBS Figure B.109 Specimen from Group FBS Figure B ga Corrugated Metal Wall Tie Figure B ga Corrugated Metal Wall Tie with Clip Figure B ga Corrugated Metal Wall Tie with Joint Reinforcement Attached Figure B.113 Triangular Wire Wall Tie Figure B.114 Square Wire Wall Tie Figure B.115 Square Wire Wall Tie with Joint Reinforcement Attached xvi
18 Figure B.116 Bond Wrench Testing Apparatus Diagram Figure B.117 Bond Wrench Testing Apparatus Figure B.118 Average Net Area Flexural Tensile Strength Figure B.119 Average Net Area Flexural Tensile Strength Type N vs. Type S Mortar Figure B.120 Average Net Area Flexural Tensile Strength with vs. without Joint Reinforcement Figure B.121 Average Net Area Flexural Tensile Strength Wall Tie Comparison xvii
19 PREFACE This thesis is prepared using an alternative format and therefore differs from a traditional thesis. It is a compilation of two papers related to the performance of brick veneer construction. The first paper is titled Height Restrictions for Brick Veneer with Wood Frame Backing, and reports on investigations for increasing the height limitations imposed by the current masonry standard. The second paper is titled Horizontal Joint Reinforcement Requirements for Brick Veneer in Seismic Design Categories E and F, and reports on experimental research and structural analyses of brick veneer construction with and without wire joint reinforcement. The reader will find an introduction and a conclusion related to both papers. Data and more detailed information for the first paper can be found in Appendix A, while data and more detailed information for the second paper can be found in Appendix B. xviii
20 INTRODUCTION Brick veneer has been a popular method of construction for several years; however, little research has been performed on the system. Several of the prescriptive requirements in the code have been grandfathered in from previous codes. The purpose of this research was to look at two such requirements affecting the masonry industry with the end result being to improve them in addition to providing a better understanding of the provisions. History of Brick Veneer The earliest record of a true anchored brick veneer dates back to This record is similar to modern brick veneer construction. Drawings show that it includes air space between the veneer and backing, steel strap ties, diagonal wood sheathing, and drainage for moisture penetrating the veneer. It also includes a recommendation to use wood as dry as possible, which suggests the concern for shrinkage and differential movement. Although this type of construction has existed for many years, little testing was performed, and its design evolved in an empirical manner. The first testing of veneer with wood studs and corrugated ties was not published until 1966 [Borchelt, 1988]. Description of Investigations The first investigation looks at the height restriction imposed by the current masonry standard for brick veneer on wood frame backing. The current US standard (ACI /ASCE 5-05/TMS Building Code Requirements for Masonry Structures) has prescriptive requirements that do not allow brick veneer to extend more than thirty feet above the foundation when supported by wood construction. These 1
21 prescriptive requirements are compared with those of the Canadian (CSA S ) and Australian (AS ) masonry standards. A literature review indicated one reason in particular for this restriction. The main portion of this investigation was an analytical analysis of the vertical differential movement caused by the moisture and thermal expansion of the brick veneer and shrinkage of the wood frame due to moisture loss. Additional considerations include horizontal movement due to drift and the relative stiffness of the veneer and backup system. Based on these investigations, recommendations for increasing the height limitation are provided. The second investigation looked at the requirement for horizontal wire joint reinforcement for brick veneer in Seismic Design Categories (SDC) E and F. Research and testing performed by the University of British Columbia and the New Zealand Pottery and Ceramics Research Association were reviewed. Structural analyses for outof-plane and in-plane loading demonstrate the theoretical capacity of the brick veneer without wire reinforcement compared to applicable loads. Finally, an experimental program was designed to determine if the wire joint reinforcement was detrimental, beneficial, or had no effect on the performance of the wall system. The first series of tests included quasi-static out-of-plane tests performed on specimens with wood frame backing. These compared the performance of the wall system with and without the joint reinforcement, as well as the ductility of the two systems in out-of-plane loading after diagonal shear cracking. The second series of tests included diagonal shear tests performed on brick panels. These compared the performance of the brick veneer in diagonal shear with and without the joint reinforcement. Finally, flexural bond strength 2
22 tests were performed. The variables considered in these tests included: the presence or absence of wire joint reinforcement, the type of mortar, the presence or absence of a wall tie, and the type of wall tie used. Based on these investigations, recommendations are provided regarding the required presence of wire joint reinforcement. 3
23 HEIGHT RESTRICTIONS FOR BRICK VENEER WITH WOOD FRAME BACKING Introduction The purpose of this research is to investigate the height restrictions on brick veneer walls with wood frame backing imposed by ACI /ASCE 5-05/TMS Building Code Requirements for Masonry Structures [Masonry, 2005]. The prescriptive requirements and restrictions of ACI 530 have been analyzed and compared with those of the CSA Standard S Design of Masonry Structures (Canada) [Canadian, 2004] and AS Masonry Structures (Australia) [Standards, 2001]. Several possible explanations for this height restriction exist and have been investigated. Based on these investigations, recommendations are provided for exceeding this height limitation. Background and History The current version of ACI 530 has a maximum height limit of 30 ft. at the plate (38 ft. at the gable) above the lower support when veneer is laterally supported by wood. A literature review has shown this height limit was established, at least in part, to limit differential deflection or settlement between the less dimensionally stable wood construction and the stiffer veneer system. As the Brick Industry Association s Technical Notes on Brick Construction states, this limit is imposed because of the differences in the relative stiffness of the brick veneer and the wood frame. Furthermore, differences in movement resulting from wood shrinkage and brick expansion are controlled by these limits [Technical, 2002]. This height limitation has been in place since Until that time, the Building Officials and Code Administrators (BOCA) Code limited the height of veneers to 25 ft. above supports [Dalrymple, 2005]. 4
24 International Prescriptive Standard Comparison ACI /ASCE 5-05/TMS Building Code Requirements for Masonry Structures The US masonry standard has prescriptive requirements to follow for general design of masonry structures. The prescriptive requirements for anchored brick veneer do have their limitations, however. They are allowable for design wind speeds less than or equal to 110 mph, which produces a design wind pressure of 18.5 psf (see Appendix A.1 for pressure calculations) for a three-second gust. More conservative anchor requirements allow prescriptive design to be used for wind speeds between 110 mph and 130 mph, producing design wind pressures of 18.5 psf and 25.8 psf (see Appendix A.1), respectively, for structures less than or equal to 60 ft. in height. These calculations assume a mean roof height of 34 ft. and a story height of 10 ft. The prescriptive design has additional requirements for structures in seismic areas. For veneer in SDC C, the sides and top of the veneer must be isolated from the structure so that the lateral seismic forces resisted by the structure are not imparted to the veneer. For SDC D, the restrictions for SDC C apply. In addition, the maximum wall area supported by each anchor must be reduced to 75 percent of that required in SDC C. The maximum anchor spacings are unchanged. For SDC E and F, the restrictions of SDC D apply. In addition, the weight of the veneer for each story must be supported independent of all other stories [Masonry, 2005]. Several restrictions also exist for vertical support of the veneer. The weight of the veneer must be vertically supported on noncombustible structural supports. It is permitted to be supported on preservative-treated wood foundations for heights less than 5
25 or equal to 18 ft. Veneer supported by wood backing, however, is restricted to a height of 30 ft. at the top plate of the wall and 38 ft. at the ridge of the gable. For cold-formed steel framing backing with heights exceeding the restrictions for wood backing, veneer must be supported by noncombustible construction for each story above the aforementioned height limits. There are no height restrictions for veneers backed by masonry or concrete [Masonry, 2005]. For adjustable two-piece, wire size W1.7, and 22-gauge corrugated sheet metal anchors, at least one anchor must be provided for every 2.67 ft 2 of wall area. For other types of anchors, one anchor must be provided for every 3.5 ft 2 of wall area. These wall areas must be reduced for higher seismic design categories as previously described. The maximum horizontal and vertical spacings for anchors are 32 in. and 18 in., respectively. Additional anchors are required around openings greater than 16 in. in either direction. Anchors must be spaced a maximum of 3 ft. o.c. around the perimeter of the opening and within 12 in. of the opening. It should be noted that the anchor spacing is independent of the backing type. Finally, the required mortar bed joint must be twice the thickness of the embedded anchor [Masonry, 2005]. CSA Standard S Design of Masonry Structures The Canadian masonry standard was next examined to compare with that of the US. This prescriptive design cannot be used in areas where the 1 in 50 years hourly wind pressure exceeds 11.5 psf. It also cannot be used where the seismic hazard index, I E F A S A (0.2) is greater than or equal to These variables are similar to US standards. I E is an importance factor based on building use, F A is a modification factor based on soil 6
26 type and seismic area, and S A is the damped spectral response based on five percent damping. In addition, prescriptive design shall not be used when applied loads other than wind or seismic cause a lateral force on a masonry structure or where the resultant vertical force of a gravity load on a masonry element falls outside the central third of the actual thickness of the masonry. The structural backing supporting the veneer must have a flexural stiffness, EI, less than 2.5 times the uncracked stiffness of the veneer [Canadian, 2004]. According to CSA, masonry veneer may be supported by wood or shelf angles supported by wood for buildings less than four stories in height. A story height is considered to be 12 ft.; therefore brick veneer is permitted to be supported by wood construction for heights up to 48 ft. Prescriptive design shall not be used for exterior walls higher than 65 ft. above grade. Lateral supports must be provided at either vertical or horizontal intervals and spaced such that the slenderness ratio is not greater than 20. Veneer with a total height exceeding 36 ft. above the top of the foundation wall must bear on noncombustible bearing supports at each floor level, but not more than 12 ft. vertically, starting at the second level. Vertical movement of suspended veneer supports must be provided without transfer of any loading to the veneer located below the support [Canadian, 2004]. Ties and joint reinforcement require maximum vertical and horizontal spacings of 32 in. and 24 in., respectively. In walls with openings, ties can be spaced a maximum of 24 in. apart and must be within 12 in. of an opening s edge. Ties are permitted to be staggered where stud spacing is not greater than 16 in. Finally, they are required within 7
27 12 in. of the top of the veneer panel and within 16 in. of the support at the bottom where the bearing does not provide adequate lateral support [Canadian, 2004]. AS Masonry Structures Finally, the Australian masonry standard was examined for comparison with the US standard. Prescriptive design may not be used for a wythe thickness less than 3 ½ in. The top of all walls must be supported by a roof or floor structure acting as a diaphragm. A gap must be left between the wood frame and the top of the veneer wall, including window sills, etc., to allow for settlement of the timber framing caused by timber shrinkage. The height of a wall from the ground level to the eaves must not exceed 20 ft., and the height to the highest point of the roof must not exceed 28 ft. Furthermore, the height of each story must not exceed 10 ft. Note that these limitations are applicable to all backing materials. The width of a building for prescriptive design must not exceed 52 ft., while the length cannot exceed 5 times the width. The pitch of the roof cannot exceed 35. Finally, panels of unreinforced masonry must have at least one vertical support [Standards, 2001]. Walls ties shall be selected and spaced according to Table 2.1, shown below. Wall tie spacings for wind category N1 are suitable for earthquake design category H1, and those for higher wind categories are suitable for earthquake design categories H2 and H3. The maximum vertical spacing allowed is 24 in., and ties must be provided within 12 in. of the top of the wall. The number of ties must be doubled at an intersecting wall [Standards, 2001]. Design values for AS are presented in Appendix A.2. 8
28 Table Duty Ratings of Type A Veneer Ties (Vertical Spacing 24 in.) Wall Height Wind Classification 8 ft. 10 ft. Horizontal Spacing 18 in. 24 in. 18 in. 24 in. N1 Light Duty Light Duty Light Duty Light Duty N2 Light Duty Light Duty Light Duty Medium Duty N3 Light Duty Medium Duty Medium Duty Medium Duty N4 Medium Duty Medium Duty Medium Duty Heavy Duty C1 Medium Duty Medium Duty Medium Duty Medium Duty C2 Medium Duty Heavy Duty Heavy Duty Heavy Duty N5, C3 Heavy Duty Heavy Duty Heavy Duty Heavy Duty N6, C4 Heavy Duty Heavy Duty Heavy Duty Heavy Duty Summary The following table provides a summary of the pertinent requirements from each code: Table 2.2 Basic Code Requirement Summary Requirement ACI CSA S AS Maximum Wall Height 30 ft. 48 ft. 20 ft. Maximum Horizontal Tie Spacing 32 in. 24 in. 24 in. Maximum Vertical Tie Spacing 18 in. 32 in. 24 in. The Australian code is the most restrictive in limiting the height of veneer walls. The maximum allowed is 20 ft., with no provisions for building above that height regardless of the backing material. The US code allows veneer to be built to a height of 30 ft. with wood backing. Like the Australian code, there is no provision for going above this limitation. The Canadian code allows prescriptive design for veneer walls with wood frame backing to a height of 48 ft. as long as the backup system has stiffness no more than 2.5 the stiffness of the uncracked veneer. For walls which extend beyond 36 ft., they 9
29 must bear on noncombustible supports at each floor level, starting at the second level. The tie spacings are fairly comparable between the three codes, as Table 2.2 shows. Structural Analysis Vertical Differential Movement Calculations Brick veneer with wood frame backing is becoming a more popular construction method for commercial offices and multi-family buildings with three to four stories. As a result, there has been an increase in the observed problems due to vertical differential movement between the two materials. Wood will shrink as it decreases from its supplied moisture content to its equilibrium moisture content [Dalrymple, 2005]. Fired clay products, however, will expand when they come into contact with moisture, and they will not return to their original size upon drying. Continued expansion due to moisture has been reported for up to 7 ½ years. In addition, fired clay products experience expansion and contraction due to temperature changes in the surrounding environment [Masonry, 2005]. Calculations in Appendix A.3 show the expected differential movement for a three-story building. They represent a maximum theoretical differential movement caused by expansion of the brick due to moisture and temperature and shrinkage of the wood framing due to moisture loss. The calculations assume a temperature differential of 100ºF from winter to summer for the brick veneer. The wood framing is expected to go from a typical supplied moisture content of 19 percent to an equilibrium moisture content of 10 percent. The building is assumed to be three stories with double top plates and 12 in. (nominal) floor joists. The primary source of differential movement is the shrinkage of the wood framing, which is about five times that caused by the expansion of the brick 10
30 veneer. As these calculations show, the total differential movement can be up to 1.7 inches at the top of the structure with Douglas fir-larch framing. This differential movement can cause several problems. Window systems are typically structurally attached to the wood framing of a building so that the windows travel with the frame as it shrinks. Above the windows, however, the brick veneer is typically attached to a steel lintel, which travels with the veneer wythe as it expands. This can result in tearing of the sealant joints at window perimeters or crushing and bowing out of window frame components. In addition, the differential movement can affect the brick wythe s structural stability when the brick veneer ties fail due to the amount of movement [Dalrymple, 2005]. There are construction methods in place today that could minimize this differential shrinkage. One of these is balloon construction, which consists of placing wood studs in end grain bearing so that edge grain bearing is avoided entirely. This type of construction is not common today because it is difficult to find sawn lumber that is long enough. It would be possible, however, to use engineered 2x4 s for balloon construction, as they can easily come in longer lengths. Slotted ties or connections that allow differential movement may also be used [Schneider et al., 1994]. One of the primary concerns addressed in this paper is the use of engineered lumber in order to reduce the amount of differential movement. Engineered lumber does not shrink as much due to moisture loss, resulting in smaller differential movements as shown in Appendix A.4. The percentage of swell was obtained from private communication with ilevel by Weyerhaeuser. These calculations follow the same deisgn 11
31 assumptions used for the sawn lumber calculations. A summary of the engineered lumber calculations is shown below in Table 2.3. Based on these calculations, for a three-story building constructed from Laminated Veneer Lumber (LVL) Spruce-Pine I- Joists, Parallel Strand Lumber (PSL) Spruce-Pine plates, and Laminated Strand Lumber (LSL) studs, the total vertical movement of the wood framing would be 0.27 in. This results in a total vertical differential movement of 0.52 in. As these calculations show, even the maximum assumed differential movement using engineered lumber can be up to three times smaller than that expected when using sawn lumber. Furthermore, if only the joists are replaced with engineered I-joists, the total differential movement can be reduced by 42 percent. A 50 ft. tall wall using engineered I-joists and sawn plates and studs would have smaller total differential movement than a 30 ft. wall with framing constructed entirely of sawn lumber. Table 2.3 Engineered Lumber Framing Vertical Movement Framing Member Percentage Swell (e ME ) Vertical Movement LVL Douglas-Fir I-Joist 0.20% (depth) in. LVL Spruce-Pine I-Joist 0.25% (depth) in. LVL Douglas-Fir Plates 1.00% (width) in. LVL Spruce-Pine Plates 1.50% (width) in. PSL Douglas-Fir Plates 1.00% (width) in. PSL Spruce-Pine Plates 2.00% (width) in. LVL Low Density Hardwood Plates 2.00% (width) in. Additional Considerations Another possible reason for the height restriction has to do with seismic concerns. It could be related to the horizontal differential movement between the brick veneer and the wood framing. If this is a concern, the wood framing should be stiffened with additional sheathing in order to reduce the amount of movement during a seismic event 12
32 and therefore allowing for an increase in the wall height. In the design process, the wood framing will already need to be designed for a maximum amount of drift. In this situation, the maximum veneer height should be allowed to increase as long as the maximum allowable horizontal drift due to seismic loading is not exceeded. Another concern with seismic loading is the difference in the lateral stiffness of the veneer and the wood framing. Although steel is a more flexible material than the brick veneer, the masonry standard permits it to extend beyond the maximum allowed height as long as it is supported at each floor starting at the second floor. A similar allowance for wood frame backing should be included in the standard. The Design Guide for Anchored Brick Veneer over Steel Studs also recommends that crack widths of the veneer should be limited to between 0.02 and 0.04 inches by limiting steel stud deflections to L/360 for service loads [KPFF, 2000]. To get a small increase in allowable height, a standard mean roof height could be maintained. The code currently restricts the wall top plate elevation to 30 ft. and the gable ridge elevation to 38 ft., giving a mean design roof height of 34 ft. As design wind calculations are based on mean roof height and not height at the top plate, the specification should be reworded so that a mean roof height of 34 ft. is maintained for brick veneer supported by wood construction. Conclusions Current masonry standards prohibit extending brick veneer supported by wood construction more than thirty feet above the foundation. While there may be additional reasons for this restriction, the most clearly documented is the vertical differential 13
33 movement between the brick veneer and wood framing. This differential movement is due to expansion of the brick veneer from thermal and moisture changes and shrinkage of the wood framing from moisture loss. The majority of the movement is due to the shrinkage of the wood framing. This problem can be minimized by using engineered lumber as a replacement for sawn lumber for all or part of the framing system. Engineered lumber has a much smaller coefficient for moisture expansion, resulting in smaller movements. Masonry standards should reflect this advance in building technology with provisions allowing for a greater allowable height when engineered lumber is used as a replacement for or in conjunction with typical sawn lumber framing. Where drift due to lateral seismic or wind loads is a concern, provisions for a greater allowable height should be included when a maximum allowable drift is maintained. This allowable drift can easily be maintained by stiffening the framing system with properly anchored sheathing. Veneer should be supported at each floor level exceeding current height limitations. Finally, the standard should restrict the mean roof height of the system rather than the height at the plate and at the gables. This is the height used for structural calculations, and should therefore be the determining factor for maximum allowable height. 14
34 HORIZONTAL JOINT REINFORCEMENT REQUIREMENTS FOR BRICK VENEER IN SEISMIC DESIGN CATEGORIES E AND F Introduction The Masonry Standards Joint Committee (MSJC) Building Code Requirements for Masonry Structures currently requires a W1.7 (9 ga) continuous, single-wire joint reinforcement at a maximum spacing of 18 in. o.c. vertically be provided in Seismic Design Categories (SDC) E and F [Masonry, 2005]. The purpose of this paper is to investigate the justification for this requirement and to determine its necessity. Previous research and testing have been studied, and in-plane and out-of-plane structural analyses have been completed. Furthermore, an experimental program was designed to investigate the out-of-plane performance of the wall system and the diagonal shear capacity and the flexural bond strength of the brick veneer. Background Code History Provisions for the design of masonry veneers have been in the Uniform Building Code (UBC) since Veneer has never been considered a part of the structural system, and it has always been assumed the backing system will carry any load imparted on the veneer by transfer through the veneer anchors. Therefore, the only force the veneer must resist is its own self weight. Based on this assumption, the 1943 version of the UBC required veneer anchors to resist four times the weight of veneer; this was later reduced to two times the self-weight in the 1952 edition [McGinley et al., 2002]. In 1982, UBC introduced the requirement of horizontal joint reinforcement for seismic zones 3 and 4. In 1991, the additional requirement that joint reinforcement be 15
35 mechanically attached to the ties was introduced [McGinely et al., 2002]. MSJC first introduced requirements for brick veneer in This included requiring horizontal joint reinforcement for SDC D and up, with mechanical attachment required for SDC E [Masonry, 2006]. In the 2000 version of the International Residential Code (IRC), SDC D was broken into two categories, D 1 and D 2. In these categories, ties must be mechanically connected to a continuous 9-gauge (W1.7) wire joint reinforcement. The mechanical attachment portion of this requirement was removed in the 2002 amendments to the IRC in order to be consistent with MSJC requirements [McGinley et al., 2002]. Reasoning There has been no research, testing, or technical justification found supporting the decision to add the requirement of horizontal joint reinforcement for brick veneer in seismic design categories E and F to the masonry standard. Masonry materials that are prone to initial shrinkage, such as concrete masonry, require horizontal joint reinforcement for stability against this movement. Clay brick does not exhibit this behavior, so joint reinforcement is not used for that particular purpose [Technical, 1978]. The MSJC code commentary holds a brief discussion on the requirement which seems to indicate that horizontal joint reinforcement provides ductility and post-cracking strength for the veneer [McGinley et al., 2002]. According to the Brick Industry Association, horizontal joint reinforcement may prove beneficial for added transverse strength or for increasing the space between expansion joints [Technical, 1978]. Their technical notes also state that horizontal joint reinforcement should be used to add integrity to veneer in 16
36 locations with intermediate or higher seismic activity or when units are laid in stack bond [Technical, 1991]. They do not, however, give their reasoning for this statement. According to research performed at the University of British Columbia, horizontal joint reinforcement appears to have been added as a requirement to help improve the embedment capacity of brick ties and to improve the integrity of the veneer assembly [McEwen et al., 2001]. An MSJC ballot for a proposed change to the masonry standard says that it appears that the basic logic of reinforcement for otherwise unreinforced masonry in high seismic areas is a good idea was applied to veneer and/or it ll somehow improve attachment [Masonry, 2006]. Problems This requirement carries several implications with it. One of the most notable is the cost implication in both residential and commercial sectors. According to private communication with masonry contractors, the addition of wire can increase the cost of a wall by about $0.75/ft 2. This represents approximately 3 to 4 percent of the total wall cost. This estimate includes the additional $0.20/ft. of wall material cost, as well as an increase in labor costs due to the additional time and care to install the wire. In addition, corrosion of reinforcement lacking sufficient cover can cause spalling of mortar joints [McGinley et al., 2002]. Finally, while the wire may have benefits regarding the ductility of the wall, it may also act as a bond break, causing out-of-plane failure [Masonry, 2006]. Previous Research Conducted at Other Institutions The University of British Columbia previously investigated the requirement for horizontal wire joint reinforcement in brick veneer. The basis of their research was to 17
37 determine if Canada should include a similar requirement in the masonry standard CSA S One paper investigated the theory that horizontal joint reinforcement will improve the embedment capacity of brick ties. This paper concluded that there was no improvement in embedment capacity when using joint reinforcement not mechanically attached to the tie. The testing showed that in specimens with a low applied surcharge, representing the top of a wall where the highest brick tie load exists, the addition of joint reinforcement reduced the peak embedment strength. For specimens with a high applied surcharge the joint reinforcement improved the peak embedment strength. However, the load vs. displacement graphs show that specimens with joint reinforcement demonstrate an improvement in strength and stiffness degradation [McEwen et al., 2001]. A detailed description of this testing and its results can be found in Appendix B.1. The University of British Columbia further investigated the necessity of horizontal joint reinforcement by performing shake table testing. The purpose of this testing was to observe the overall performance of large-scale veneer walls with and without wire joint reinforcement when subjected to out-of-plane shake table loading. Only one type of each specimen was tested, so it was difficult to be conclusive about the observations of this testing. The specimens did, however, fail at accelerations higher than design levels. In this series of tests, the specimens with joint reinforcement failed before those without wire joint reinforcement. It appeared that the joint reinforcement initiated failure by providing a location for crack propagation to begin. The authors noted that the joint reinforcement did not improve ductility after cracking as is its intention [Turek et al., 2002]. A detailed description of this testing is available in Appendix B.2. 18
38 An article in the Bulletin of New Zealand Society for Earthquake Engineering evaluated dynamic testing of brick veneer walls on wood backing. Based on preliminary testing, it was assumed that collapse would occur because of the tie pulling out of the stud or the stud pulling out of the wood plate. Precautions were taken to avoid this type of failure. Several specimens included preformed diagonal cracks. The specimens with preformed diagonal cracks performed similarly to those without cracks. This suggests that joint reinforcement may not improve the performance of veneers in seismic events. Typical failures for this system are due to the tie or the stud, which are unaffected by the presence of joint reinforcement. It has been assumed that horizontal joint reinforcement would help hold the veneer together if there were diagonal cracks due to in-plane loading. The results of this test, however, show the performance of the walls was similar with and without the diagonal cracks, so this may not be the case [McGinley et al., 2002]. Testing on the in-plane performance of brick veneer on wood frames has also been performed. The veneer in this experiment did not include horizontal wire joint reinforcement, and the walls were tested up to +/ in. of displacement. During the tests, the brickwork remained in tact, and the veneer had to be removed course by course at the end of each test. Some separation of the veneer from the concrete base did occur, and the veneer rocked at the higher displacement levels. Researchers also observed differential movement between the veneer and the wood backing [McGinley et al., 2002]. North Carolina A&T performed testing on the 22-gauge corrugated metal ties typically used in anchored veneer construction. They found the ties resisted over 200 lb. of in-plane shear in typical residential wood stud with brick veneer construction. They 19
39 also found the ties behaved in a ductile manner. Their study concluded that if the veneer were to fail in shear, there is enough redundancy in the system that the shear load would be transferred to the backup system through the ties [McGinley et al., 2002]. MSJC Ballot for Proposed Change to Masonry Standard MSJC held a ballot to change the requirement for horizontal joint reinforcement in SDC E and F. The proposed change was to require continuous W1.7 (9 ga) wire joint reinforcement mechanically attached to the tie only when corrugated sheet-metal anchors or sheet-metal anchors are used as opposed to requiring it for all types of anchors. This ballot focused mainly on the research performed at the University of British Columbia [Turek et al., 2002] and the research performed for SDC D [McGinley et al., 2002]. The ballot argued that the technical information available showed that bed joint reinforcement in masonry veneer is not required in SDC D based on the load demand. In addition, bed joint reinforcement has a detrimental effect on the performance of brick veneer system during a seismic event when subjected to out-of-plane loading with ties spaced as they are currently required by MSJC. The joint reinforcement acts as a bond breaker, initiating failure. There was one negative expressed on the ballot [Masonry, 2006]. Several concerns were raised with the negative to the ballot item. One was that the rationale and testing performed at the University of British Columbia focused only on out-of-plane loading. During a seismic event, in-plane loading will statistically be prominent 50 percent of the time. In addition, only one test each of four samples was performed, all with CMU backup. This is a minimal sample and does not address two commonly used backup systems: wood and steel. Another concern was that the sample 20
40 was fixed at the top with steel cables, which is unrealistic. MSJC s response to this concern was that the top was braced, not fixed, and the backup was heavily reinforced and doweled at the base in order to force the load into the veneer [Masonry Finding]. Additional concerns were raised about the materials used at the University of British Columbia. The wire used during the testing was 0.19 in. diameter, while MSJC required W1.7 wire (0.148 in.). The rationale for changing the code requirement states that the wire acts as a bond breaker initiating failure, but this is based upon using a wire that is 28 percent larger than required. A further concern was that a code change should not be based upon a conclusion which states, Due to the nature of this type of testing, it is difficult to be conclusive about the observations. Since only one type of each specimen is tested, it cannot be stated that the exact same results would happen on another specimen of the same type [Masonry Finding]. Further information appears to not have been included. The findings and conclusions of the 1994 Northridge earthquake report support the success of using horizontal wire in masonry veneer. Also, the Western States Clay Products Association (WSCPA) Design Guide for Anchored Brick Veneer over Steel Studs states that the wire is not for reinforcement of the veneer. It is for increasing the strength and ductility of the connection of the tie to the veneer. Thus the wire does not have to be connected or lapped like wall reinforcement. This challenges the rationale that the wire is acting as reinforcement. Finally, a code design analysis is provided for in-plane loading of the veneer. However there is no confirmation of actual performance of masonry veneer during a seismic even when subjected to in-plane loading [Masonry Finding]. 21
41 Structural Analysis Conducted at Clemson University Out-of-Plane Loading Brick will initially span vertically with help from the backing system until a bed joint near mid-height cracks from the out-of-plane loads. This usually occurs at relatively small loads. After the initial cracking, the veneer will span horizontally between studs, thereby transferring the out-of-plane loads to the backup system through the ties [McGinley et al., 2002]. The out-of-plane loading calculations shown in Appendix B.3 are based upon this reasoning. The veneer is assumed to be supported by wood studs at 16 in. o.c., which is a typical construction method. Based on this assumption, the brick can be analyzed as being simply supported over a 16 in. span, although realistically a reduced moment could be taken due to the continuous span. The out-of-plane calculations take a maximum moment over a one-foot tributary design width. The MSJC standard allows the design of masonry using strength level loading from ASCE 7. If it is assumed that this can be applied to brick veneer, the bending capacity of the veneer can be calculated. Based on these assumptions, the calculations in Appendix B.3 show that brick veneer conservatively has enough bending capacity to resist seismic events in areas where S s < This is a larger value than anything that occurs in the US, therefore the veneer has more than enough capacity to resist out-of-plane loading. A similar out-of-plane design example for veneer in Reinforced Masonry Design shows the same process. It concludes, Note that the design does not require steel wire reinforcing, which might be costly and difficult to place, thereby causing delays in 22
42 construction. This wire is totally unnecessary, since that portion of any masonry wall falling between the vertical rebar is unreinforced [Scheider et al., 1994]. A second assumption of the joint reinforcement is that its purpose is to provide sufficient ductility of the veneer after cracking. The next step would therefore be to find the capacity of the reinforced veneer. The research provided for eliminating the joint reinforcement for SDC D performed such an analysis. Some of important design assumptions are: the joint reinforcement wire was located at the center of the wall, f m = 1325 psi, the wire size used was W1.7 as per MSJC, the wire was spaced at 18 in. o.c. as per MSJC, and the calculations were performed per linear foot of wall. The results of the analysis showed that the reinforced section capacity was approximately 50 percent greater than that of the unreinforced section. This suggests that the veneer may exhibit ductile behavior after cracking when joint reinforcement is used. However, the loads needed to cause cracking are much larger than those that will be experienced. In addition, switching the type of mortar to a less conservative assumption than the original type N would result in an unreinforced capacity greater than that of the reinforced section. Furthermore, the cold-drawn wire typically used for joint reinforcement does not have the ductility of hot-rolled reinforcing bars. The cracking of the veneer also does not necessarily mean the veneer has failed. Previous research focused on the out-of-plane behavior of veneer has in fact found that when the veneer cracked at horizontal bed joints, wall stability was maintained and there was no loss of veneer. There was no horizontal joint reinforcement used in this research [McGinley et al., 2002]. 23
43 In-Plane Loading As previously stated, 50 percent of the loading during a seismic event will typically be in-plane shear. This shear will be partially carried by the veneer and partially by the backup system. The distribution of the load depends on the relative stiffness of the veneer, the backup wall system, and the in-plane stiffness of the ties [McGinley et al., 2002]. The determination of this distribution can be quite complex. Therefore, the calculations shown in Appendix B.4 assume that the veneer carries only the load produced by the acceleration of its own mass. It does not carry additional loads from the structure. The results of the in-plane calculations show that for a 30 ft. wall, the veneer would conservatively have the capacity to resist seismic events with S s up to 0.90g. These calculations include several very conservative assumptions. For instance, the veneer is assumed to have a relatively stiff response. The actual response, however, will be more ductile when the required flashing is present at the base. This flashing acts somewhat as a base isolation system and limits the amount of acceleration that is transferred to the veneer. Therefore the seismic forces experienced by the veneer would be much less than those in the calculations. In addition, the controlling shear stress is based on sliding along the bed joint. The forces required to create a diagonal crack would actually be about 10 to 15 percent greater than those found in the calculations. Joint reinforcement is only helpful in resisting diagonal cracking; it will not resist in any sliding mode of failure. Even if the veneer were to fail due to diagonal cracking, the joint reinforcement would be only marginally effective in resisting in-plane loads because there is no perpendicular reinforcement [McGinley et al., 2002]. 24
44 Structural Testing Conducted at Clemson University Three experimental programs were designed to address the various concerns and reasons for requiring horizontal wire joint reinforcement for veneer in high seismic areas. These programs addressed the out-of-plane performance of the system, the diagonal shear performance of the brick veneer, and the flexural bond strength of the veneer. Photographs of the construction of the test specimens are shown in Appendix B.5. Out-of-Plane Loading One of the main questions raised with the addition of wire horizontal joint reinforcement is whether it is detrimental to the performance of the wall system when loaded out-of-plane. In order to evaluate this issue, an experimental procedure was designed using quasi-static testing of brick veneer panels with wood frame backing. This testing method will provide a comparison of the out-of-plane performance of the veneer system with and without the wire joint reinforcement. Experimental Program Fourteen specimens were constructed using Type N mortar and ASTM C216 modular clay brick 3 ⅝ x 2 ¼ x 7 ⅝ units. The properties of these units can be found in Appendix B.6. The specimens were constructed by journeyman brick layers using typical construction methods. The support system was constructed using stud grade, sprucepine-fir 2x4 s at 16 in. o.c. with double top and side plates and a single bottom plate. The ½ in. OSB structural sheathing was attached to the framing, and a 1 in. air space was left between the sheathing and the brick veneer. Each specimen was built on a 3 ft. by 4 ft. concrete footing which was 8 in. thick. In order to simulate typical floor construction, the 25
45 frame was supported at the top and base to prevent out-of-plane translation. The veneer was tied back to the support system using 22-gauge corrugated metal brick ties at 16 in. o.c. vertically and horizontally. Seven of the specimens included wire joint reinforcement mechanically attached to the ties, while the other seven had none. In order to address the reasoning that wire joint reinforcement is in place to provide ductility for the system after diagonal shear cracking has occurred, six of the specimens included a preformed diagonal crack. This crack was created by coating the bricks with a layer of concrete form oil to prevent a bond forming between the mortar and the brick. A testing matrix is shown below in Table 3.1. Diagrams showing wiffle tree attachment locations, as well as the diagonal crack locations when included, are shown in Appendix B.7. Table 3.1 Out-of-Plane Testing Matrix Specimen Wire Joint Reinforcement Diagonal Shear Crack Group Absent Present Absent Present OP-01 x x OP-02 x x OP-03 x x OP-04 x x The specimens were loaded using a wiffle tree, also shown in Appendix B.7. To simulate uniform loading on the specimens, the last section of the wiffle tree, which consisted of thirty-two ¼ threaded rods in eight rows of four, was attached to pre-drilled holes in the wall using epoxy. The wiffle tree was then loaded using an electric screwdrive actuator with 5000 lb. capacity and +/- 2 in. range to controlled levels of deflection. The screwdrive was programmed to load the wall at a rate 0.1 in./min. This loading rate was chosen based on the ability to observe the effects each loading cycle had on the wall being tested. The load was measured using a 5000 lb. capacity load cell 26
46 attached to the screw drive. The control deflections for the loading protocol are shown in Appendix B.8. Suction loading was recorded as a positive displacement reading, while pressure loading was recorded as a negative reading. These values were chosen based on documents obtained from private communication regarding quasi-static loading protocols. A minimum of six cycles were to be loaded before the theoretical first damage state was observed, and each cycle had an increasing load. In this case, the first damage state was defined as cracking of the brick veneer at approximately in. deflection at the control point. Eight spring-loaded LVDT s were used to measure the deflection at various points of the wall. These LVDT s were placed at the top, ¾ of the height, midheight, and ¼ of the height of the wall on both the brick face and on the back of the sheathing. A diagram depicting the locations of these LVDT s is also shown in Appendix B.6. The LVDT s at the ¼ height of the wall had a range of +/- 1 in. while the rest of the LVDT s had a range of +/- 2 in. Each LVDT was calibrated so that there was less than five percent error in the readings, which corresponds to +/ in. for the 1 in. LVDT s and +/- 0.1 in. for the 2 in. LVDT s. The LVDT on the brick face of the wall at mid-height (LVDT 3) was used as the control point for loading protocol. LabView was used to control the movement of the actuator based on the readings from LVDT 3 and collect the displacement and load cell readings. Data was recorded every one-fifth of a second. Photographs showing the testing setup are included in Appendix B.7. Experimental Results Results for the out-of-plane tests are shown in Appendix B.9. For the first wall tested, data for each individual LVDT as well as the differential movements are displayed 27
47 as an example of typical data collected. From this point on, the load vs. differential movement is displayed as it is more representative of the performance of the brick veneer. This differential movement was found by subtracting the displacement of the sheathing face at a particular height and time step from the displacement of the brick face at the same height and time step. In all cases, the positive readings indicate a suction cycle, while negative readings indicate a pressure cycle. Detailed observations of each test and maximum displacement readings for each wall are shown in Appendix B.9 as well. In two of the three walls tested with no horizontal joint reinforcement and no preformed diagonal crack, no cracking was observed. In the third, one crack was visible, although it was not at a tie location. In the tests with a preformed diagonal crack but no horizontal joint reinforcement, cracks formed within the region of the diagonal crack. In one specimen, the crack location was at a tie location. In one specimen with horizontal joint reinforcement but no diagonal crack, no cracks were observed, although the test was discontinued before failure of the wall due to the supports failing. In the second, a crack was observed in the middle of the wall in a course with wire. This wall still failed by nail pullout from the frame. In the specimen with both a preformed diagonal crack and horizontal joint reinforcement, several cracks were observed. Cracks formed at four locations within the region of the diagonal crack. Two of these locations were at tie and wire locations. The load vs. displacement graphs for each wall show a pinching effect which is typical of masonry walls and indicates that cracks in the wall are opening and closing with the cyclic load. Failure in most of walls occurred by the nail connecting the 28

48 brick tie to the backup system pulling out of the wood framing. In one wall, OP-01-D, failure occurred by the top two course of brick breaking off under pressure loading. A typical nail pullout failure can be seen below in Figure 3.1, while the failure of OP-01-D can be seen in Figure 3.2. There was a significant amount of mortar that had fallen between the brick and the sheathing during construction which limited the relative movement between the two during pressure loading cycles. The load vs. displacement graphs shown in Appendix B.9 clearly show the veneer pulling away from the framing during suction loadings. Stiffness degradation in the veneer is not pronounced during these cycles as the entire veneer moves out due to straightening of the ties and pulling out of the nails. Furthermore, the stiffness degradation does not appear to vary with the presence or absence of the wire joint reinforcement. Figure 3.1 Typical Nail Pullout Failure 29

49 Figure 3.2 Failure of OP-01-D Discussion of Results Based on these results, it appears that horizontal joint reinforcement has little effect on the performance of the wall system. The horizontal joint reinforcement will not be activated until the wall begins to crack, yet for the most part, walls failed by the nails pulling out of the wood framing before significant cracking occurred. This is a typical mode of failure for this type of construction. It should be noted, however, that in all walls including wire and tested to failure, cracks formed at the locations with horizontal joint reinforcement. The wall which failed by breaking off of the top two courses appears to be the only anomaly. Nevertheless, further testing is obviously needed as data from multiple specimens for each type of construction should be used to make a more accurate conclusion. Diagonal Shear One of the concerns raised in the argument opposing removing the requirement for joint reinforcement from the standard was that in-plane tests were not performed in the UBC research. Wire joint reinforcement is believed to have a positive effect on the 30
50 wall system when cracking occurs due to diagonal shear. In order to see the effect of wire joint reinforcement under this type of loading, diagonal shear tests were performed in accordance with ASTM E 519 Standard Test Method for Diagonal Tension (Shear) in Masonry Assemblages. This method determines the diagonal tensile or shear strength by loading assemblages in compression along one diagonal, causing a diagonal tension failure with the specimen splitting parallel to the direction of loading [E519, 2007]. Experimental Program Ten 4 ft. by 4 ft. specimens were constructed for this test. Each specimen was constructed by a journeyman brick layer using Type N mortar and ASTM C216 modular clay brick 3 ⅝ x 2 ¼ x 7 ⅝ units. The properties of these units are shown in Appendix B.6. Five of the specimens included horizontal wire joint reinforcement, while the other five specimens contained none. The testing setup is depicted below in Figure 3.3 and in Appendix B.8. The specimens were not connected to any framing material, nor did they include wall ties of any kind. The specimens were cured in a laboratory with a maintained temperature of 75 ± 15ºF and relative humidity between 25 and 75% before testing began. 31


51 Figure 3.3 Diagonal Shear Test Specimen The specimens were placed in specially constructed loading shoes and loaded in the reaction frame as shown in Figure 3.3. Gypsum capping material was used as a layer between the specimens and the loading shoes to fill any gaps on the side of the shoes and ensure uniform contact between the specimen and the loading shoe. This capping material was cured for two hours before testing began. The applied loading was obtained using the hydraulic cylinders, and the load was measured using a load cell contacting the top shoe of the specimen. The first specimen tested within each group was used to determine the ultimate load and the resulting loading rate. The loading rates chosen were used so that after reaching half of the expected maximum load, the ultimate load was reached in not less than one minute, but in no more than two minutes. Experimental Results Results from the diagonal shear tests are in Appendix B.9. Wall panels with no wire joint reinforcement are marked as group DS-01-X, while walls with wire joint 32


52 reinforcement are marked as group DS-02-X. Specimen A in each group is the test specimen used to determine the ultimate load for each case. In each wall, results were fairly similar. Once the wall began to crack, it broke apart immediately. Each of the tests ran for approximately the same period of time. Specimen DS-02-C was one exception, which appeared to be more ductile than the others. It displaced more than the other walls, and as a result, the supporting chain carried a portion of the load. The maximum loads, average load, and coefficient of variation are shown with the results in Appendix B.9. A close-up of a typical failure is shown in Figure 3.4. This was a specimen with horizontal joint reinforcement, and the broken wire is visible in the middle of the photograph. Figure 3.4 Failure of Diagonal Shear Specimen Discussion of Results Based on the results of this test, it appears that the horizontal joint reinforcement has very little effect on the diagonal shear performance of the brick veneer. There is a 33
53 1.12% increase in strength from the panels with no wire to those with the wire. In addition, the wire did not hold the veneer panels together once they started to crack, as is its purpose. Flexural Bond Strength Another of the concerns raised with the addition of horizontal joint reinforcement was that it acted as a bond break. In order to evaluate this theory, flexural bond strength tests were performed following the methods set forth in ASTM C 1072 Standard Test Method of Masonry Flexural Bond Strength. The results from these tests were used as a solely as a comparison of the effect of having wire and/or ties in the mortar bed joint. This test provides a simple method for comparing the flexural bond strength of unreinforced masonry by testing the joints of masonry prisms [C1072, 2006]. Experimental Program The variables tested in this program included: the presence or absence of horizontal wire joint reinforcement, Type N or Type S mortar, and using no ties, 22 ga corrugated metal ties, or adjustable wire ties. The testing matrix is shown below in Table 3.2. Five specimens were tested within each group. Each specimen was constructed of two units in height and one unit in width and thickness. The masonry units used were ASTM C216 modular clay brick 3 ⅝ x 2 ¼ x 7 ⅝ units. The properties of these units are shown in Appendix B.6. In the specimens where wire and/or ties were used, they were placed in the center of the construction joint. The face joint of the specimens were concave tooled as they would be in actual construction, while the remaining joints were left as-is. One hour after the specimens were constructed, two bricks were placed on top 34
54 of each specimen. Examples of the specimens are shown in Appendix B.10. The specimens were cured in a lab with temperature maintained at 75 ± 15ºF and a relative humidity between 20 and 70%. The triangular wire ties used did not have a connection to the wire joint reinforcement, so a separate series of specimens were built and tested at a later date. The second set of specimens used square wire anchors with an indentation to connect to the wire joint reinforcement. The square anchors were the same gauge as the triangle ones. Photographs of the anchors are shown in Appendix B.10. Because the second set was constructed under different circumstances, control specimens were also constructed with no wire or ties to compare to the results from the original specimens. Table 3.2 Flexural Bond Strength Testing Matrix Joint Specimen Mortar Anchors Reinforcement Group With Without Type N Type S None Corrugated Adjustable FBS-01 x x x FBS-02 x x x FBS-03 x x x FBS-04 x x x FBS-05 x x x FBS-06 x x x FBS-07 x x x FBS-08 x x x FBS-09 x x x FBS-10 x x x FBS-11 x x x FBS-12 x x x The test specimen was placed in the bond wrench testing apparatus and clamped firmly into place as shown in Appendix B.10. The base support was lowered away from 35
55 the bottom brick to prevent contact during testing. The load was applied so that the total load was not applied in less than one minute or more than three minutes. Experimental Results The results for each specimen group are plotted in Appendix B.11. Plots showing the values for mortar type, absence or presence of joint reinforcement, and type of wall tie used, respectively. Each of the plots shows an average value of the net area flexural tensile strength without the maximum and minimum values of the set. The coefficient of variation for these tests varied from 0.5% to 35.4%. Full test data is available in Appendix B.11. Discussion of Results As the figures in Appendix B.11 show, there is very little correlation between the flexural bond strength of the masonry and various attributes tested. Type N mortar generally has better bond strength than Type S, but the results of these tests do not confirm this. As the presence of wall ties, joint reinforcement, or both decreases the thickness of the mortar joint, the flexural bond strength of the masonry should be decreased. In these tests, the presence of joint reinforcement results in a greater flexural bond strength in some cases and lower flexural bond strength in others. The absence of a wall tie has lower flexural bond strength than having a wire wall tie in the system, but varies when compared to the thinnest wall tie, 22-gauge corrugated metal wall tie. Based on these results, further testing would be needed to draw conclusions on the effect joint reinforcement and wall ties have on the flexural bond strength of the veneer system. 36
56 Conclusions This investigation performed a literature review based on previous research at other institutions. Testing at the University of British Columbia indicated that horizontal joint reinforcement was actually detrimental to the performance of the wall system in an out-of-plane seismic event; however an insufficient number of tests were run for conclusive results. One argument for requiring joint reinforcement is that it will improve the ductility of the wall system in out-of-plane loading after in-plane diagonal shear cracks have formed. Testing performed by the New Zealand Pottery and Ceramics Research Association found that walls with diagonal cracks due to in-plane loading performed similarly to those without diagonal cracks. Failure of veneer systems is generally due to ties becoming detached from the structure or the veneer becoming detached from the ties. Joint reinforcement cannot improve the connection of the tie to the structure, so it would not have been beneficial in those situations. In the case of the veneer detaching from the ties, mechanical attachment of the tie to joint reinforcement could theoretically improve the embedment capacity and benefit the system. Testing at UBC, however, found that at locations on the wall with a low surcharge (i.e. the top of the wall), the joint reinforcement actually reduced the embedment capacity of the tie. The top of the wall has the highest brick tie load and is the location most likely for the veneer to become detached. Conversely, results did indicate that wire joint reinforcement mechanically attached to the wall tie improved strength and stiffness degradation. The second portion of this investigation was a structural analysis on the in-plane and out-of-plane performance of the wall system. The out-of-plane analysis concluded 37
57 that the veneer would have the capacity to resist earthquake motion up to a spectral response of 5.54g, which is larger than any spectral response in the U.S. Thus, the veneer without joint reinforcement has the out-of-plane capacity to resist any seismic loading in the U.S. The results of the in-plane structural analysis show that the veneer should conservatively have enough capacity to resist seismic events with a spectral response up to 0.90g. The actual forces seen in the veneer will be much less than those assumed when the required flashing is present at the base. In addition, the forces required to create diagonal cracking would be 10 to 15 percent greater than those found in the calculations. This is because the controlling shear stress is based on sliding along the bed joint, but joint reinforcement will not resist any sliding mode of failure. Furthermore, because there is no perpendicular reinforcement, the joint reinforcement would only be marginally effective in resisting in-plane loads due to diagonal cracking failure. The final portion of this investigation was experimental. The first test performed evaluated the out-of-plane performance of brick veneer supported by a wood frame. The test examined the difference in the performance when joint reinforcement was present or absent and when a preformed diagonal crack was present or absent. The preliminary results of this test show that the joint reinforcement has no effect on the performance of the wall system even when diagonal cracks are present. The failure for this type of system will generally be from the nail pulling out of the framing. This failure occurs before significant diagonal cracking, and the wire joint reinforcement therefore is not yet activated. The second test performed looked at the diagonal shear performance of the brick veneer with and without the wire joint reinforcement. This found that the wire had 38
58 no effect on the performance of the veneer. The veneer failed at approximately the same load both with and without the joint reinforcement. In addition, the wire did not provide ductility as it is intended to do. Once the panel began to crack, it broke apart immediately. The final portion of the testing program looked at the flexural bond strength of the veneer while varying the mortar type, presence or absence of wire joint reinforcement, presence or absence of wall tie, and type of wall tie used. This test produced extremely variable results, which indicated neither the detrimental nor beneficial effect of the joint reinforcement. Based upon these investigations, there does not appear to be any evidence supporting the supposition that horizontal joint reinforcement will improve the performance of the wall system in a seismic event. Structural analysis demonstrated that veneer has the capacity to resist seismic loads without the addition of joint reinforcement. In the experimental work reviewed and performed, the joint reinforcement either indicated a detrimental effect or no effect at all on the performance of the wall system as a whole. In addition, the wire adds to the cost and construction time of the wall system. Further testing is clearly needed on this matter to investigate the effect of various backup materials and brick ties. 39
59 CONCLUSIONS This paper investigated two requirements from the current U.S. masonry standard. The investigation pertained to the height limitation for brick veneer when supported by wood frame backing. Based on literature review and structural analysis, several modifications to the code for exceeding this height limitation were suggested. The second investigation pertained to the use of required wire horizontal joint reinforcement in high seismic areas. In this investigation, literature review, structural analysis, and experimental analysis were all performed. The compilation of these information leads to the conclusion that joint reinforcement does not appear to be necessary, but further investigation should be performed for more conclusive results. 40
60 APPENDICES 41
61 Appendix A Height Restrictions for Brick Veneer with Wood Frame Backing h story Appendix A.1 Wind Load Calculations := 10 ft n story := 3 h := 34ft l x := 52 ft l y := 260ft Wind Speed: V:= 130 mph Topographic Factor: K zt := 1.0 No hills, etc. Wind Directionality Factor: K d := 0.85 ASCE Table 6-4 Importance Factor: I := 1.0 Building category II ASCE Table 6-1 Surface Roughness Category: Category B Exposure Category: Category B Velocity Pressure Exposure Coefficient: ASCE Section ASCE Section α := 7.0 z g := 1200 ft ASCE Table 6-2 z 1 := h story z 1 = 10ft z 2 := z 1 + h story z 2 = 20ft α z 1 K 1 := 2.01 K z 1 = ASCE Table 6-3 g 2 α z 2 K 2 := 2.01 K z 2 = g 2 α h K h := 2.01 K z h = g 2 42
62 Velocity Pressure: lbf hr2 q 1 := K 1 K zt K d V 2 I q 1 = 18.82psf ASCE Equation ft 2 mi lbf hr2 q 2 := ft 2 mi 2 K 2 K zt K d V 2 I q 2 = 22.95psf lbf hr2 q h := K h K zt K d V 2 I q h = 26.7psf ft 2 mi 2 Gust Effect Factor: G := 0.85 ASCE Section Wall Pressure Coefficient: C p_wind := 0.8 ASCE Figure 6-6 l x C p_lee_x := 0.5 if 1 C l p_lee_x = y l x l x if 1 < 2 l y l y l x l x if 2 < < l y l y 0.3 if l x 4 l y l y C p_lee_y := 0.5 if 1 C l p_lee_y = x l y l y if 1 < 2 l x l x l y l y if 2 < < l x l x 0.3 if l y 4 l x Internal Pressure Coefficient: Internal pressures and suctions acting on the windward and leeward walls cancel out without adding or subtracting to the overall wind loads. 43
63 Windward Pressure: p wind_1 := q 1 G C p_wind p wind_1 = psf ASCE Equation 6-17 p wind_2 := q 2 G C p_wind p wind_2 = 15.6psf p wind_h := q h G C p_wind p wind_h = 18.16psf Leeward Pressure: p lee_x := q h G C p_lee_x p lee_x = psf ASCE Equation 6-17 p lee_y := q h G C p_lee_y p lee_y = 6.809psf Total Pressure: p tot_1x := p wind_1 p lee_x p tot_1x = 24.15psf p tot_2x := p wind_2 p lee_x p tot_2x = 26.95psf p tot_hx := p wind_h p lee_x p tot_hx = 29.51psf p tot_1y := p wind_1 p lee_y p tot_1y = 19.61psf p tot_2y := p wind_2 p lee_y p tot_2y = 22.41psf p tot_hy := p wind_h p lee_y p tot_hy = 24.97psf Story Force: F story_1x := p tot_1x l y h story F story_1x = 62.78kip F story_2x := p tot_2x l y h story F story_2x = 70.07kip h story F story_hx := p tot_hx l y F 2 story_hx = 38.36kip F story_1y F story_2y F story_hy := p tot_1y l x h story F story_1y = kip := p tot_2y l x h story F story_2y = kip h story := p tot_hy l x F 2 story_hy = 6.491kip 44
64 Appendix A.2 Australian Design Values J3 Live Loads L := 1.5 kpa L = 31.33psf Floor live load where used L r := 0.25 kpa L r = 5.221psf Roof live load where used J5.2 Wind Loads Design Wind Speeds N1 Serviceability Limit State V hs := 26 m V s hs = 58.16mph Permissible Stress Method V hp := 28 m V s hp = 62.63mph Ultimate Limit State V hu := 34 m V s hu = 76.06mph N2 Serviceability Limit State V hs := 26 m V s hs = 58.16mph Permissible Stress Method V hp := 33 m V s hp = 73.82mph Ultimate Limit State V hu := 40 m V s hu = 89.48mph N3 and C1 Serviceability Limit State V hs := 32 m V s hs = 71.58mph Permissible Stress Method V hp := 41 m V s hp = 91.71mph Ultimate Limit State V hu := 50 m V s hu = 111.8mph 45
65 N4 and C2 Serviceability Limit State V hs := 39 m V s hs = 87.24mph Permissible Stress Method V hp := 50 m V s hp = 111.8mph Ultimate Limit State V hu := 61 m V s hu = 136.5mph N5 and C3 Serviceability Limit State V hs := 47 m V s hs = 105.1mph Permissible Stress Method V hp := 60 m V s hp = 134.2mph Ultimate Limit State V hu := 74 m V s hu = 165.5mph N6 and C4 Serviceability Limit State V hs := 55 m V s hs = 123.0mph Permissible Stress Method V hp := 70 m V s hp = 156.6mph Ultimate Limit State V hu := 86 m V s hu = 192.4mph Cavity and veneer walls are designed for the external or suction pressure coefficient: 0.7 causing compression for categories N1 to N6 and 0.65 causing tension for categories C1 to C4. Lateral External Pressure Used for the Design of Ties P N1 := 0.5 kpa P N1 = 10.44psf Compression P N2 := 0.7 kpa P N2 = 14.62psf Compression P N3 := 1.1 kpa P N3 = 22.97psf Compression P N4 := 1.5 kpa P N4 = 31.33psf Compression P N5 := 2.3 kpa P N5 = 48.04psf Compression P N6 := 3.1 kpa P N6 = 64.74psf Compression P C1 := 1.0 kpa P C1 = 20.89psf Tension P C2 := 1.5 kpa P C2 = 31.33psf Tension P C3 := 2.1 kpa P C3 = 43.86psf Tension P C4 := 2.9 kpa P C4 = 60.57psf Tension 46
66 Brick Veneer Expansion Appendix A.3 Differential Movement Calculations H:= 30ft Height of brick veneer T := 100 F Temperature differential k t in := Coefficient of thermal expansion - ACI Section in F k e in := Coefficient of moisture expansion - ACI Section in thermal := k t T H thermal = 0.144in moisture := k e H moisture = 0.108in brick := thermal + moisture brick = 0.252in Wood Frame Moisture Contraction t plate d joist := 1.5 in n plate := 7 := in n joist := 2 t horz := t plate n plate + d joist n joist t horz = 33in Thickness of horizontal members l stud := in n stud := 3 l studs := l stud n stud l studs = in Total length of studs MC s := 19% Supplied moisture content MC e := 10% Equilibrium moisture content MC := MC s MC e MC = 9% Change in moisture content Southern Pine e MEr := in Coefficient of moisture expansion in the radial direction - Manual in % for Engineered Wood Construction Edition - Table e MEt := in Coefficient of moisture expansion in the tangential direction - in % Manual for Engineered Wood Construction Edition - Table Assume worst case and use tangential shrinkage horz := t horz e MEt MC horz = 0.891in 47
67 According to the Manual for Engineered Wood Construction Edition, the corresponding longitudinal direction shrinkage/expansion is about 1% to 5% of that in radial and tangential direction - Assume 5% for worse case. long := l studs 0.05 e MEt MC long = 0.422in wood := horz + long wood = 1.313in := brick + wood = 1.565in Douglas-Fir-Larch e MEr := in Coefficient of moisture expansion in the radial direction - Manual in % for Engineered Wood Construction Edition - Table e MEt := in Coefficient of moisture expansion in the tangential direction - in % Manual for Engineered Wood Construction Edition - Table Assume worst case and use tangential shrinkage horz := t horz e MEt MC horz = 0.98in According to the Manual for Engineered Wood Construction Edition, the corresponding longitudinal direction shrinkage/expansion is about 1% to 5% of that in radial and tangential direction - Assume 5% for worse case. long := l studs 0.05 e MEt MC long = 0.464in wood := horz + long wood = 1.445in := brick + wood = 1.697in Western Hemlock e MEr := in Coefficient of moisture expansion in the radial direction - Manual in % for Engineered Wood Construction Edition - Table e MEt := in Coefficient of moisture expansion in the tangential direction - in % Manual for Engineered Wood Construction Edition - Table Assume worst case and use tangential shrinkage horz := t horz e MEt MC horz = 0.832in According to the Manual for Engineered Wood Construction Edition, the corresponding longitudinal direction shrinkage/expansion is about 1% to 5% of that in radial and tangential direction - Assume 5% for worse case. long := l studs 0.05 e MEt MC long = 0.394in wood := horz + long wood = 1.226in := brick + wood = 1.478in 48
68 Appendix A.4 Engineering Lumber Shrinkage Calculations LVL Douglas-Fir I-Joist d joist joist = 11.25in n joist = 2 h joist := d joist n joist h joist = 22.5in e ME := 0.20% Percent depth swell := h joist e ME joist = 0.045in LVL Spruce-Pine I-Joist joist e ME := 0.25% Percent depth swell := h joist e ME joist = 0.056in LVL Douglas-Fir Plates t plate plate := 1.5 in n plate := 7 h plate := n plate t plate h plate = 10.5in e ME := 1.0% Percent Width Swell := h plate e ME plate = 0.105in LVL Spruce-Pine Plates plate e ME := 1.5% Percent Width Swell := h plate e ME plate = 0.157in PSL Douglas-Fir Plates plate e ME := 1.0% Percent Width Swell := h plate e ME plate = 0.105in PSL Spruce-Pine Plates plate e ME := 2.0% Percent Width Swell := h plate e ME plate = 0.21in LSL Low Density Hardwood Plates plate e ME := 2.0% Percent Width Swell := h plate e ME plate = 0.21in 49
69 LVL, PSL, and LSL Studs Percent length swell is negligible wood := joist + plate wood = 0.266in := wood + brick = 0.518in 40 ft. Wall t plate d joist := 1.5 in n plate := 10 := in n joist := 3 t horz := t plate n plate + d joist n joist t horz = 48.75in Thickness of horizontal members l stud := in n stud := 4 l studs := l stud n stud l studs = 417in Total length of studs Southern Pine e MEt := in Coefficient of moisture expansion in the tangential direction - in % Manual for Engineered Wood Construction Edition - Table plate_sp := t plate n plate e MEt MC plate_sp = 0.405in long_sp := l studs 0.05 e MEt MC long_sp = 0.563in LVL Spruce-Pine I-Joist e ME := 0.25% Percent depth swell joist_lvl := d joist n joist e ME joist_lvl = 0.084in PSL Spruce-Pine Plates e ME := 2.0% Percent Width Swell plate_psl := t plate n plate e ME plate_psl = 0.3in Using SP plates and studs and LVL joists := brick + plate_sp + long_sp + joist_lvl = 1.304in Using SP studs, LVL joists, and PSL plates := brick + long_sp + joist_lvl + plate_psl = 1.199in Using all engineered lumber := brick + joist_lvl + plate_psl = 0.636in 50
70 50 ft. Wall t plate d joist := 1.5 in n plate := 13 := in n joist := 4 t horz := t plate n plate + d joist n joist t horz = 64.5in Thickness of horizontal members l stud := in n stud := 5 l studs := l stud n stud l studs = in Total length of studs Southern Pine e MEt := in Coefficient of moisture expansion in the tangential direction - in % Manual for Engineered Wood Construction Edition - Table plate_sp := t plate n plate e MEt MC plate_sp = 0.526in long_sp := l studs 0.05 e MEt MC long_sp = 0.704in LVL Spruce-Pine I-Joist e ME := 0.25% Percent depth swell joist_lvl := d joist n joist e ME joist_lvl = 0.113in PSL Spruce-Pine Plates e ME := 2.0% Percent Width Swell plate_psl := t plate n plate e ME plate_psl = 0.39in Using SP plates and studs and LVL joists := brick + plate_sp + long_sp + joist_lvl = 1.595in Using SP studs, LVL joists, and PSL plates := brick + long_sp + joist_lvl + plate_psl = 1.458in Using all engineered lumber := brick + joist_lvl + plate_psl = 0.755in 60 ft. Wall t plate d joist := 1.5 in n plate := 16 := in n joist := 5 t horz := t plate n plate + d joist n joist t horz = 80.25in Thickness of horizontal members l stud l studs := in n stud := 6 := l stud n stud l studs = 625.5in Total length of studs 51
71 Southern Pine e MEt := in Coefficient of moisture expansion in the tangential direction - in % Manual for Engineered Wood Construction Edition - Table plate_sp := t plate n plate e MEt MC plate_sp = 0.648in long_sp := l studs 0.05 e MEt MC long_sp = 0.844in LVL Spruce-Pine I-Joist e ME := 0.25% Percent depth swell joist_lvl := d joist n joist e ME joist_lvl = 0.141in PSL Spruce-Pine Plates e ME := 2.0% Percent Width Swell plate_psl := t plate n plate e ME plate_psl = 0.48in Using SP plates and studs and LVL joists := brick + plate_sp + long_sp + joist_lvl = 1.885in Using SP studs, LVL joists, and PSL plates := brick + long_sp + joist_lvl + plate_psl = 1.717in Using all engineered lumber := brick + joist_lvl + plate_psl = 0.873in 120 ft. Wall t plate d joist := 1.5 in n plate := 34 := in n joist := 11 t horz := t plate n plate + d joist n joist t horz = in Thickness of horizontal members l stud := in n stud := 12 l studs := l stud n stud l studs = in Total length of studs Southern Pine e MEt := in Coefficient of moisture expansion in the tangential direction - in % Manual for Engineered Wood Construction Edition - Table plate_sp := t plate n plate e MEt MC plate_sp = 1.377in long_sp := l studs 0.05 e MEt MC long_sp = 1.689in 52
72 LVL Spruce-Pine I-Joist e ME := 0.25% Percent depth swell joist_lvl := d joist n joist e ME joist_lvl = 0.309in PSL Spruce-Pine Plates e ME := 2.0% Percent Width Swell plate_psl := t plate n plate e ME plate_psl = 1.02in Using SP plates and studs and LVL joists := brick + plate_sp + long_sp + joist_lvl = 3.627in Using SP studs, LVL joists, and PSL plates := brick + long_sp + joist_lvl + plate_psl = 3.27in Using all engineered lumber := brick + joist_lvl + plate_psl = 1.581in 53
73 Appendix B Horizontal Joint Reinforcement Requirements for Brick Veneer in Seismic Design Categories E and F Appendix B.1 Detailed Description of Testing Conducted by McEwan The University of British Columbia previously investigated the requirement for horizontal joint reinforcement in brick veneer. The basis of their research was to determine if Canada should require joint reinforcement in masonry courses containing brick ties in high seismic regions in the masonry standard, CSA S [McEwen et al., 2001]. The experimental program and results are discussed here. Experimental Program The main focus of this paper was to investigate the theory that horizontal joint reinforcement improves the embedment capacity of brick ties. The experimental program was set up to evaluate three types of construction: brick ties without joint reinforcement, brick ties with a single wire of joint reinforcement not connected to the tie (unclipped), and brick ties connected (clipped) to a single wire of joint reinforcement [McEwen et al., 2001]. A diagram of the clipped type of construction is shown below in Figure B.1. Figure B.1 - Two Piece Adjustable Tie Clipped to Single Wire Joint Reinforcement [McEwen et al., 2001] 54

74 The purpose of the testing was to study an element with a single brick tie in a panel which simulated the conditions in a realistic wall. The location of a tie affects its performance because ties at the base of a wall benefit from the clamping force from the weight of the bricks above. In order to account for this, surcharges of 87.7 psf and 1253 psf were added to replicate conditions near the top and bottom of a single-story wall, respectively [McEwen et al., 2001]. Tie spacing also plays a large role in the performance of the veneer system. The maximum spacing for ties in Canada is 24 in. vertically and 32 in. horizontally. In the US, maximum spacings are 18 in. vertically and 24 in. or 32 in. horizontally depending on the code. Based on these values, the brick panels were made 18 in. high and 32 in. wide with a single brick tie at the center. In addition, to simulate actual wall performance, the edges of the panel were fixed against rotation. They did, however, allow vertical movement, which allowed the surcharge to be applied to the brick element. For panels representing the top of a wall, the top edge was left free [McEwen et al., 2001]. The test element is shown below in Figure B.2. Figure B.2 - Typical Brick Panel Specimen with Edge Restraint Plates [McEwen et al., 2001] 55
75 The testing used a displacement-controlled reversed-cyclic loading protocol. Tension was applied until the hydraulic actuator moved a specified displacement, and the specimen was then unloaded. Next, compression was applied until the hydraulic actuator once again moved a specified displacement, and the specimen was unloaded again. Each specimen experienced three cycles at each target displacement. The target displacements were +/ in., in., and in. A load cell was used to measure the load applied to the brick tie. In addition, there were five LVDT displacement transducers to measure the stroke of the actuator, the out-of-plane displacement of the tie, the out-ofplane displacement of the brick at the location of the tie, and the vertical displacements across the critical mortar joint on two sides of the panel [McEwen et al., 2001]. The testing setup is shown below in Figure B.3. Figure B.3 - Elevation of Testing Setup [McEwen et al., 2001] Experimental Results During the course of this experiment, researchers found that the largest loads were required to displace the tie a few millimeters while the mortar was still undamaged. After significant damage to the mortar due to cyclic loading, smaller loads were required to displace ties to the larger displacement levels. This behavior is shown in Figure B.4. 56
76 Figure B.4 - Envelopes of Load-Displacement Curves (1 kn = lb., 2 mm = in.) [McEwen et al., 2001] In wall sections with no horizontal joint reinforcement, the embedment strengths were found to be similar regardless of the surcharge applied. In wall sections where the joint reinforcement was clipped to the tie, the surcharge had a significant influence on the embedment strength. In sections with a low surcharge applied, the joint reinforcement reduced embedment strength of the tie, while in sections with a high applied surcharge, there was an increase in embedment strength. This is shown below in Figures B.5 and B.6 which compare the envelopes for the third cycle of loading from all tests for tension. Overall, the results for compression and tension were similar [McEwen et al., 2001]. Figure B.5 - Influence of Joint Reinforcement on the Third Cycle Tension Envelopes for Low Surcharge (1 kn = lb., 1 mm = in.) [McEwen et al., 2001] 57

77 Figure B.6 - Influence of Joint Reinforcement on the Third Cycle Tension Envelopes for High Surcharge (1 kn = lb., 1 mm = in.) [McEwen et al., 2001] During testing, researchers observed local crushing of the mortar, and the tie wire bent at the location of tie bend in the specimens with no joint reinforcement. In addition, there was external push-out and pull-out of the mortar. In specimens with joint reinforcement, in addition to these observations, the mortar bed joint split horizontally. The joint reinforcement was deflected during compression loading, and the tie wire overrode it at some point. In all cases where the joint reinforcement was clipped to the ties, the clip became detached. A failed specimen showing the mortar split due to the presence of the wire joint reinforcement is below in Figure B.7 [McEwen et al., 2001]. Figure B.7 - Mortar Split in Failed Specimen [McEwen et al., 2001] 58
78 Conclusions One conclusion drawn by this research was that there was no improvement in embedment strength when using joint reinforcement that is not clipped to the tie. Ties at the top of a wall typically have the highest brick tie load and the lowest brick tie embedment resistance. The testing showed that in specimens with a low applied surcharge, representing the top of a wall, the addition of joint reinforcement actually reduced the peak embedment strength. For specimens with a high applied surcharge, however, the joint reinforcement increased the embedment strength. Finally, the clips used to attach the wire to the brick tie allowed the tie to over-ride the joint reinforcement wire so that the two wires eventually became unclipped. This may have been due to the loading protocol being too harsh as approximately 40 cycles of loading were applied [McEwen et al., 2001]. 59
79 Appendix B.2 Detailed Description of Research Conducted by Turek The University of British Columbia further investigated the necessity of horizontal joint reinforcement requirement by performing shake table testing. The purpose of this testing was to observe the overall performance of large-scale veneer walls with and without wire joint reinforcement subjected to out-of-plane shake table loading [Turek et al., 2002]. Experimental Program This testing utilized four test specimens 10 ft. and 8 ft. The specimens compared Canadian tie spacing requirements to those of the US. Both tie spacings were tested with and without wire joint reinforcement. Tests were performed at the Earthquake Laboratory at the University of British Columbia using a 24.6 ft. x 19.7 ft. uni-axial shake table. The motion of the actuator for the shake table was displacement driven with a maximum stroke of +/- 18 in., a load capacity of lb., and a maximum velocity of 18 in./sec [Turek et al., 2002]. The clay brick veneer was attached to each side of heavily-reinforced concrete masonry unit (CMU) walls. The CMU walls used 8 in. blocks and were vertically reinforced with No. 5 bars grouted into every third core. The walls were mounted on a reinforced concrete base-beam and connected using vertical steel dowels. The veneer consisted of 3.5 in. cored clay bricks attached to the back-up system using brick ties (Fero Block Shear Connectors). The joint reinforcing system is shown below in Figure B.8. Specimens 1 and 2 used a tie spacing of 16 in. by 16 in. as required by the US codes. Specimens 3 and 4 used a spacing of 32 in. horizontally by 24 in. vertically as 60

80 required by the Canadian codes. Specimens 1 and 3 had wire joint reinforcement, while specimens 2 and 4 did not. The specimens were constructed by journeyman brick layers using typical current building techniques. They used typical type S mortar with a 28-day compressive strength of 1233 psi [Turek et al., 2002]. Figure B.8 - Joint Reinforcing System [Turek et al., 2002] The base beam was attached to the shake table using eight steel angles to restrain vertical and horizontal motions, while the top of the wall was restrained using steel cables. The wall system is shown below in Figure B.9. Instrumentation was set up as shown in Figure B.10 to measure the accelerations and displacements in four locations [Turek et al., 2002]. 61

81 Figure B.9 - Front View of Wall Assembly [Turek et al., 2002] Figure B.10 - Instrumentation Setup [Turek et al., 2002] 62
82 The experiment used the VERTEQII synthetic record for the earthquake record. This was chosen because of the large amount of high-frequency content. This made it ideal for testing masonry structures because masonry is very stiff and tends to have high natural frequencies. In addition, this record had a rather symmetric shape, which ensured that the wall on each side of the backup system would see similar load effects. Each system was loaded using stepped magnitudes of peak accelerations [Turek et al., 2002]. Experimental Results Specimens 1 and 2 were the first to be tested. During the first run at 0.25g, no cracks were observed in either veneer. This was also the case during the second run at 0.50g, although Specimen 2 did become loose at the ties. This caused some relative movement of the entire wall with respect to the backup system. Cracking began to occur during the third run at 0.65g. In Specimen 1, there were significant horizontal cracks at the courses with wires, and researchers observed rotations at several wire locations. In specimen 2, the connection between the veneer and the block wall became very loose, and there was visible pounding damage at the top row of ties, although the veneer still moved as a solid unit. Specimen 1 failed quickly during the fourth run at 0.75g. At the end of the run, only the bottom eight courses of brick remained standing. During this run, Specimen 2 experienced more cracking. At the end of the fifth run at 0.85g, only the bottom 3 courses of brick remained on Specimen 1. Specimen 2 moved more dramatically as a whole unit, and several cracks appeared at the top of the specimen, although none of them ran the length of the wall. During the final run at 0.95g, the topwest corner of Specimen 2 fell off. The veneer still moved as an entire unit, which had 63
![deformed the ties greatly [Turek et al., 2002].](/docs-images/85/92595435/images/83-0.jpg "Photographs of this testing are shown below in Figures B.")

83 deformed the ties greatly [Turek et al., 2002]. Photographs of this testing are shown below in Figures B.11 and B.12. Figure B.11 - Tie Pounding in Specimen 2 [Turek et al., 2002] Figure B.12 - Failure of Specimen 1 [Turek et al., 2002] 64

84 The next test was performed on the system with Specimens 3 and 4. During the first run at 0.25g, no visible cracking was observed. Specimen 4 experienced similar motions to those in the first test where the entire veneer moved as a whole. During the second run at 0.40g, two partial horizontal cracks at wire locations were observed in Specimen 3. Specimen 4 experienced severe cracking and almost failed. The crack in Specimen 3 opened along the entire length in the third run at 0.50g. The top east corner of Specimen 4 collapsed during this run, and there was more pronounced cracking. During the fourth run at 0.60g, Specimen 3 rotated at the cracked points, and the cracks expanded the length of the wall. Specimen 4 failed in a similar manner to the first test with the bricks spanning between the top two rows of ties buckling outwards. Specimen 3 failed during the final run at 0.65g with a collapse mechanism similar to the first test. The entire veneer failed at once with the exception of the bottom three courses of brick [Turek et al., 2002]. Photographs depicting this are shown in Figures B.13, 14, and 15. Figure B.13 - Failure of Top East Corner of Specimen 4 [Turek et al., 2002] 65


85 Figure B.14 - Failure of Specimen 4 [Turek et al., 2002] Figure B.15 - Failure of Specimen 3 [Turek et al., 2002] 66
86 Conclusions The authors noted that it was difficult to be conclusive about the observations of this testing. Only one type of each specimen was tested, so results could vary if more specimens were tested. It should be noted, however, that all of the specimens failed at accelerations higher than the design levels [Turek et al., 2002]. In the first test, the specimen with the wire joint reinforcement failed while the specimen without the wire did not. It appeared that the wire joint reinforcement initiated failure by providing a location for crack propagation to begin. The failure began between the top two courses of brick. Cracking occurred at the tie locations, allowing rotation at those places. The bricks between cracks then buckled outward, and the wall became a series of cantilevers which collapsed easily. Specimen 2 because very loose and rocked significantly; however, it appeared that the wall did not fail because of this. The forces input to the wire-tied side were not transferred because of the allowable movement, which was caused by tie deformation occurring early in the run [Turek et al., 2002]. In the second test, the wire reinforced side failed at lower accelerations than that of the first test. The failure mechanisms were similar to those of the first test, with the exception of the wire reinforced side failing first. It is possible that this occurred because there was one-third of the amount of ties, increasing the tie spacing to the point where the buckling loads reached the critical values for those spans [Turek et al., 2002]. In addition, the authors observed that the brick ties on the non-wire sides yielded and broke, which could be the reason those sides failed. During the second test, the ties experienced higher loads because of their larger spacing. This allowed for greater 67
87 displacement at the top of the wall, while restraining the bottom, causing greater cracking than in the first test series. It is possible that this initiated the overall failure. Overall, it was noted that the wire joint reinforcement did not hold the wall together after failure, as it is intended to do [Turek et al., 2002]. 68
88 Appendix B.3 Out-of-Plane Structural Analysis Minimum Equivalent Static Force F p 0.4 a p S DS W p 1 2 z R + ASCE 7-05 Eqn p h I p F p 1.6 S DS I p W p ASCE 7-05 Eqn F p 0.3 S DS I p W p ASCE 7-05 Eqn a p := 1.0 R p := 2.5 ASCE 7-05 Table Veneer: Limited deformability elements and attachments a p := 1.0 R p := 1.5 ASCE 7-05 Table Veneer: Low deformability elements and attachments Use R p = 1.5 z h I p := S DS W p F p ( ) F 1.5 p 0.8 S DS W p S DS 1.0 W p < F p 0.8 S DS W p < 1.6 S DS 1.0 W p OK Out-of-Plane Analysis Provisions from ACI : Nominal strength taken as 2.5 times allowable stress (Section ) Design strength taken as φ times nominal strength (Section ) φ = 0.80 for axial load and flexure, except for flexural tension in unreinforced masonry φ = 0.40 for flexural tension in unreinfored masonry φ = 0.60 for shear φ = 0.60 for shear and tension on anchor bolts embedded in masonry 69
89 Table B.1 Allowable Flexural Tensile Stresses for Clay and Concrete Masonry Mortar types Portland Masonry cement or Direction of flexural tensile stress and cement/lime or air entrained portland masonry type mortar cement cement/lime Normal to bed joints Parallel to bed joints in running bond M or S N M or S N Solid units 40 psi 30 psi 24 psi 15 psi Ungrouted 25 psi 19 psi 15 psi 9 psi Hollow units Fully grouted 65 psi 63 psi 61 psi 58 psi Solid units 80 psi 60 psi 48 psi 30 psi Hollow units Ungrouted and partially grouted 50 psi 38 psi 30 psi 19 psi Fully grouted 80 psi 60 psi 48 psi 30 psi Parallel to bed joints in stack bond 0 psi 0 psi 0 psi 0 psi Assume 12 inch section, studs at 16 in. o.c., and 4 inch nominal brick (t = in.) bt 2 b := 12in t := in s := 16in S := S = 26.28in 3 6 F t := 30 psi φ f := 0.40 M r := φ f 2.5 S F t M r = 65.70lbf ft wl 2 M max 8 ( ) S DS W p 8 ft s 2 W p := 40 psf for clay brick veneer Guess S DS := 4 Given 0.8 S DS W p 1 ft s 2 8 M r S DS := Find( S DS ) S DS = S MS := 2 S DS S MS = S s S MS F F a 0.8 if SiteClassA a 1.0 if SiteClassB 1.2 if SiteClassC 1.6 if SiteClassD Assume Site Class E (conservative) F a := if SiteClassE S MS S s := S F s = a 70
90 t := in A n Lt Appendix B.4 In-Plane Structural Analysis f' m conservatively assumed to be 1325 psi as per "Effects of Horizontal Joint Reinforcment on the Seismic Behavior of Masonry Veneers" f' m := 1325 psi υ := 37 psi h := 30ft N v W p L h A n := Lt N v A n W p h t φ v := 0.60 W p h F v := min 1.5 f' m psi, 120 psi, υ F t v = 49.41psi V r 2.5 φ v 2 3 F v A n V r 2.5 φ v 2 3 F v t L V F p h L F p 0.8 S DS W p V 0.8 S DS W p h L S DS 2.5 φ v 2 3 F v t L 0.8 W p h L φ v 3 F v t S DS := S 0.8 W p h DS = S DS F a := 2.5 S MS := 2 S DS S MS = S s := S F s = a φ v 3 F v t For gabled end of a veneer wall: h := 38ft S DS := S 0.8 W p h DS = S DS S MS := 2 S DS S MS = S s := S F s = a 71


 17 of 4")


91 Appendix B.5 Specimen Construction Photographs Figure B.16 Construction of 4 ft. by 8 ft. Wall Specimens (1) Figure B.17 Construction of 4 ft. by 8 ft. Wall Specimens (2) 72

 19")
92 Figure B.18 Construction of 4 ft. by 8 ft. Wall Specimens (3) Figure B.19 Construction of 4 ft. by 8 ft. Wall Specimens (4) 73


93 Figure B.20 Construction of 4 ft. by 8 ft. Wall Specimens (5) Figure B.21 Construction of 4 ft. by 8 ft. Wall Specimens (6) 74


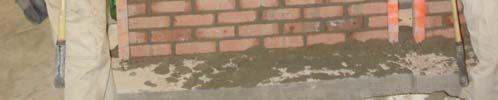
94 Figure B.22 Construction of 4 ft. by 8 ft. Wall Specimens (7) Figure B.23 Formation of Diagonal Crack in 4 ft. by 8 ft. Wall Specimens 75
95 Figure B.24 Construction of Shear Panel 76
96 Appendix B.6 Brick Properties 77
97 Appendix B.7 Testing Setup 1/4" Threaded bar Typical 6 9/16" 1/2" Threaded Bar Typical 13 1/8" 6 9/16" 3/4" Threaded rod connecting to screwdrive 4'-4 1/2" Horizontal Tubes 8' 3' Figure B.25 Diagram of Wiffle Tree 78
98 Figure B.26 LVDT Locations 79


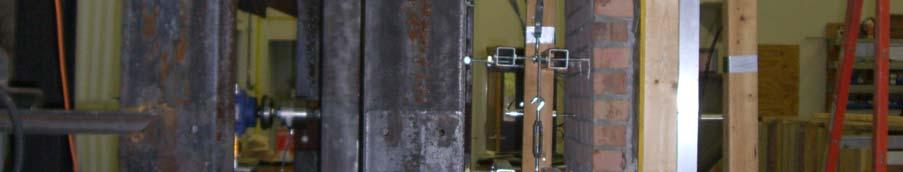


99 Figure B.27 Testing Setup 80
100 Figure B.28 Screwdrive Actuator Figure B.29 Connection of Actuator to Wiffle Tree 81
101 Figure B.30 Diagram of Test Specimen Showing Wiffle Tree Connection and Diagonal Crack Locations 82
102 Appendix B.8 Control Deflections for Loading of Out-of-Plane Walls Table B.2 Control Deflection Values for Out-of-Plane Loading Cycle Deflection (in) Deflection (mm) Cycle Deflection (in) Deflection (mm)
103 Target Deflection (in) Figure B.31 Control Deflections for Out-of-Plane Loading The yellow cells highlighted in Table B.2 indicate the theoretical values where the veneer would begin to crack. This was the first damage state. 84
104 Appendix B.9 Out-of-Plane Test Results OP-03-A Tested October 17, LVDT 1 LVDT 2 LVDT 3 LVDT Displacement (in.) Figure B.32 OP-03-A Displacement vs. Time Step for Brick Face LVDT 5 LVDT 6 LVDT 7 LVDT Displacement (in.) Figure B.33 OP-03-A Displacement vs. Time Step for Sheathing Face 85
105 Top of Wall 3/4 Height Mid Height 1/4 Height Differential Displacement (in.) Figure B.34 OP-03-A Differential Displacement vs. Time Step Load (lbs) Figure B.35 OP-03-A Load vs. Time Step 86
106 Load (lbs) Displacement (in.) Figure B.36 OP-03-A LVDT 1 Load vs. Displacement Load (lbs) Displacement (in.) Figure B.37 OP-03-A LVDT 2 Load vs. Displacement 87
107 Load (lbs) Displacement (in.) Figure B.38 OP-03-A LVDT 3 Load vs. Displacement Load (lbs) Displacement (in.) Figure B.39 OP-03-A LVDT 4 Load vs. Displacement 88
108 Load (lbs) Displacement (in.) Figure B.40 OP-03-A LVDT 5 Load vs. Displacement Load (lbs) Displacement (in.) Figure B.41 OP-03-A LVDT 6 Load vs. Displacement 89
109 Load (lbs) Displacement (in.) Figure B.42 OP-03-A LVDT 7 Load vs. Displacement Load (lbs) Displacement (in.) Figure B.43 OP-03-A LVDT 8 Load vs. Displacement
110 Load (lbs) Differential Displacement (in.) Figure B.44 OP-03-A Load vs. Differential Displacement at Top of Wall Load (lbs) Differential Displacement (in.) Figure B.45 OP-03-A Load vs. Differential Displacement at ¾ Height of Wall 91
111 Load (lbs) Differential Displacement (in.) Figure B.46 OP-03-A Load vs. Differential Displacement at Mid Height of Wall Load (lbs) Differential Displacement (in.) Figure B.47 OP-03-A Load vs. Differential Displacement at ¼ Height of Wall 92
112 Table B.3 Maximum Displacement Readings for OP-03-A Suction (in.) Pressure (in.) LVDT LVDT LVDT LVDT LVDT LVDT LVDT LVDT Differential Top Differential 3/4 Height Differential Mid-Height Differential 1/4 Height This wall had horizontal joint reinforcement, but no preformed diagonal crack. As this was the first test and the extent of displacement was not yet known, the LVDT s used had smaller ranges. At the top and mid-height of the wall on both the brick and sheathing faces, an LVDT with +/- 1 in. range was used. At ¾ and ¼ of the wall height on both the brick and sheathing faces, an LVDT with +/- ½ in. range was used. This test had to be stopped before failure because the bracing at the top of the wall was beginning to fail. The wall was originally braced with 8 ft. 2x4 s back to the reaction frame and the 2x4 s began to crack at a load of approximately 450 lb. After this point, the braces were replaced with steel tubing. Maximum loads of 390 lb. and 466 lb. were reached in suction and pressure respectively before the test was stopped. No cracks were visible during this test. 93
113 OP-01-A Tested October 19, Load (lbs) Differential Displacement (in.) Figure B.48 OP-01-A Load vs. Differential Displacement at Top of Wall Load (lbs) Differential Displacement (in.) Figure B.49 OP-01-A Load vs. Differential Displacement at ¾ Height of Wall 94
114 Load (lbs) Differential Displacement (in.) Figure B.50 OP-01-A Load vs. Differential Displacement at Mid Height of Wall Load (lbs) Differential Displacement (in.) Figure B.51 OP-01-A Load vs. Differential Displacement at ¼ Height of Wall 95
115 Table B.4 Maximum Displacement Readings for OP-01-A Suction (in.) Pressure (in.) LVDT LVDT LVDT LVDT LVDT LVDT LVDT LVDT Differential Top Differential 3/4 Height Differential Mid-Height Differential 1/4 Height This wall had neither horizontal joint reinforcement nor a preformed diagonal crack. The LVDT s were placed in the same configuration as those of wall OP-03-A. During this test, it was observed that the gap between the brick and the sheathing during suction loadings was much larger at the top of the wall than at the bottom of the wall. When loading to a control displacement of in. (approximately 50,000 time steps), LVDT reached its maximum range of 0.5 in. In order to test the wall to failure, this LVDT was moved back for further cycles and values should be discarded after this point. A similar situation occurred with LVDT 6 when loading to a control displacement of in. (approximately 70,000 time steps) and was handled in the same manner. When loading to a control displacement of in. (approximately 75,000 time steps), the wiffle tree buckled and the test was stopped. No cracks were observed during the course of this test. Maximum loads of 952 lb. and 625 lb. were reached in suction and pressure respectively. 96
116 OP-02-C Test 1 Tested October 31, Load (lbs) Differential Displacement (in.) Figure B.52 OP-02-C Test 1 Load vs. Differential Displacement at Top of Wall Load (lbs) Differential Displacement (in.) Figure B.53 OP-02-C Test 1 Load vs. Differential Displacement at ¾ Height of Wall 97
117 Load (lbs) Differential Displacement (in.) Figure B.54 OP-02-C Test 1 Load vs. Differential Displacement at Mid Height of Wall Load (lbs) Differential Displacement (in.) Figure B.55 OP-02-C Test 1 Load vs. Differential Displacement at ¼ Height of Wall 98
118 OP-02-C Test 2 Tested November 7, Load (lbs) Differential Displacement (in.) Figure B.56 OP-02-C Test 2 Load vs. Differential Displacement at Top of Wall Load (lbs) Differential Displacement (in.) Figure B.57 OP-02-C Test 2 Load vs. Differential Displacement at ¾ Height of Wall 99
119 Load (lbs) Differential Displacement (in.) Figure B.58 OP-02-C Test 2 Load vs. Differential Displacement at Mid Height of Wall Load (lbs) Differential Displacement (in.) Figure B.59 OP-02-C Test 2 Load vs. Differential Displacement at ¼ Height of Wall 100
120 OP-02-C Test 3 Tested October 19, Load (lbs) Displacement (in.) Figure B.60 OP-02-C Test 3 Load vs. Differential Displacement at Top of Wall Load (lbs) Displacement (in.) Figure B.61 OP-02-C Test 3 Load vs. Differential Displacement at ¾ Height of Wall 101
121 Load (lbs) Displacement (in.) Figure B.62 Op-02-C Test 3 Load vs. Differential Displacement at Mid Height of Wall Load (lbs) Displacement (in.) Figure B.63 OP-02-C Test 3 Load vs. Differential Displacement at ¼ Height of Wall 102
122 OP-02-C Test 4 Tested November 20, Load (lbs) Differential Displacement (in.) Figure B.64 OP-02-C Test 4 Load vs. Differential Displacement at Top of Wall Load (lbs) Differential Displacement (in.) Figure B.65 OP-02-C Test 4 Load vs. Differential Displacement at ¾ Height of Wall 103
123 Load (lbs) Differential Displacement (in.) Figure B.66 OP-02-C Test 4 Load vs. Differential Displacement at Mid Height of Wall Load (lbs) Differential Displacement (in.) Figure B.67 OP-02-C Test 4 Load vs. Differential Displacement at ¼ Height of Wall 104
124 OP-02-C Test 5 Tested November 27, Load (lbs) Differential Displacement (in.) Figure B.68 OP-02-C Test 5 Load vs. Differential Displacement at Top of Wall Load (lbs) Differential Displacement (in.) Figure B.69 OP-02-C Test 5 Load vs. Differential Displacement at ¾ Height of Wall 105
125 Load (lbs) Differential Displacement (in.) Figure B.70 OP-02-C Test 5 Load vs. Differential Displacement at Mid Height of Wall Load (lbs) Differential Displacement (in.) Figure B.71 OP-02-C Test 5 Load vs. Differential Displacement at ¼ Height of Wall 106
126 OP-02-C Test 6 Tested November 27, Load (lbs) Differential Displacement (in.) Figure B.72 OP-02-C Test 6 Load vs. Differential Displacement at Top of Wall Load (lbs) Differential Displacement (in.) Figure B.73 OP-02-C Test 6 Load vs. Differential Displacement at ¾ Height of Wall 107
127 Load (lbs) Differential Displacement (in.) Figure B.74 OP-02-C Test 6 Load vs. Differential Displacement at Mid Height of Wall Load (lbs) Differential Displacement (in.) Figure B.75 OP-02-C Test 6 Load vs. Differential Displacement at ¼ Height of Wall 108
128 Table B.5 Maximum Displacement Readings for OP-02-C Test 6 Suction (in.) Pressure (in.) LVDT LVDT LVDT LVDT LVDT LVDT LVDT LVDT Differential Top Differential 3/4 Height Differential Mid-Height Differential 1/4 Height This wall had a preformed diagonal crack, but no horizontal joint reinforcement. The LVDT configuration was finalized as stated in Experimental Procedures. This wall was used for several test runs as it did not break in order to iron out the problems with the testing procedure and apparatus. The first two tests were stopped due to the wiffle tree buckling under pressure loadings. After this point, cables were added to tie the wiffle tree back to the reaction frame and brace it against side sway. In the third test, a crack was visible below the 16 th course of brick during suction loadings after reaching a control displacement of in. (approximately 18,000 time steps). This course was in the middle of the diagonal crack, and at a tie location. The wiffle tree failed with the second row of ¼ in. rods buckling. These rods were replaced with ½ in. threaded rods for subsequent tests. The fourth test was terminated when the blocking behind the screwdrive actuator became loose and fell. The connections supporting the screwdrive were tightened in order to prevent this in future tests. The fifth test was terminated at a pressure loading of approximately 950 lb. because the beam supporting the screwdrive started to deflect. A third beam was added for additional support. The sixth and final test 109
129 on this was able to run to failure. Until this test, the only noticeable damage was the crack at the 16 th course during the third test. During this sixth test, no new cracks were visible. The screwdrive motion was maxed out when going to a pressure loading of in. at the control LVDT. At this point the control LVDT was moved and the wall was loaded in suction until failure. The test continued until the screwdrive motion was maxed out in suction, although failure in the wall was already evident. This wall failed due to nail pullout, most prominent at the top of the wall. Maximum loads of 2876 lb. and 1108 lb. were reached in suction and pressure, respectively. 110
130 OP-04-A Tested November 30, Load (lbs) Figure B.76 OP-04-A Load vs. Differential Displacement at Top of Wall Load (lbs) Figure B.77 OP-04-A Load vs. Differential Displacement at ¾ Height of Wall 111
131 Load (lbs) Figure B.78 OP-04-A Load vs. Differential Displacement at Mid Height of Wall Load (lbs) Figure B.79 OP-04-A Load vs. Differential Displacement at ¼ Height of Wall 112
132 Table B.6 Maximum Displacement Readings for OP-04-A Suction (in.) Pressure (in.) LVDT LVDT LVDT LVDT LVDT LVDT LVDT LVDT Differential Top Differential 3/4 Height Differential Mid-Height Differential 1/4 Height This wall had both a preformed diagonal crack and horizontal joint reinforcement. Two cracks began to form on the left of the wall above the 15 th and 16 th courses when loading to a control displacement of in. (30,000 time steps). Both of these locations are in the range of the diagonal crack, and the 16 th course is at a tie and wire location. When loading to a control displacement of in. (45,000 time steps), the crack at the 15 th course was visible across three-quarters of the wall, and a new crack formed across the right side of the wall above the 14 th course (also within the diagonal crack range). At a control displacement of in. (52,000 time steps), the crack at the 15 th course had spread across the width of the wall, and the crack at the 14 th course was slightly longer. At a control displacement of in. (59,000 time steps), nail pullout was becoming evident. At a control displacement of in. (67,000 time steps), two new cracks formed above courses 9 and 22. The crack at course 9 spread along the entire width of the wall and was neither within the diagonal crack nor at a tie and wire location. The crack at course 22 was on the right side only, and this location was both within the diagonal crack range and at a tie and wire location. While loading to a control 113
133 displacement of in. pressure, the screwdrive maxed out. The control LVDT was pulled back so that a suction cycle could be loaded until the failure of the wall. The wall eventually failed by nail pullout from the frame. Maximum loads of 2163 lb. and 1494 lb. were recorded in suction and pressure, respectively. 114
134 OP-01-D Tested December 3, Load (lbs) Differential Displacement (in.) Figure B.80 OP-01-D Load vs. Differential Displacement at Top of Wall Load (lbs) Differential Displacement (in.) Figure B.81 OP-01-D Load vs. Differential Displacement at ¾ Height of Wall 115
135 Load (lbs) Differential Displacement (in.) Figure B.82 OP-01-D Load vs. Differential Displacement at Mid Height of Wall Load (lbs) Differential Displacement (in.) Figure B.83 OP-01-D Load vs. Differential Displacement at ¼ Height of Wall 116
136 Table B.7 Maximum Displacement Readings for OP-01-D Suction (in.) Pressure (in.) LVDT LVDT LVDT LVDT LVDT LVDT LVDT LVDT Differential Top Differential 3/4 Height Differential Mid-Height Differential 1/4 Height This wall had neither a preformed diagonal crack nor horizontal joint reinforcement. While loading of this wall, a crack appeared across the width of the wall above the 13 th course at a control displacement of in. (approximately 42,000 time steps). This was not at a tie location. The wall failed during the following pressure cycle by the top two courses of brick breaking off. This location was below the top loading point and two courses above the last tie location. Maximum loads of 1611 lb. and 1138 lb. were recorded in suction and pressure, respectively. 117
137 OP-02-A Tested December 6, Load (lbs) Differential Displacement (in.) Figure B.84 OP-02-A Load vs. Differential Displacement at Top of Wall Load (lbs) Differential Displacement (in.) Figure B.85 OP-02-A Load vs. Differential Displacement at ¾ Height of Wall 118
138 Load (lbs) Differential Displacement (in.) Figure B.86 OP-02-A Load vs. Differential Displacement at Mid Height of Wall Load (lbs) Differential Displacement (in.) Figure B.87 OP-02-A Load vs. Differential Displacement at ¼ Height of Wall 119
139 Table B.8 Maximum Displacement Readings for OP-02-A Suction (in.) Pressure (in.) LVDT LVDT LVDT LVDT LVDT LVDT LVDT LVDT Differential Top Differential 3/4 Height Differential Mid-Height Differential 1/4 Height This is a wall with a preformed diagonal crack, but no horizontal joint reinforcement. When loading to a control displacement of in. (approximately 24,000 time steps), a crack formed above the 18 th course on the right side of the wall. This location is within the range of the diagonal crack. When loading to a control displacement of in. in pressure (approximately 27,000 time steps), the screwdrive maxed out. The control LVDT was pulled out in order to ramp the wall to failure in suction and readings from this LVDT after this point were ignored. During the final suction loading, another crack formed on the right side and cut diagonally through the mortar and brick to the 19 th course on the left side. This is still within the range of the diagonal crack, although it moves in the opposite direction. The top row of ties completely pulled out of the framing, while the second row of ties was almost pulled completely out. One tie in the second row from the top on the left-hand side pulled out of the mortar. This was not at a crack location. Maximum loads of 2632 lb. and 1374 lb. were recorded in suction and pressure, respectively. 120
140 OP-01-C Tested April 10, Load (lbs) Differential Displacement (in.) Figure B.88 OP-01-C Load vs. Differential Displacement at Top of Wall Load (lbs) Differential Displacement (in.) Figure B.89 OP-01-C Load vs. Differential Displacement at ¾ Height of Wall 121
141 Load (lbs) Differential Displacement (in.) Figure B.90 OP-01-C Load vs. Differential Displacement at Mid Height of Wall Load (lbs) Differential Displacement (in.) Figure B.91 OP-01-C Load vs. Differential Displacement at ¼ Height of Wall 122
142 Table B.9 Maximum Displacement Readings for OP-01-C Suction (in.) Pressure (in.) LVDT LVDT LVDT LVDT LVDT LVDT LVDT LVDT Differential Top Differential 3/4 Height Differential Mid-Height Differential 1/4 Height This wall has neither horizontal joint reinforcement nor a preformed diagonal crack. No cracks were observed during the testing of this wall. The wall failed by nail pullout from the wood framing. The maximum loads observed were 1438 lb. and 930 lb. in suction and pressure, respectively. 123
143 OP-03-B Tested April 17, Load (lbs) Differential Displacement (in.) Figure B.92 OP-03-B Load vs. Differential Displacement at Top of Wall Load (lbs) Differential Displacement (in.) Figure B.93 OP-03-B Load vs. Differential Displacement at ¾ Height of Wall 124
144 Load (lbs) Differential Displacement (in.) Figure B.94 OP-03-B Load vs. Differential Displacement at Mid Height of Wall Load (lbs) Differential Displacement (in.) Figure B.95 OP-03-B Load vs. Differential Displacement at ¼ Height of Wall 125
145 Table B.10 Maximum Displacement Readings for OP-03-B Suction (in.) Pressure (in.) LVDT LVDT LVDT LVDT LVDT LVDT LVDT LVDT Differential Top Differential 3/4 Height Differential Mid-Height Differential 1/4 Height This wall includes horizontal joint reinforcement, but does not include a preformed diagonal crack. One crack was formed during loading of this wall at the 16 th course of the wall. This is a location with horizontal joint reinforcement included. This crack was visible on the front face of the brick during suction loading and the back of the brick during pressure loading. The wall failed by nail pullout from the wood framing. The maximum loads observed were 2117 lb. and 1016 lb. in suction and pressure, respectively. 126
146 Appendix B.10 In-Plane Testing Setup Figure B.96 Diagram of Diagonal Shear Test Specimen Figure B.97 Photograph of Diagonal Shear Test Specimen 127
147 128
148 Appendix B.11 Diagonal Shear Test Results Load (lb.) Time (sec) Figure B.98 DS-01-A Load vs. Time Load (lb.) Time (sec) Figure B.99 DS-01-B Load vs. Time 129
149 Load (lb.) Time (sec) Figure B.100 DS-01-C Load vs. Time Load (lb.) Time (sec) Figure B.101 DS-01-D Load vs. Time 130
150 Load (lb.) Time (sec) Figure B.102 DS-02-A Load vs. Time Load (lb.) Time (sec) Figure B.103 DS-02-B Load vs. Time 131
151 Load (lb.) Time (sec) Figure B.104 DS-02-C Load vs. Time Load (lb.) Time (sec) Figure B.105 DS-02-D Load vs. Time 132
152 Table B.11 Maximum Loads for Diagonal Shear Tests Specimen Max Load (lbs) Specimen Max Load (lbs) DS-01-A DS-02-A DS-01-B DS-02-B DS-01-C DS-02-C ** DS-01-D DS-02-D Average Average COV 3.57% COV 5.45% **The results of this test are not included in the average and COV calculations as a portion of the loading was carried by the supporting chains as previously discussed. 133
153 Appendix B.12 Flexural Bond Strength Testing Setup Figure B.106 Specimen from Group FBS-11 Figure B.107 Specimen from Group FBS-05 Figure B.108 Specimen from Group FBS

154 Figure B.109 Specimen from Group FBS-01 Figure B ga Corrugated Metal Wall Tie Figure B ga Corrugated Metal Wall Tie with Clip 135

155 Figure B ga Corrugated Metal Wall Tie with Joint Reinforcement Attached Figure B.113 Triangular Wire Wall Tie Figure B.114 Square Wire Wall Tie 136