Best Practices in Supply Chain: A Nucor Perspective Rob Roberson
|
|
|
- Charleen Lindsey
- 5 years ago
- Views:
Transcription
1 Best Practices in Supply Chain: A Nucor Perspective Rob Roberson Director of Logis-cs March 30, 2016
2 Discussion Outline Brief Introduc-on to Nucor Economic Climate and the Steel Business Best Prac-ces in Supply Chain Execu-on
3 A BRIEF INTRODUCTION TO

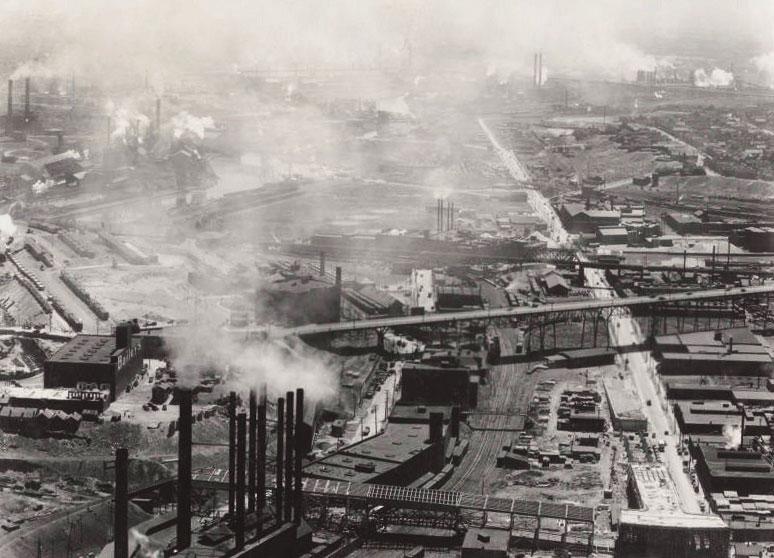

4 Perception of Steel Steel Mills of the Early 20th Century

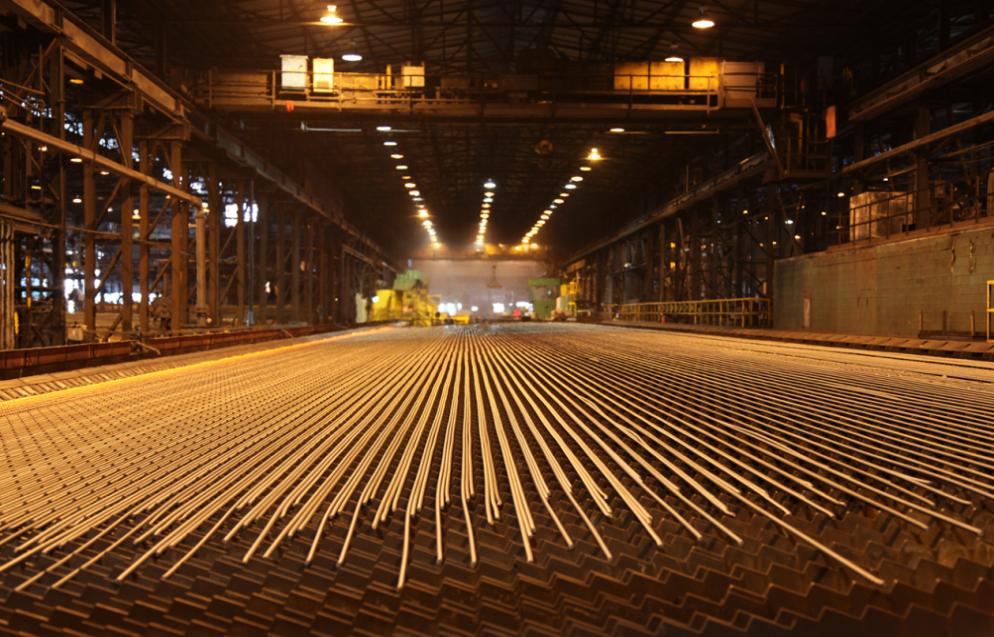


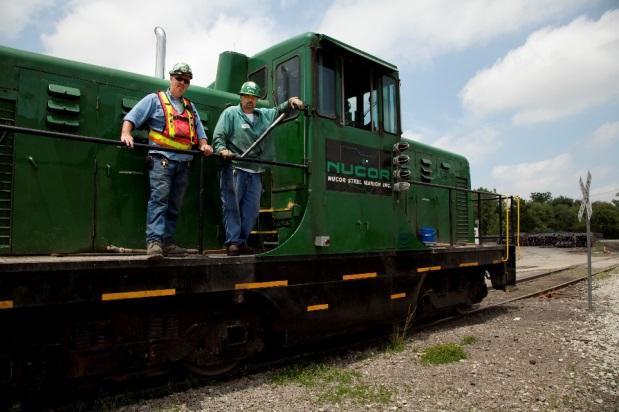
5 Today s Steel Mill


6 The Nucor Story Nuclear Corpora-on of America, which would later become Nucor, first entered into the steel industry with the purchase of VulcraL, making steel joists and girders. Ken Iverson, Nucor s founder and president, decided to introduce minimills to the American steel industry to compete against tradi-onal blast furnaces, and to supply VulcraL with steel at a bever price. Original Vulcraft facility in 1962 Nucor s first President, Ken Iverson

7 Nucor s Beginnings Nucor s beginnings are rooted in auto manufacturing da-ng back to the turn of the 20th century Facili-es 3 Annual Sales $21 million Fortune rank Unranked Employees About 700 Sales per Employee $30,000
8 Nucor Today FACILITIES NORTH AMERICA S MOST DIVERSIFIED STEEL & STEEL PRODUCTS COMPANY Over 200 loca8ons 2015 NET SALES $16.4 Billion 2015 NET EARNINGS $357.7 Million FORTUNE 500 RANKING 139 TEAMMATES 23, SALES PER TEAMMATE $690, CONSECUTIVE QUARTERS OF CASH DIVIDENDS THROUGH 4 th QUARTER 2015
9


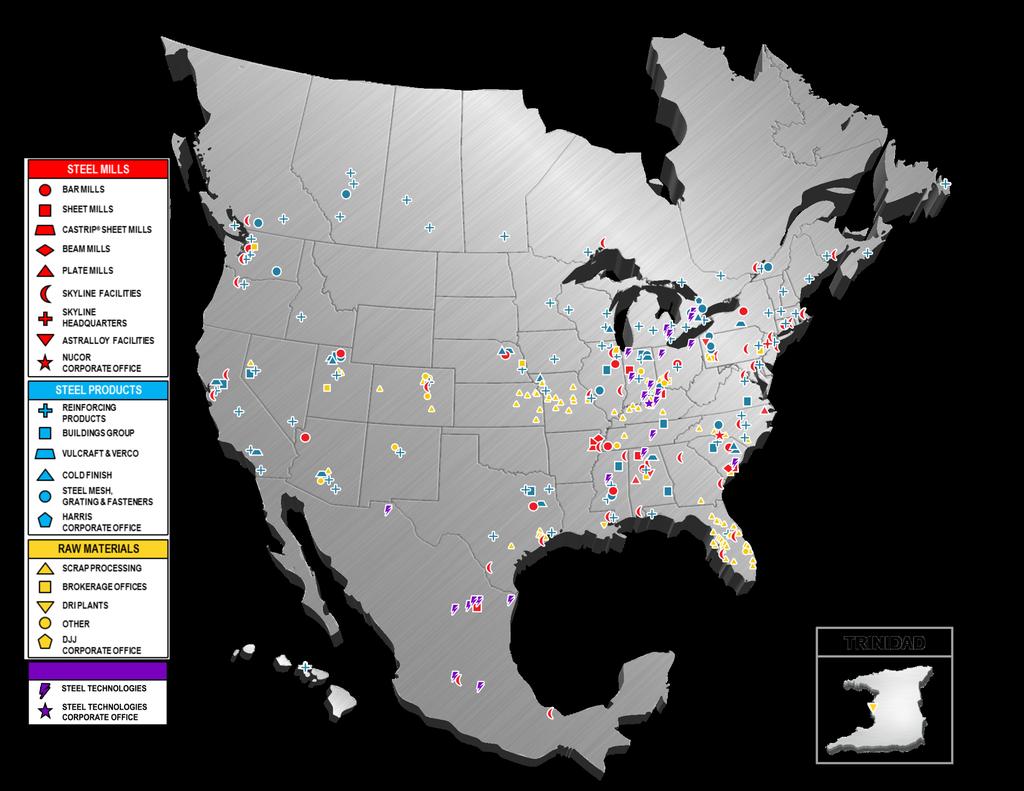
10 Nucor Steel Mills Bar Mills Sheet Mills Castrip Mills Beam Mills Plate Mills Nucor Corporate Office
11 Nucor's Production Capacity Steel Mills Sheet, Bar, Structural, Plate Steel Products Annual Tons Steel Joists, Steel Deck, Cold Finish Bar, Bright Bar, Buildings Group, Rebar Fabrication, Steel Mesh, Grating, Fasteners Raw Materials (Iron Units) Direct Reduced Iron (DRI), Ferrous Scrap Processing 28.8 Million and Growing 4.6 Million and Growing 9.7 Million and Growing TOTAL CAPACITY 43.1 Million and Growing
12 Diversified Product Mix Total Tons 2015 Raw Materials 12% Sheet 36% Downstream Products 13% Plate 8% Structural 10% Bar 21%


13 Diversified Market Mix Shipments to Market Segments All Other 6% Converters & Other Value Added Processors 9% Power & Energy Infrastructure 8% Service Centers 29% Construction & Transportation Infrastructure 27% Heavy Equipment, Agriculture, Transportation & Industrial Goods 14% Automotive & Consumer Durables 7%
14 THE MOST DIVERSIFIED PRODUCER OF STEEL AND STEEL PRODUCTS IN NORTH AMERICA Highway Products Steel Framing Building Systems Joist & Decking Fasteners Grating Wire Products Rebar Fabrication Cold Finished Bar Plate Sheet Structural / Piling SBQ Bar Nucor Arcelor Mittal Steel Dynamic s Gerdau Commercia l Metals Company Republic Timken US Steel AK Steel SSAB

15 Market Leadership #1 North American Market Leader Structural Steel Steel Joist Bar Steel Steel Deck Rebar Steel Steel Piling Distribu8on Hot Rolled Sheet Steel Metal Buildings Cold Finished Bar Steel Rebar Fabrica8on, Distribu8on, & Placement #2 North American Market Leader Plate Steel #3 North American Market Leader Sheet Steel (Hot, Cold, Galvanized)


16

17 ECONOMIC CLIMATE AND THE STEEL BUSINESS
18 Disclaimer Statement The following opinions are those of Rob Roberson and should not be universally accepted as correct, nor should they be assumed to be the views of Nucor Viewer Discre-on is advised
 U.S.")


19 The Import Crisis Net Tons of Steel Annually (in Thousands) U.S. Imports (Thousands of Net Tons) 50,000 45,000 40,000 35,000 30,000 25,000 20,000 15,000 10,000 5,000 23,929 28,515 33,475 32,151 44,320 38, steel import levels challenged all-time highs Source: U.S. Imports for Consumption of Steel Products, Foreign Trade Division, U.S. Census Bureau, most recent year annualized from current months
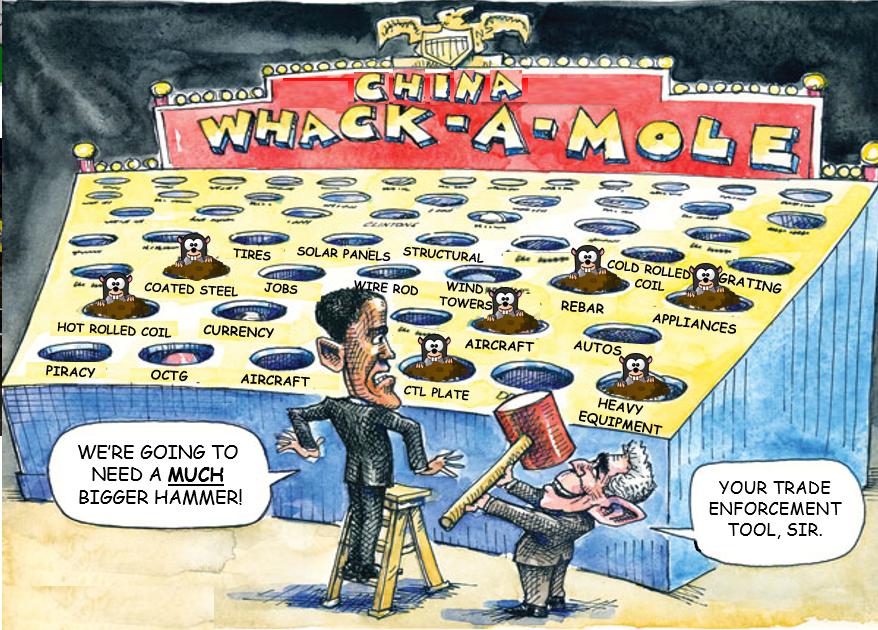

20 Playing Whack-a-Mole
21 U.S. Economic Forecast Percentage Change in U.S. Real GDP Growth 4% 3% 2% 2.5% 1.6% 2.3% 2.2% 2.4% 3.1% 3.1% 2.7% 1% 0% -1% % -3% -2.8% History Forecast -4% Source: IMF World Economic Outlook Note: GDP constant price, annual percent change


22 U.S. Light Vehicle Sales Millions of Units Sold Sources: Auto Alliance, Wards Auto


23 Energy Sector $86 per barrel Down More than 55% since 2013 Crude Oil $ / barrel As % of Price 3 years Ago $38 per barrel


24 BEST PRACTICES IN SUPPLY CHAIN EXECUTION
25 Best Practices in Supply Chain Execution Leverage Collabora-on with Transporta-on Partners Iden-fy Metrics that MaVer Embrace the Visibility Age Focus on Delivering Value

26 Leverage Collaboration
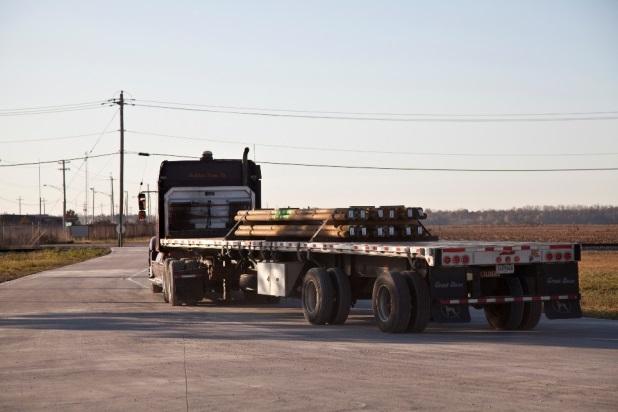
27 Leverage Collaboration Rail Carriers are an extension of us Team Approach to elimina-ng waste and taking cost out of the system Our goal is to take care of our customers


28 Identify Metrics That Matter

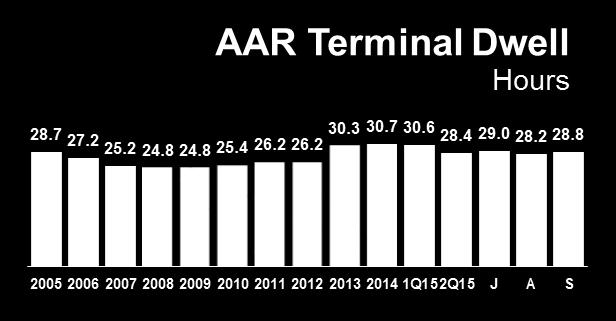
29 Identify Metrics That Matter


30 The Cycle of Success Better Decisions Data Actionable Knowledge Information


31 Embrace the Visibility Age HOME PAGE WORK WITH IN TRANSIT LOAD DETAIL


32 Embrace the Visibility Age! Easy load tracking!!! TMS Updates!! Ease of setup Breadcrumb Mapping Direct communica-on to the TMS system Auto delivery in TMS! Geofencing (5 miles)
33 Focus on Delivering Value Ship Products, Deliver Value! November 5, tons Ryerson Procurement Corp Delivery: November 15, 2015 November 21, 2015 Load Tons Mode Shipped Delivered Rail 11/16/15 05:37 11/16/15 06: Truck 11/17/15 07:45 11/17/15 07: Rail 11/18/15 11:15 11/18/15 12:00 es+mated

34 Focus on Delivering Value


35 QUESTIONS? THANK YOU