Maine Water Conference
|
|
|
- Meredith Davidson
- 5 years ago
- Views:
Transcription

1 Using GIS to bring Superstorm Sandy to Maine: Updating Maine s Hurricane Surge Maps Maine Water Conference April 1, 2014 Rachael E. Dye, Peter A. Slovinsky, Christian H. Halsted Maine Geological Survey Department of Agriculture, Conservation and Forestry Maine Geological Survey Joseph Young, Maine Geolibrary Board Work funded by:

2 Hurricane Sandy becomes extratropical as it approaches the New Jersey and New York shorelines

3 Predicted Hurricane Flood Zones

4 Mantoloking, NJ Actual Flood Zones - Sandy
5 Predicted Hurricane Flood Zones
6 Cat 1-2 impacts predicted Predicted Hurricane Flood Zones
7 Actual Flood Zones - Sandy

8 Actual Flood Zones - Sandy Some of Sandy s inland waterways impacts were between Cat 2-3 Sandy s coastal impacts were between Cat 1-2

9

10

11 Mantoloking, NJ (courtesy of N.J. Air National Guard/Scott Anema)

12 So how can we brace ourselves for a potential hurricane landfall in Maine? Kennebunk, ME

13 Sea, Lake, and Overland Surges from hurricanes (SLOSH)
 horizontally, and 2-3 meters (+- 7 feet) vertically.")
14 In Maine, older SLOSH modeling results from 2005 were taken by the Corps of Engineers and overlain onto the National Elevation Dataset (NED) topographic data. This data is accurate to about <10 meters (~30 feet) horizontally, and 2-3 meters (+- 7 feet) vertically. This was used to create Maine s previous SLOSH inundation layers
15 Goals of Our Project Use updated SLOSH model outputs and an internally created GIS model to create data that can be used to: 1) More accurately represent potential hurricane inundation zones for Category 1 and 2 events in Maine; 2) Using this data, help to identify vulnerable critical public infrastructure such as roads, rails, and waste-water treatment facilities 3) Increase effective emergency preparedness and planning
16 Example of new NHC SLOSH Model Display v. 1.65i
17 The SLOSH Display Data utilized. Composite Approach - Predicts surge by running SLOSH several thousand times with hypothetical hurricanes under different storm conditions. The products generated from this approach are the Maximum Envelopes of Water (MEOWs) and the Maximum of MEOWs (MOMs) which are regarded by NHC as the best approach for determining storm surge vulnerability for an area since it takes into account forecast uncertainty. The MEOWs and MOMs play an integral role in emergency management as they form the basis for the development of the nation's evacuation zones.
18 6) Quality-controlled results and created a state-wide SLOSH dataset for Category 1 and 2 events New SLOSH Data Development Process 1) Reviewed previous SLOSH mapping methodology and results 2) Consulted with NHC FEMA and USACE representatives on our tool development, proposed process, and techniques 3) Developed a GIS-based tool that takes outputs from the SLOSH model and overlays it onto LiDAR data and uses an interpolation method to inundate areas 4) Ground-truthed the tool by using old topographic data to see if we could re-create the previously created SLOSH layers 5) Ran the tool for the Maine coastline using MOMs in sections based on hydrologic and geomorphic boundaries
19 4) Results from these SLOSH simulations should be considered for general planning purposes only. Data is especially geared towards emergency management planning and response. Some important assumptions and limitations 1) SLOSH model does not model the impacts of waves on top of the surge, normal river flow or rain flooding, nor does it explicitly model changes in the astronomical tide. 2) The model may thus under-predict coastal flooding, especially along low-lying coastal barriers that may be overtopped by wave action. 3) LiDAR data represents a snapshot in time of topography, and conditions may have changed. It is not 100% accurate in representing ground conditions which may have changed since data was acquired.

20 Creation of statewide inundation datasets using the updated SLOSH outputs for the Maine coast for both Cat 1 and Cat 2 under mean tide and mean high tide scenarios, and new LiDAR. Funded by

21 This is the topographic data used to create the 2005 SLOSH layers NED 10 m DEM Vertical accuracy m

22 We used much more accurate topographic data LiDAR 2 m DEM Vertical accuracy m

23 We developed an ArcGIS python scripted tool for analyzing SLOSH outputs and LiDAR data
")
24 The updated SLOSH model provides more accurate output grids of storm tide flood elevations (e.g., Cat 1 at MHT)

25 The SLOSH tool takes these grids and assigns a centroid value to each grid cell (99.9 = no data).
26 The SLOSH tool then calculates a raster of point influence using a nearest neighbor interpolation method to influence nearby coastal areas

27 In some locations, point influence needs to be manually edited based on hydrology or geomorphology

28 If needed, polygon boundaries are manually drawn and the tool re-run to create more valid point influence and point raster outputs
29 Subsequent SLOSH Tool Steps Once the point influence raster is finalized (and edited, as needed), the point value raster is compared with the LiDAR data (2 m cells) to find where the LiDAR data is either higher than (i.e., dry ) or lower than (i.e., wet ) the storm tide elevation. This is also done for the +20% value. The result is a raster of inundation depths and a raster used to define the boundary between wet and dry areas. The output rasters are then converted to polygons to define the extent of potential inundation along the coastline (and the +20% error).

30 Next, we ground-truthed the tool by comparing OLD SLOSH outputs with new outputs from the tool using the National Elevation Dataset DEM. For planning purposes only.

31 For planning purposes only.

32 Then, we ran the tool to create new SLOSH outputs. For planning purposes only. NEW output (CAT 2)
 NEW output (CAT 2) For planning purposes")
33 #6 And then Compare compared OLD SLOSH OLD SLOSH outputs outputs with NEW with NEW SLOSH SLOSH outputs outputs OLD output (CAT 2) NEW output (CAT 2) For planning purposes only.

34 We added some functionality to the tool s outputs - a +20% error band since the model s inherent error is +/-20% of the output cell value For planning purposes only.
 For planning")
35 And we added the functionality of outputting potential inundation depths associated with the SLOSH scenarios (not accounting for error) For planning purposes only.

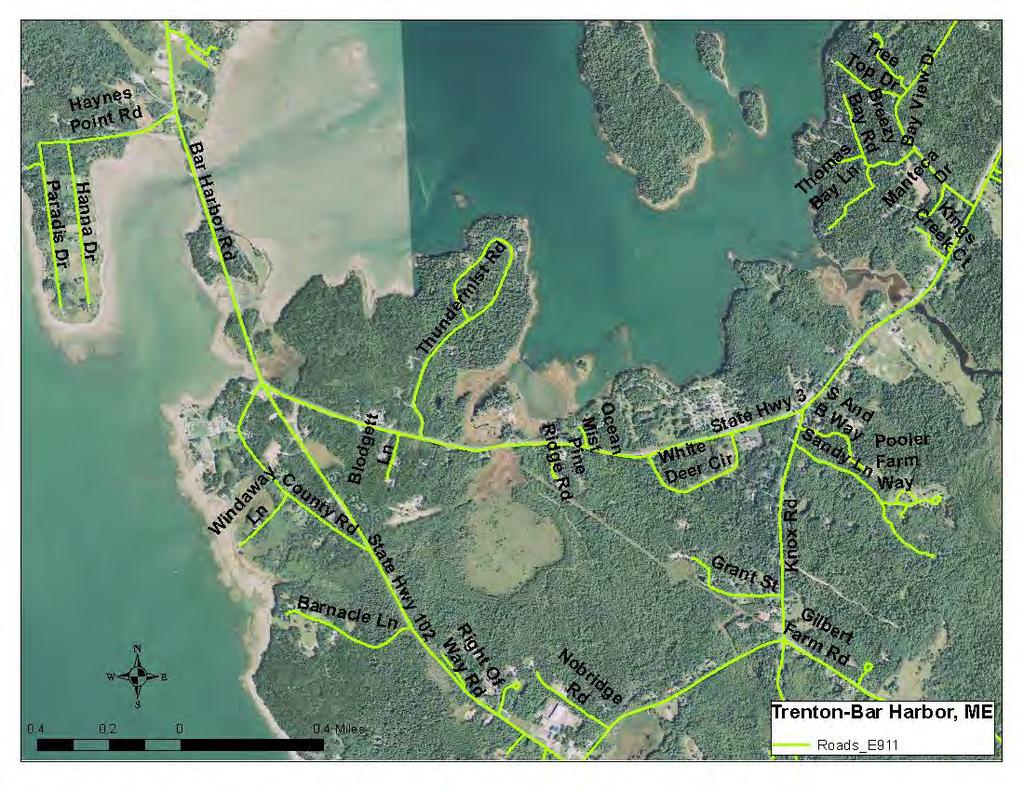
36 Some locations comparing old and new SLOSH mapping results Downtown Machias Trenton and Bar Harbor Damariscotta Waterfront Bath Waterfronts Portland and South Portland Goose Rocks Beach, Kennebunkport Short and Long Sands Beach, York Portsmouth Naval Shipyard, Kittery
37

38 For planning purposes only

39 For planning purposes only

40 Route 1A Ridge Rd Railroad Ave Route 1A

41 Route 1A Old SLOSH Ridge Rd Railroad Ave Route 1A For planning purposes only

42 Route 1A New SLOSH Ridge Rd Railroad Ave Route 1A For planning purposes only
43 New Biddeford Road Dyke Rd Kings Hwy

44 Old SLOSH New Biddeford Road Dyke Rd Kings Hwy For planning purposes only

45 New SLOSH New Biddeford Road Dyke Rd Kings Hwy For planning purposes only
46 Commercial St Front St HighSt
47 Old SLOSH Commercial St Front St HighSt For planning purposes only

48 New SLOSH Commercial St Front St HighSt For planning purposes only

49 Commercial St Route 1 BIW
50 Old SLOSH Commercial St Route 1 BIW For planning purposes only

51 New SLOSH Commercial St Route 1 BIW For planning purposes only

52 Main St Route 129

53 Main St Route 129 For planning purposes only

54 Main St Route 129 For planning purposes only
55
56 Old SLOSH For planning purposes only For planning purposes only

57 For planning purposes only New SLOSH

58

59 For planning purposes only

60 For planning purposes only
61 So what is the status of this data? Data completed for Category 1 and 2 events making landfall at mean tide and mean high tide Data will be reviewed by NHC FEMA and US Army Corps partners before full release to public Preliminary data presented to Lincoln County EMA personnel (local, regional, county) and feedback garnered on utility of the datasets Lincoln County Regional Planning Commission is working to develop printable workbooks of results With MEMA, working to develop educational outreach materials (flyer, etc.) advertising that this dataset has been developed and will be provided to EMAs Data layers will likely be distributed via ArcGIS online

62 Draft Postcard (FRONT)
63 Draft Postcard (BACK)

64 Thank you! Using GIS to bring Superstorm Sandy to Maine: Updating Maine s Hurricane Surge Maps Washingtonpost.com Peter A. Slovinsky, Marine Geologist Maine Geological Survey, Department of Agriculture, Conservation, and Forestry peter.a.slovinsky@maine.gov