Practices and Perceptions of Urban Forest Waste Generation and Utilization in Virginia
|
|
|
- Harold Osborne
- 5 years ago
- Views:
Transcription


1 Practices and Perceptions of Urban Forest Waste Generation and Utilization in Virginia P. Eric Wiseman, Ph.D. Associate Professor of Urban Forestry Department of Forest Resources & Environmental Conservation Virginia Tech Reclaiming Urban Wood: Opportunities and Barriers to Success Northern Virginia Urban Forestry Quarterly Roundtable Manassas, VA July 13, 2017
 Virginia Tech Dept.")
2 Acknowledgements o Charlie Becker Utilization & Marketing Manager Virginia Department of Forestry o Jordan Endahl Graduate Student Virginia Tech Dept. of Forest Resources & Environmental Conservation o Chad Bolding and John Munsell Faculty (Graduate Committee) Virginia Tech Dept. of Forest Resources & Environmental Conservation o Beta Testers of Our Survey Instrument o Survey Respondents
3 Overview o Background and rationale for the study o Study methods o Key findings of the study o Notable limitations of the study o Conclusions and Q & A
4 Background and Rationale for the Study o Issue: no statewide empirical information about urban forest waste generation and utilization o Need: reliable information to guide technical assistance and capacity building across the state o Study goals: Identify the origin and fate of urban forest waste (UFW) Estimate the amount of UFW generated by primary public and private urban forestry operations Identify the urban forest products (UFP) created when UFW is utilized rather than disposed Understand the perceptions of urban forestry operators toward UFW and UFP
5 Study Methods CONCEPTUAL MODEL UFW Generation Municipal Lands Landscape Tree Pruning and Removal Right-of-Way Vegetation Management Forest and Yard Sanitation Land Clearing Timber Harvest Non-Municipal Lands Types of UFW Logs Wood Chips Brush UFW Disposal Left On-Site Hauled to Solid Waste Facility Fate of UFW By Generator By Property Owner By Third Party UFW Utilization


6 Study Methods CONCEPTUAL MODEL By Generator By Property Owner By Third Party UFW Utilization Urban Forest Products (UFPs)
7 Study Methods STUDY POPULATION AND SAMPLING FRAME o 91 urban municipalities in Virginia All independent cities (38) All incorporated towns >2.5k population (48) All counties >826 persons per square mile (5) o 784 ISA Certified Arborists with Virginia mailing address Municipal Employees: Field arborists Urban foresters Horticulturalists City/town/county planners City/town/county managers Parks & rec. administrators Public works administrators 61% Response Rate Private Arborists: Arboreta Institutions Universities VDOT contractors Utility contractors Tree care companies Landscape companies 31% Response Rate o Web-based survey conducted in spring of 2014
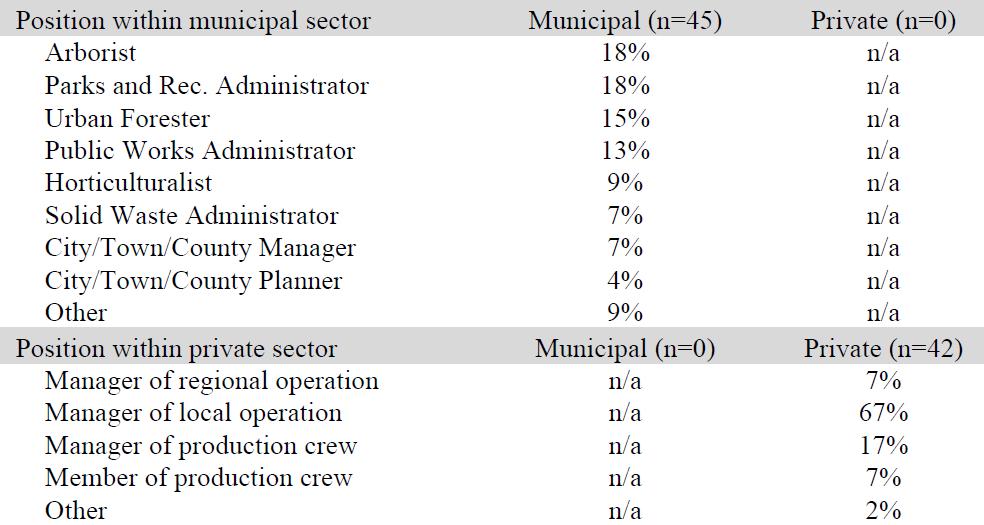
8 Respondent Demographics
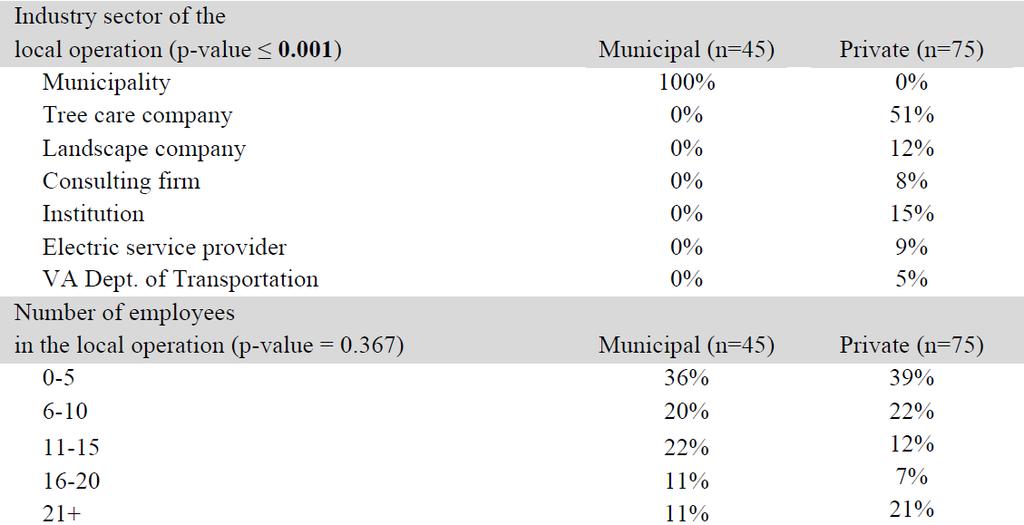
9 Respondent Demographics
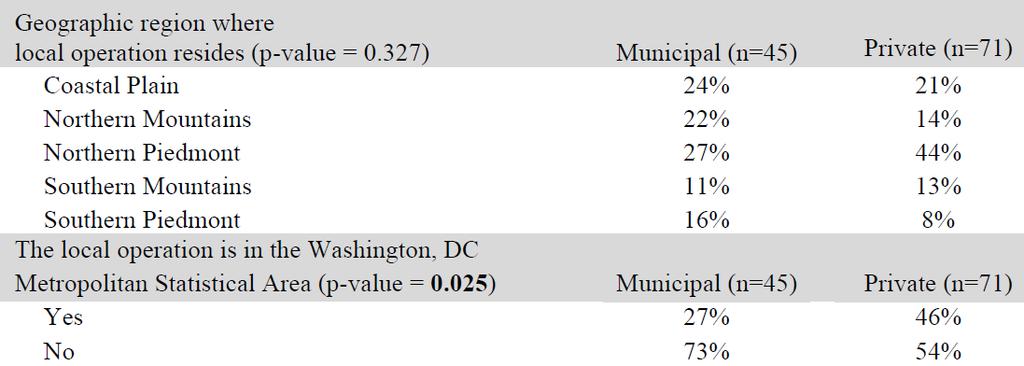
10 Respondent Demographics
11 Do operators know how much UFW they are generating? Municipal Operations n = 44 n = 65 Private Operations 3% 14% Keep detailed records 26% 61% 25% Can provide an estimate Cannot provide an estimate p = %

12 Where does urban forest waste originate?
13 Do operators know the fate of the UFW they are generating? Municipal Operations Private Operations n = 44 n = 63 9% 5% 49% 42% Keep detailed records Can provide an estimate Cannot provide an estimate 41% 54% p = 0.388
14 What is the fate of logs generated as UFW by these operators? Municipal Operations n = 19 n = 35 9% Transferred to a 3rd party Private Operations 9% 14% 26% Disposed at MSW facility 13% 42% Utilized in-house 16% 27% 24% Utilized on-site Left on-site 20% No distribution difference, municipal vs. private
15 What UFPs are created from the logs that are utilized in-house? Municipal Operations Private Operations Top 3 UFPs: 1. Firewood (42%) Top 3 UFPs: n = 10 n = Firewood (52%) 2. Lumber (18%) 2. Lumber (17%) 3. Mulch (8%) 3. Mulch (17%) No distribution difference, municipal vs. private
16 What is the fate of wood chips generated as UFW by these operators? Municipal Operations Private Operations n = 18 n = 35 5% 5% Transferred to a 3rd party 29% Disposed at MSW facility 9% 7% 47% * 14% Utilized in-house (p=0.041) Utilized on-site 22% * 53% Left on-site 9% p = 0.041*
17 What UFPs are created from the wood chips that are utilized in-house? Municipal Operations Private Operations Top 3 UFPs: 1. Mulch (75%) Top 3 UFPs: n = 16 n = Mulch (63%) 2. Compost (21%) 2. Compost (20%) 3. Pellets (3%) 3. Biomass (10%) No distribution difference, municipal vs. private
18 What is the fate of brush generated as UFW by these operators? Municipal Operations Private Operations n = 20 n = 33 3% 5% 28% Transferred to a 3rd party Disposed at MSW facility Utilized in-house 4% 13% 32% 43% 21% Utilized on-site Left on-site 31% 20% No distribution difference, municipal vs. private
19 What UFPs are created from the brush that is utilized in-house? Municipal Operations Private Operations Top 3 UFPs: 1. Mulch (76%) Top 3 UFPs: n = 13 n = Mulch (52%) 2. Compost (21%) 2. Compost (28%) 3. Biomass (4%) 3. Other (13%) No distribution difference, municipal vs. private

20 How do operators perceive UFW utilization? Level of agreement scale: 1 = strongly agree, 2 = somewhat agree, 3 = neither agree nor disagree, 4 = somewhat disagree, 5 = strongly disagree.

21 How do operators perceive UFW utilization? Level of agreement scale: 1 = strongly agree, 2 = somewhat agree, 3 = neither agree nor disagree, 4 = somewhat disagree, 5 = strongly disagree.
22 What do operators perceive as incentives for increasing UFW utilization? Municipal Operations Private Operations Top 3 incentives: 1. Avoidance of disposal fees (79%) Top 3 incentives: n = 52 n = Avoidance of disposal fees (69%) 2. Environmental sustainability of the operation or community (69%) 2. Environmental sustainability of the operation or community (67%) 3. Avoidance of transportation or shipping costs (44%) 3. Avoidance of transportation or shipping costs (53%) No distribution difference, municipal vs. private
23 What do operators perceive as barriers for increasing UFW utilization? Municipal Operations Private Operations Top 3 barriers: 1. Lack of in-house equipment for processing UFW (56%) * Top 3 barriers: n = 52 n = Lack of local processors of UFW (48%) 2. Lack of in-house space for stockpiling UFW (52%) 2. Lack of in-house space for stockpiling UFW (41%) * 3. Lack of local processors of UFW (42%) 3. Logistical difficulties of transporting UFW to processors (40%) p = 0.001*
24 Notable Limitations of the Study o Only major urban localities were surveyed. Selected localities account for 9% of state land area and 64% of total population o Only ISA certified arborists were surveyed. Likely excluded numerous landscaping and land clearing firms o Small sample sizes for some survey questions. High uncertainty about fate of UFW amongst these operators Very low participation by these operators in creating UFPs from UFW
25 Conclusions and Q & A o Municipalities and private operations reported disposing less than 25% of their UFW at a solid waste facility. o The majority of logs were utilized to produce firewood or lumber, while the majority of wood chips and brush were utilized to produce mulch or compost. o Regardless of operation type, UFW is rarely left on-site, indicating that UFW is being handled and transported in the majority of municipal and arborist operations.
26 Conclusions and Q & A o Two-thirds of respondents (65%) agreed or strongly agreed that UFW utilization is a major issue for the urban forestry industry. o Primary incentives for utilization were avoidance of disposal fees and hauling costs. o Municipalities cited lack of processing equipment as their primary barrier whereas private arborists cited lack of local processors.